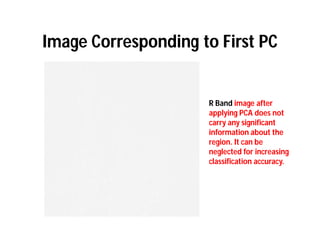
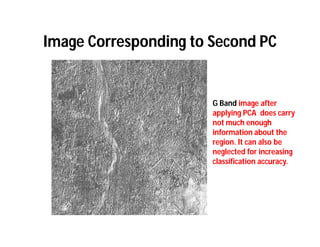
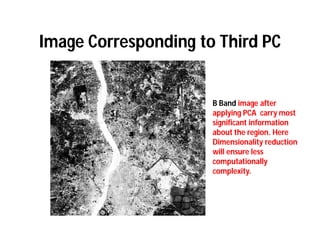
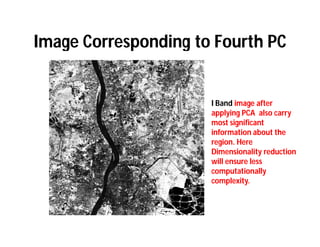
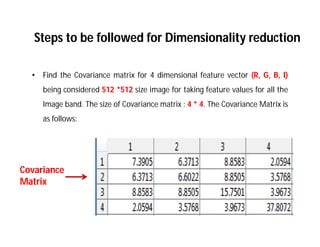
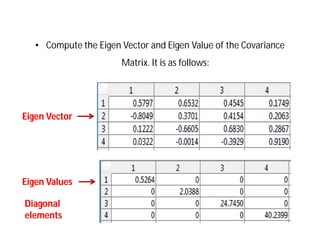
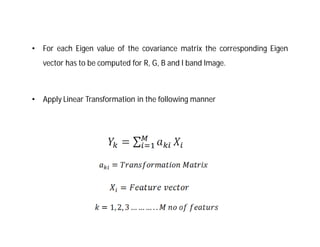
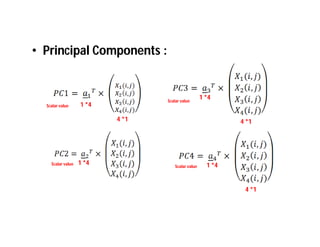
Practical Implementation of PCA
       on Satellite Images
Image Corresponding to First PC


                     R Band image after
                     applying PCA does not
                     carry any significant
                     information about the
                     region. It can be
                     neglected for increasing
                     classification accuracy.
Image Corresponding to Second PC


                       G Band image after
                       applying PCA does carry
                       not much enough
                       information about the
                       region. It can also be
                       neglected for increasing
                       classification accuracy.
Image Corresponding to Third PC


                      B Band image after
                      applying PCA carry most
                      significant information
                      about the region. Here
                      Dimensionality reduction
                      will ensure less
                      computationally
                      complexity.
Image Corresponding to Fourth PC


                      I Band image after
                      applying PCA also carry
                      most significant
                      information about the
                      region. Here
                      Dimensionality reduction
                      will ensure less
                      computationally
                      complexity.
Steps to be followed for Dimensionality reduction

  •   Find the Covariance matrix for 4 dimensional feature vector (R, G, B, I)
      being considered 512 *512 size image for taking feature values for all the
      Image band. The size of Covariance matrix : 4 * 4. The Covariance Matrix is
      as follows:


Covariance
Matrix
• Compute the Eigen Vector and Eigen Value of the Covariance
                       Matrix. It is as follows:


Eigen Vector


Eigen Values

Diagonal
elements
•   For each Eigen value of the covariance matrix the corresponding Eigen
    vector has to be computed for R, G, B and I band Image.


•   Apply Linear Transformation in the following manner
• Principal Components :


                                 Scalar value
                                                   1 *4
  Scalar value     1 *4

                          4 *1                              4 *1


    Scalar value   1 *4             Scalar value     1 *4


                                                             4 *1
Few Points to display output image
•   Apply this command to display the principal component(PC) image for
    visualization purposes:

                        imshow(histeq(uint8(out_img1)));


•   If sum of the Eigen values = Sum of the variance (Diagonal element of
    covariance matrix) of the covariance matrix then the Eigen values for the
    corresponding covariance matrix is correct.

Practical implementation of pca on satellite images

  • 1.
    Practical Implementation ofPCA on Satellite Images
  • 2.
    Image Corresponding toFirst PC R Band image after applying PCA does not carry any significant information about the region. It can be neglected for increasing classification accuracy.
  • 3.
    Image Corresponding toSecond PC G Band image after applying PCA does carry not much enough information about the region. It can also be neglected for increasing classification accuracy.
  • 4.
    Image Corresponding toThird PC B Band image after applying PCA carry most significant information about the region. Here Dimensionality reduction will ensure less computationally complexity.
  • 5.
    Image Corresponding toFourth PC I Band image after applying PCA also carry most significant information about the region. Here Dimensionality reduction will ensure less computationally complexity.
  • 6.
    Steps to befollowed for Dimensionality reduction • Find the Covariance matrix for 4 dimensional feature vector (R, G, B, I) being considered 512 *512 size image for taking feature values for all the Image band. The size of Covariance matrix : 4 * 4. The Covariance Matrix is as follows: Covariance Matrix
  • 7.
    • Compute theEigen Vector and Eigen Value of the Covariance Matrix. It is as follows: Eigen Vector Eigen Values Diagonal elements
  • 8.
    • For each Eigen value of the covariance matrix the corresponding Eigen vector has to be computed for R, G, B and I band Image. • Apply Linear Transformation in the following manner
  • 9.
    • Principal Components: Scalar value 1 *4 Scalar value 1 *4 4 *1 4 *1 Scalar value 1 *4 Scalar value 1 *4 4 *1
  • 10.
    Few Points todisplay output image • Apply this command to display the principal component(PC) image for visualization purposes: imshow(histeq(uint8(out_img1))); • If sum of the Eigen values = Sum of the variance (Diagonal element of covariance matrix) of the covariance matrix then the Eigen values for the corresponding covariance matrix is correct.