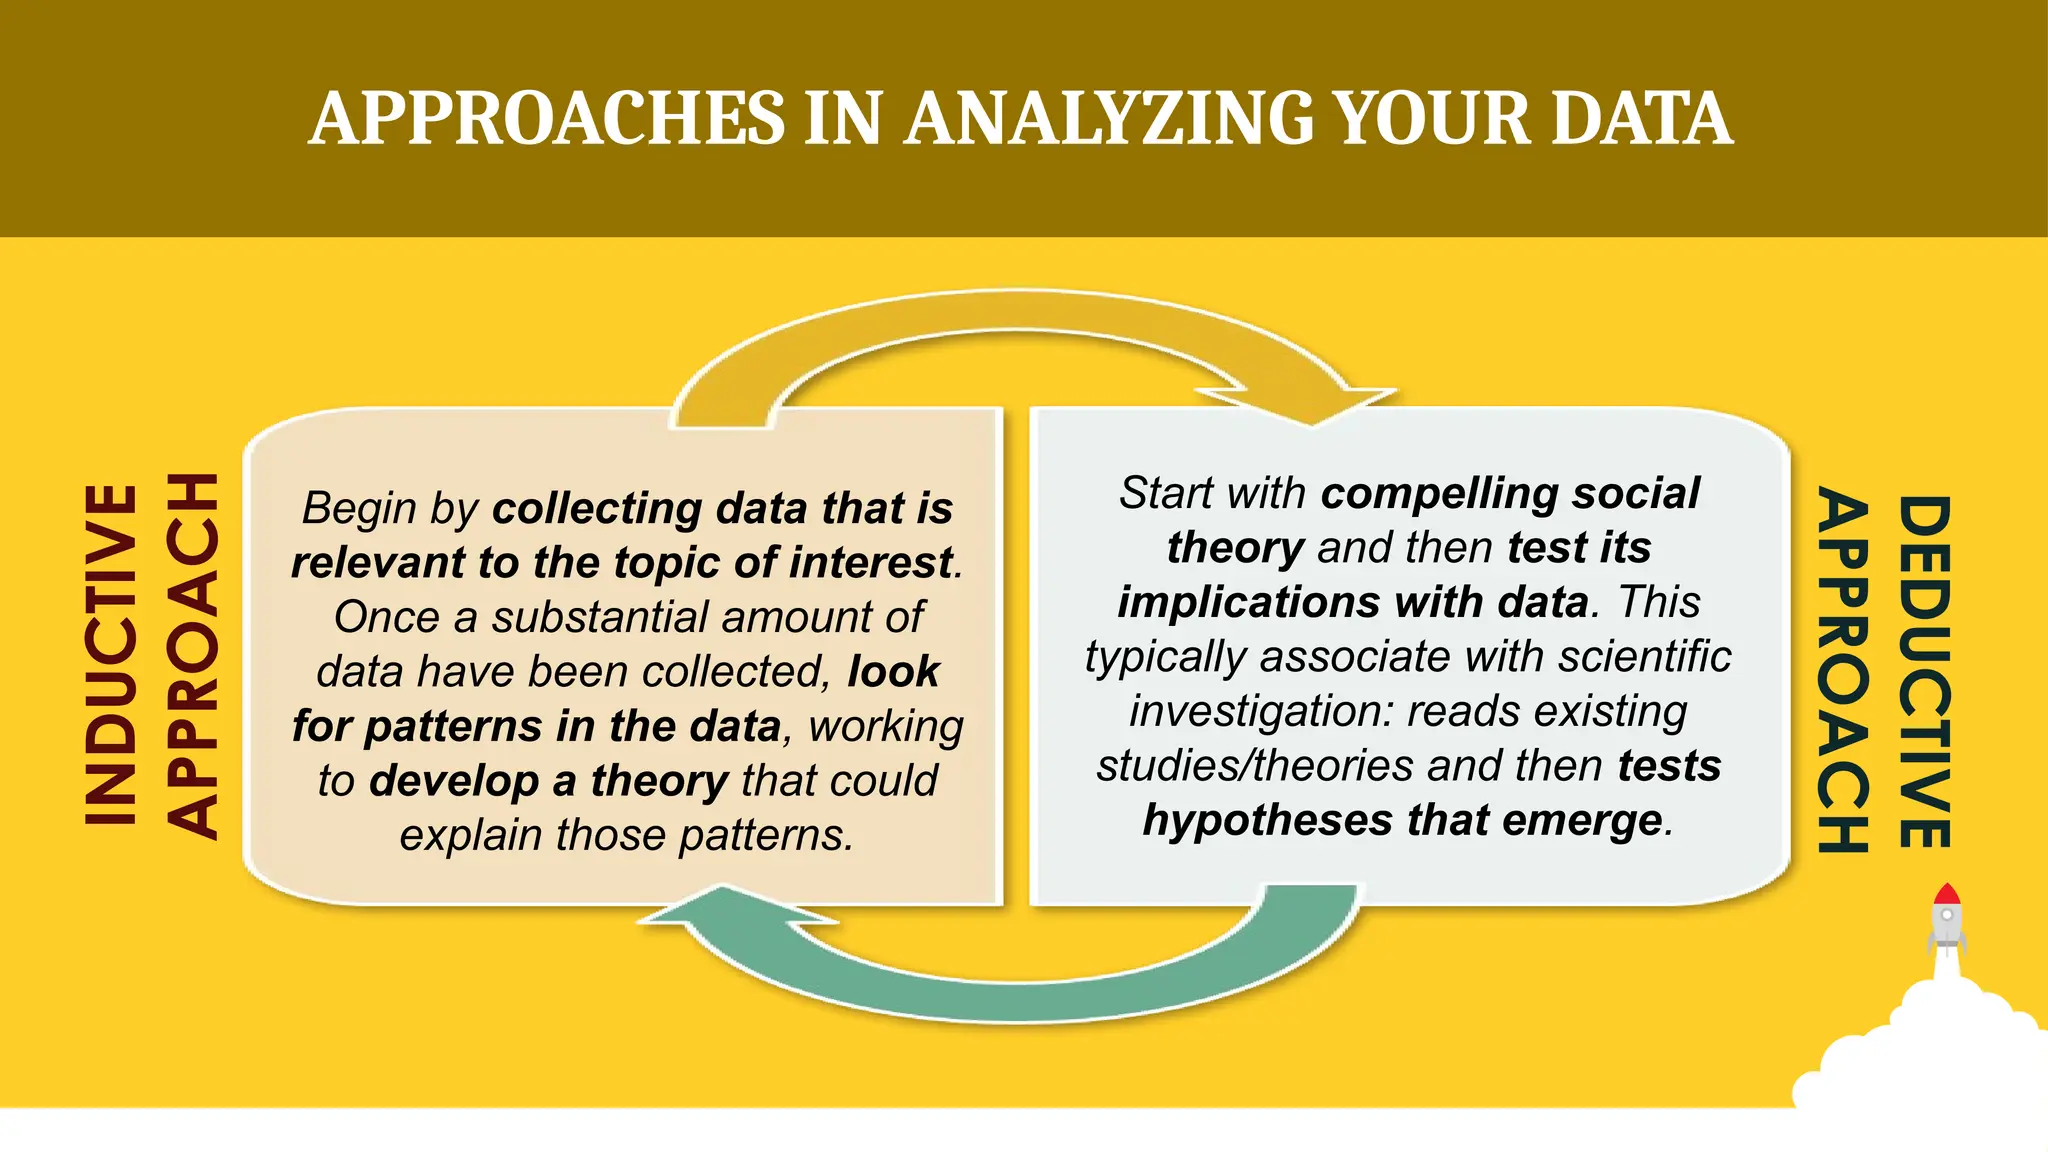
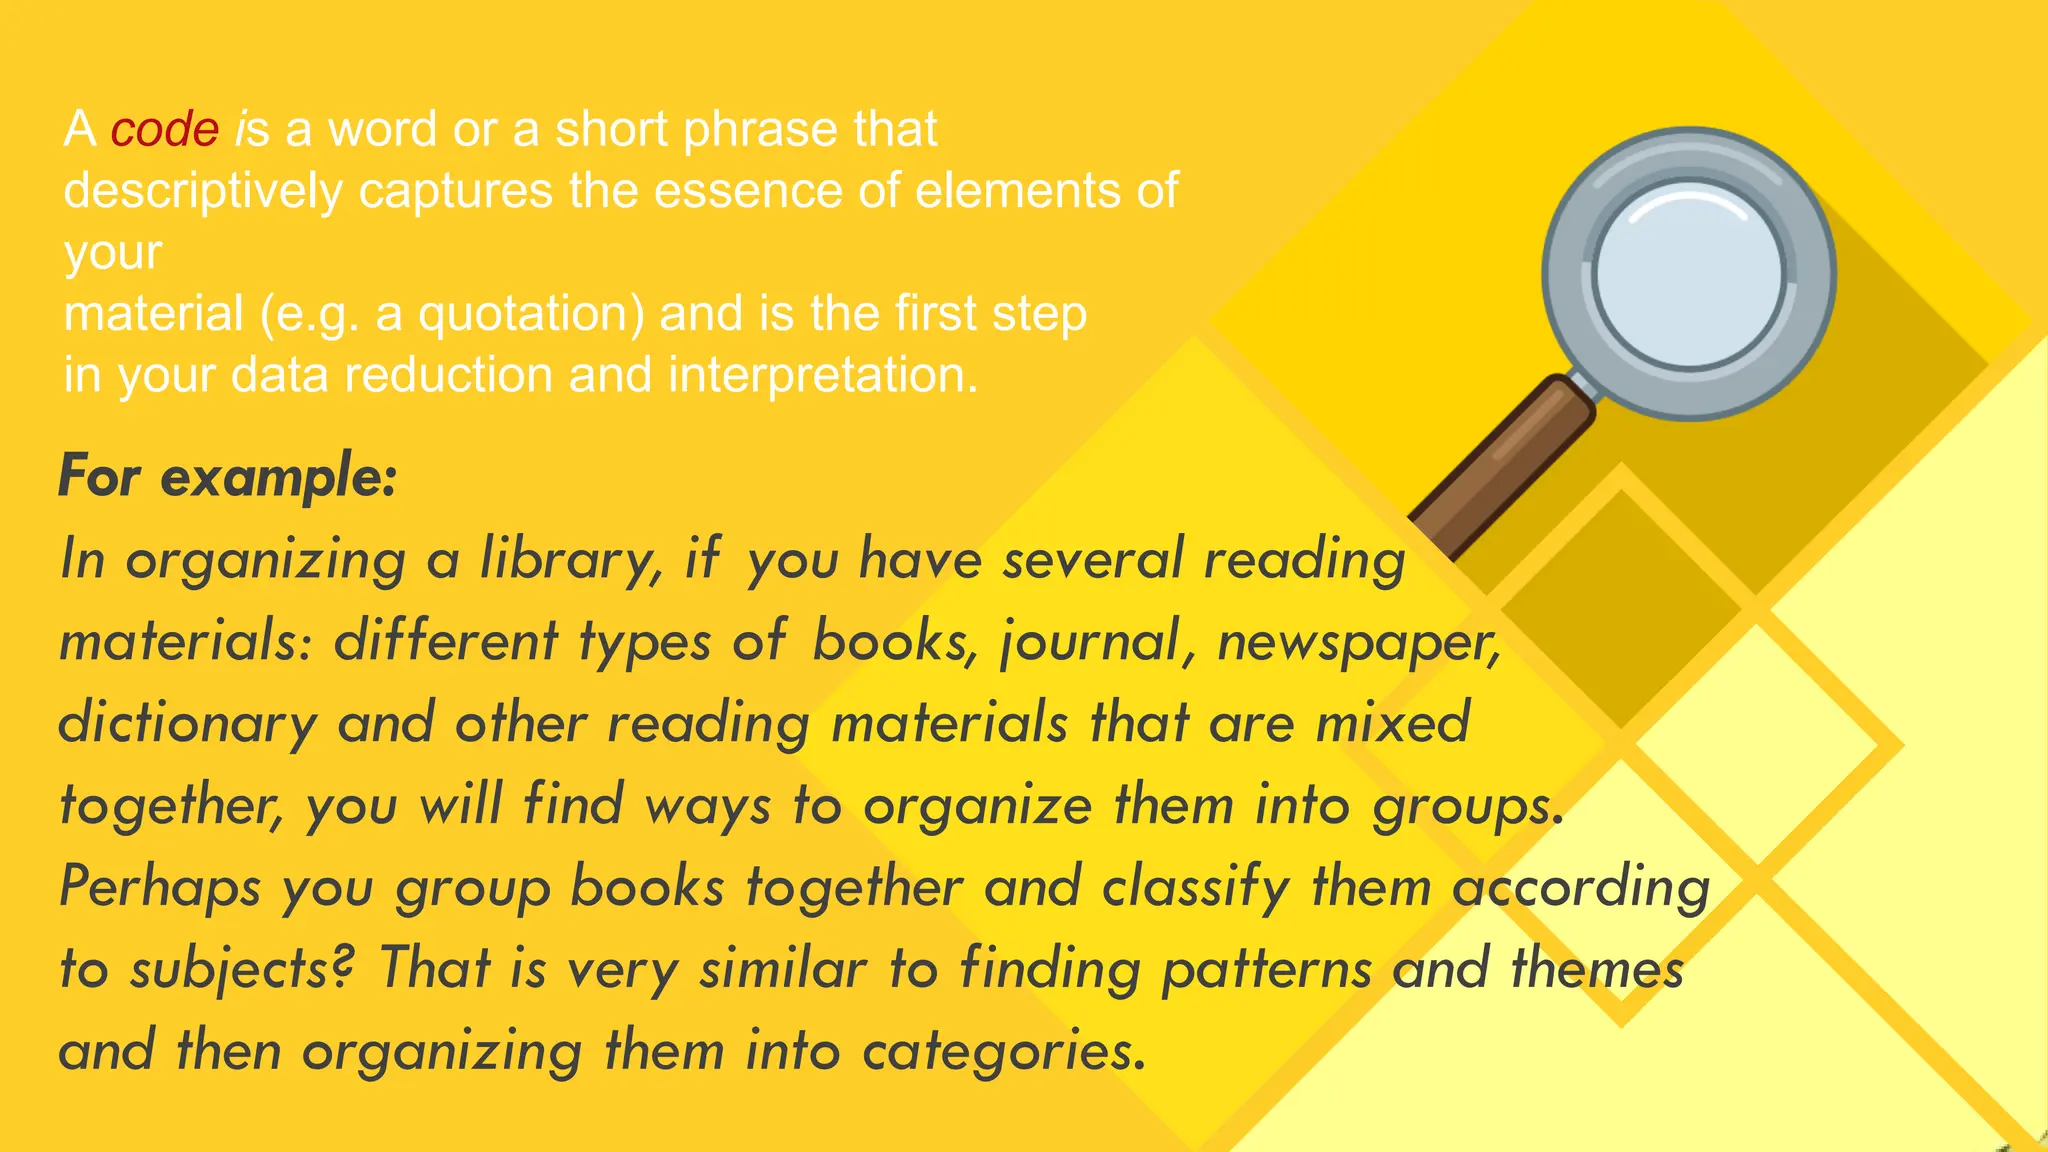
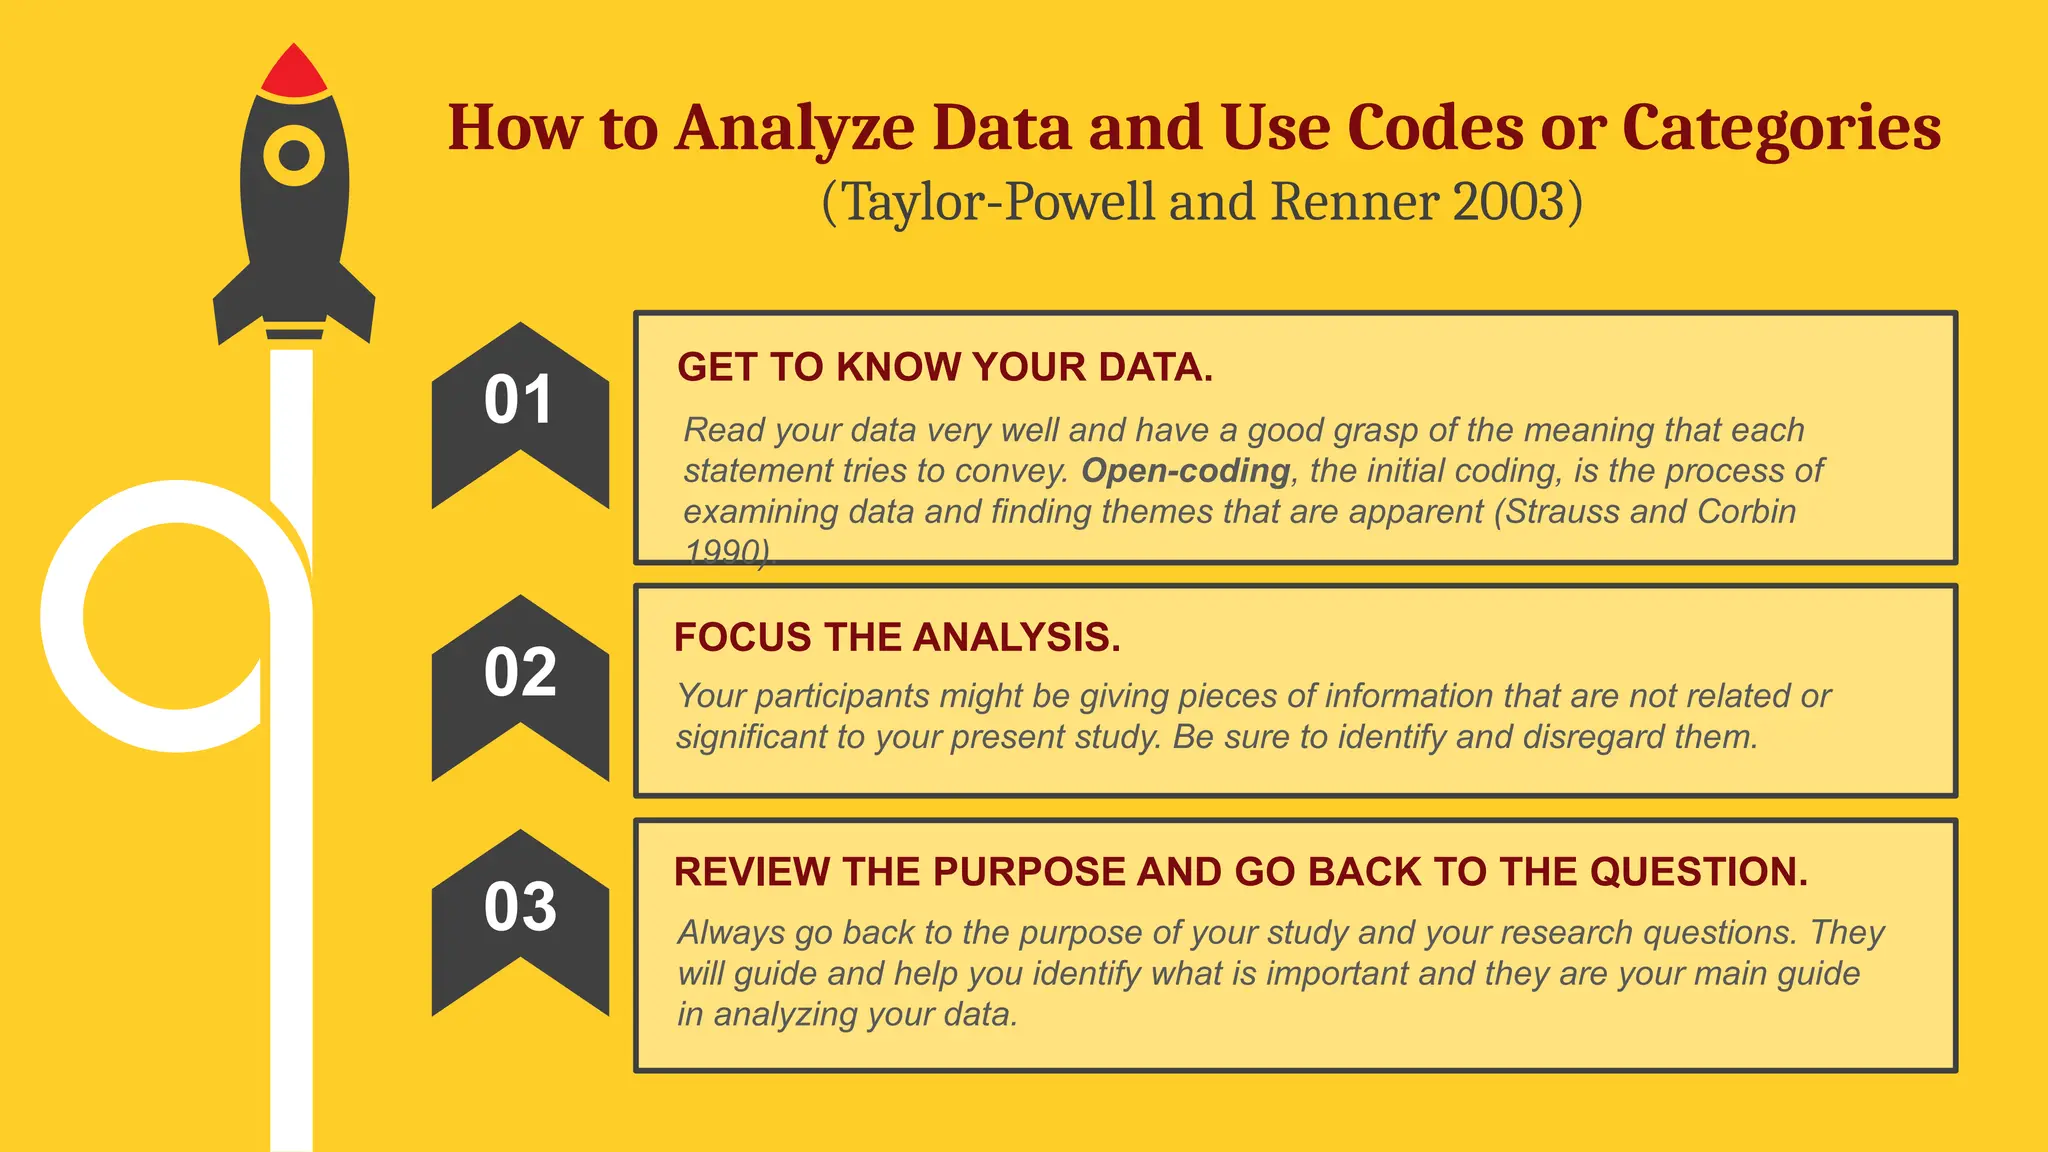
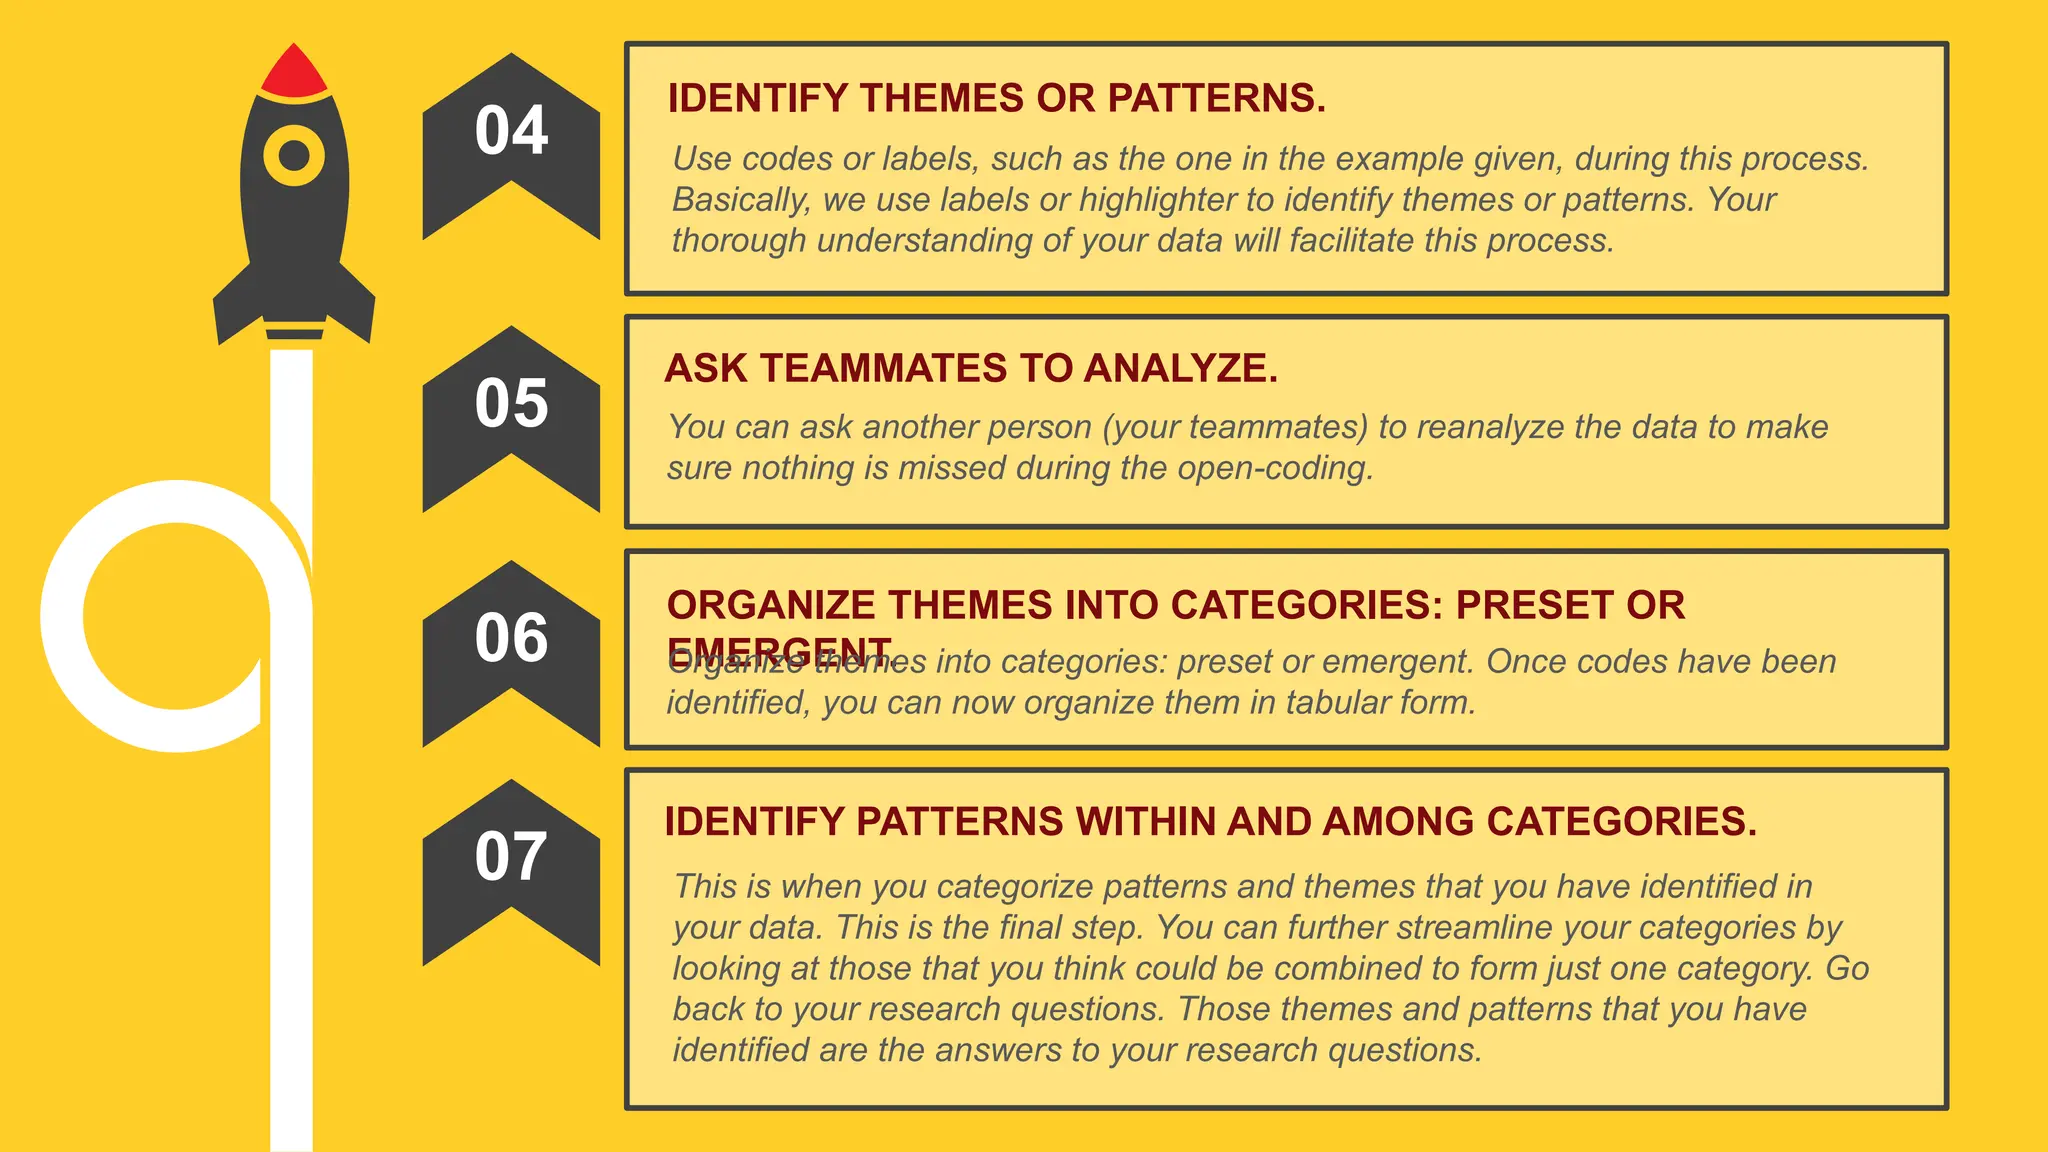
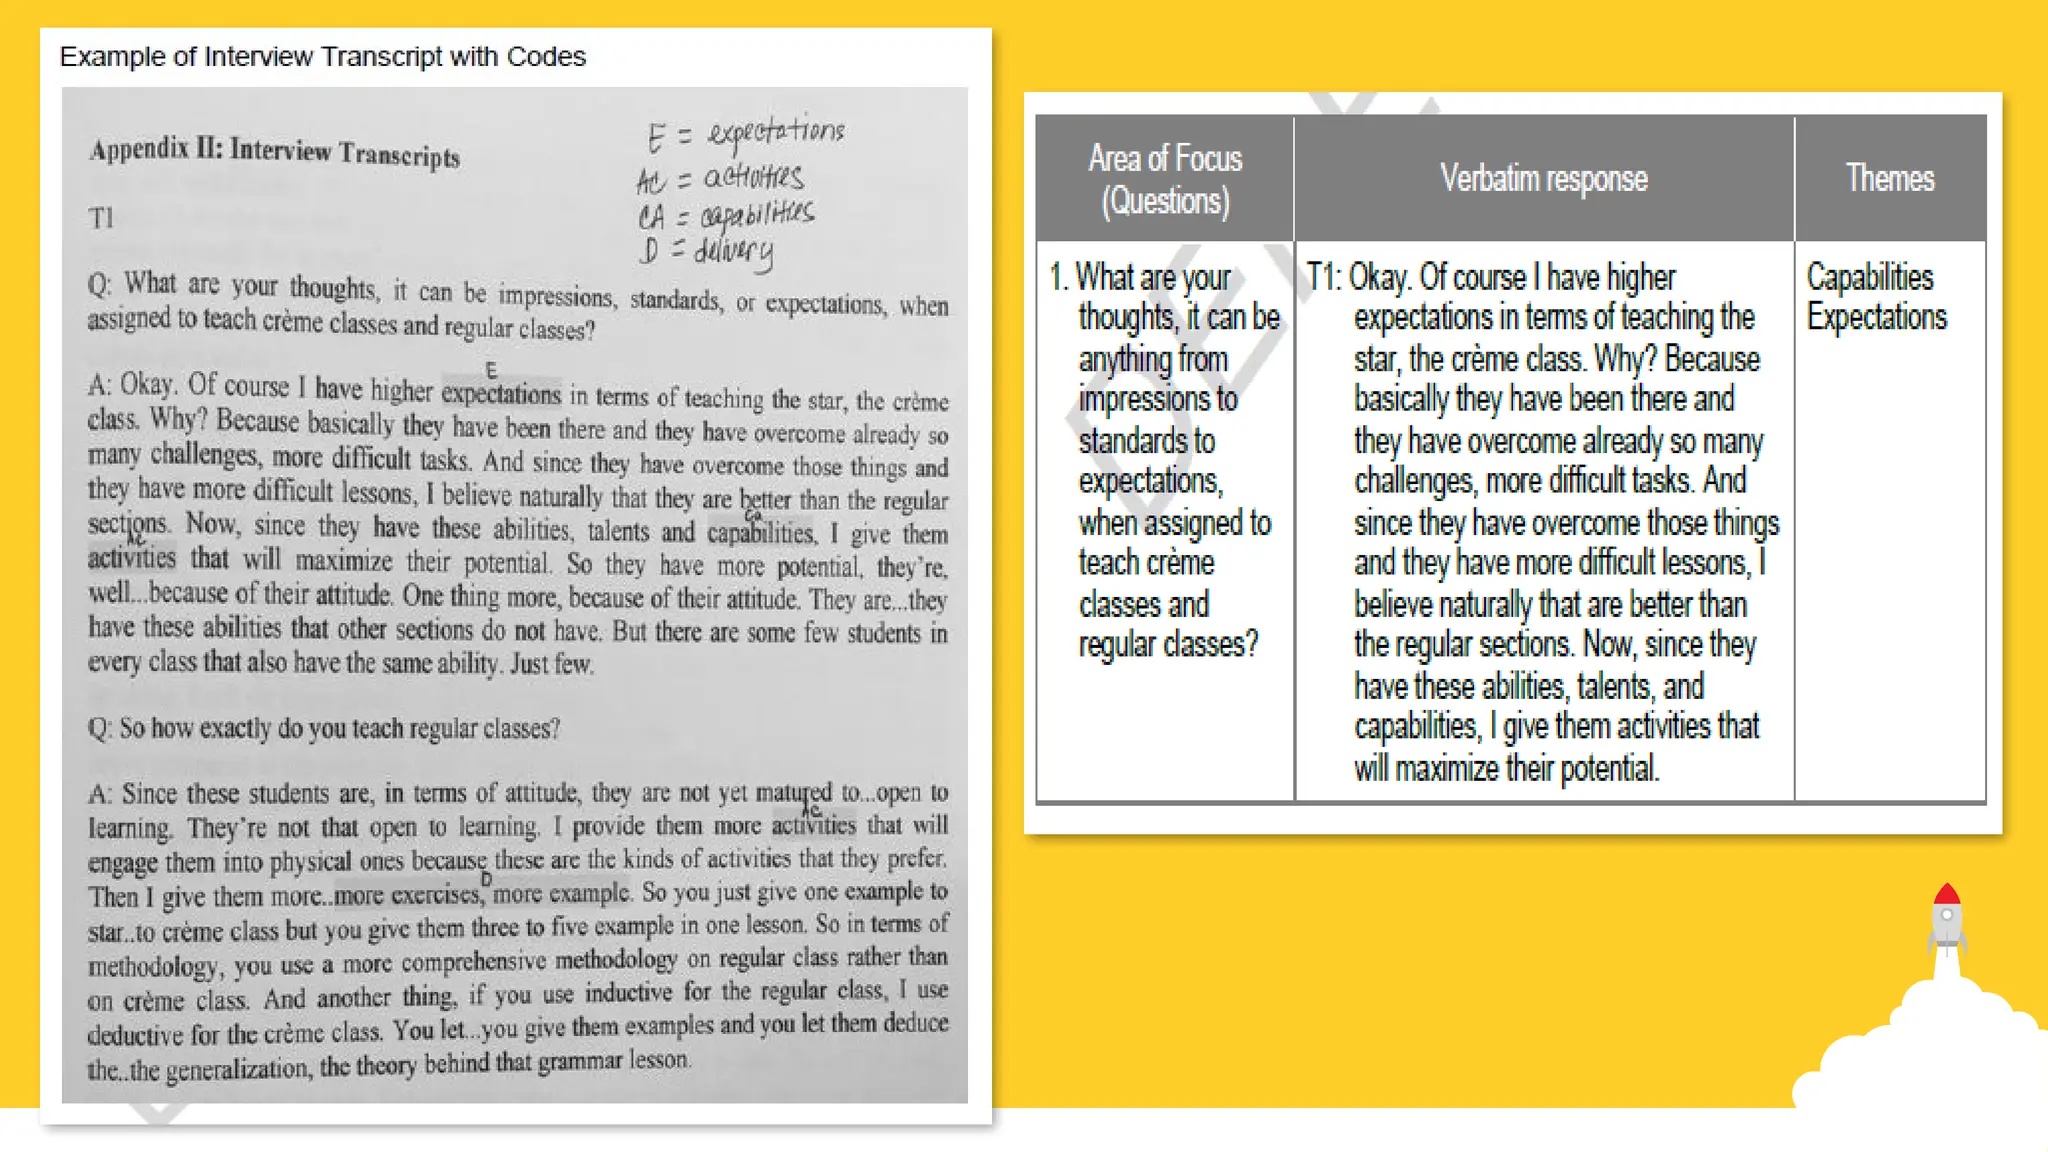
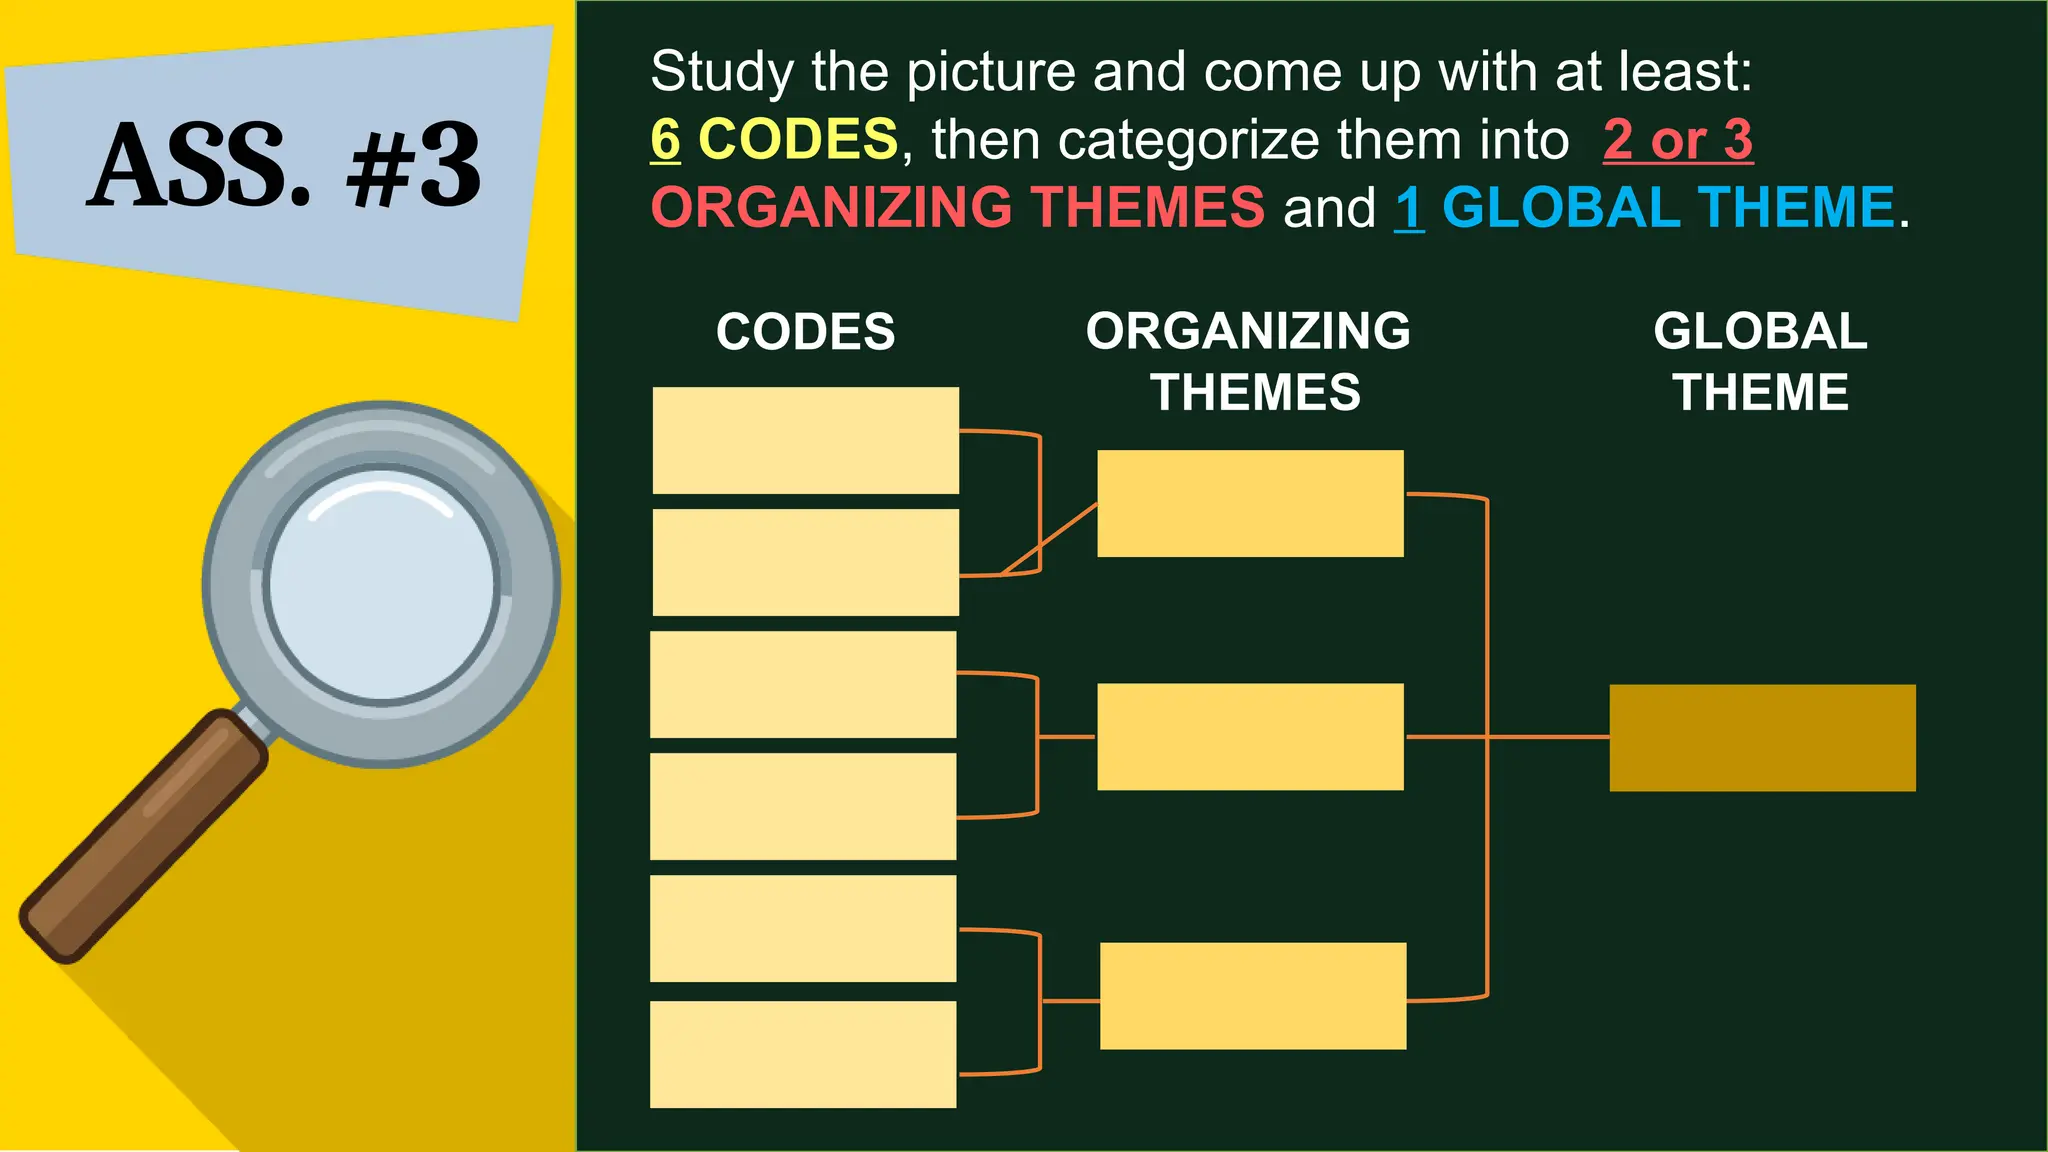
PRACTICAL RESEARCH I
Module 7:
ANALYZING
THE MEANING OF
DATA AND DRAWING
CONCLUSION
MOTIVATION
(Games!)
DATA
ANALYSIS
According to Yin
(1994:102) – data analysis
consists of examining, categorizing,
tabulating, or otherwise recombining
the evidence to address the initial
prepositions of a study.
DATA ANALYSIS APPROACH TO WHAT / HOW IT IS USED..
CONTENT ANALYSIS verbal data, or behavioral data
NARRATIVE ANALYSIS text that may come from variety of sources (transcripts from
interviews, diaries, field notes, surveys and other written forms)
DISCOURSE ANALYSIS naturally occurring spoken interactions and written text and is
concerned with the social context in which the communication
occurred
ANALYTIC INDUCTION attempts to develop causal explanations of a phenomenon from one
or more cases being studied
CONVERSATION ANALYSIS use of language by people as a type of action or skilled
accomplishment; a key concept in this analysis is the principle of
people taking turns in conversation
PATTERNS
AND THEMES
Drawing conclusions from what we personally see or
hear daily is very similar to drawing conclusions from
empirical patterns and themes from qualitative
data gathered through research methods such
as observation and interview.
However, there are distinct differences
between conclusions that we make everyday
and the conclusions done in research because
these are based solely on empirical data,
reasoning and factual evidence or
inference..
THEMES
and
PATTERNS
..words or phrases that
collectively describe the
experience or thoughts
of every participant.
..they appear on
several occasions
and are mentioned by
many participants.
..they represent broad
categories of information.
..identified by
using codes that
are grouped together
due to similar thoughts
and experiences.
CODING
Coding is the process of filtering, analyzing
the data and searching for essential
information that answers the research questions.
It involves taking text data or pictures gathered
during data collection, segmenting it into categories, and
labeling those categories with a term, often
used by the actual participant.
It is used to easily identify meanings and group
similar patterns or themes that occur or transpire in
the interview transcript of each participant.
Codes are words that represent themes or patterns.
TWO TYPES OF CODES IN QUALITATIVE RESEARCH:
A list of codes created in
advance by the researcher
based on the research
question, learning outcomes,
or conceptual framework.
PRE-SET
EMERGENT
Ideas, concepts, actions and
meanings that come up from
reading and analyzing the data
that are not in the pre-set codes.
As can be seen from the example, all participants‘ responses per question are
transcribed and arranged accordingly. Written before the responses are codes
represented by letters (V, R, F, A). These letters refer to Variety (V), Relevance
(R), Facilitators (F), and Attendance (A). As a researcher, it is your responsibility
to generate possible and relevant codes as dictated by the responses.
APPROACHES IN ANALYZING YOUR DATA
Begin by collecting data that is
relevant to the topic of interest.
Once a substantial amount of
data have been collected, look
for patterns in the data, working
to develop a theory that could
explain those patterns.
INDUCTIVE
APPROACH
DEDUCTIVE
APPROACH
Start with compelling social
theory and then test its
implications with data. This
typically associate with scientific
investigation: reads existing
studies/theories and then tests
hypotheses that emerge.
HOW TO
CODE
A code is a word or a short phrase that
descriptively captures the essence of elements of
your
material (e.g. a quotation) and is the first step
in your data reduction and interpretation.
For example:
In organizing a library, if you have several reading
materials: different types of books, journal, newspaper,
dictionary and other reading materials that are mixed
together, you will find ways to organize them into groups.
Perhaps you group books together and classify them according
to subjects? That is very similar to finding patterns and themes
and then organizing them into categories.
How to Analyze Data and Use Codes or Categories
(Taylor-Powell and Renner 2003)
GET TO KNOW YOUR DATA.
Read your data very well and have a good grasp of the meaning that each
statement tries to convey. Open-coding, the initial coding, is the process of
examining data and finding themes that are apparent (Strauss and Corbin
1990).
01
FOCUS THE ANALYSIS.
Your participants might be giving pieces of information that are not related or
significant to your present study. Be sure to identify and disregard them.
02
REVIEW THE PURPOSE AND GO BACK TO THE QUESTION.
Always go back to the purpose of your study and your research questions. They
will guide and help you identify what is important and they are your main guide
in analyzing your data.
03
IDENTIFY THEMES OR PATTERNS.
Use codes or labels, such as the one in the example given, during this process.
Basically, we use labels or highlighter to identify themes or patterns. Your
thorough understanding of your data will facilitate this process.
04
ASK TEAMMATES TO ANALYZE.
You can ask another person (your teammates) to reanalyze the data to make
sure nothing is missed during the open-coding.
05
ORGANIZE THEMES INTO CATEGORIES: PRESET OR
EMERGENT.
Organize themes into categories: preset or emergent. Once codes have been
identified, you can now organize them in tabular form.
06
IDENTIFY PATTERNS WITHIN AND AMONG CATEGORIES.
This is when you categorize patterns and themes that you have identified in
your data. This is the final step. You can further streamline your categories by
looking at those that you think could be combined to form just one category. Go
back to your research questions. Those themes and patterns that you have
identified are the answers to your research questions.
07
It is very important to
that developing
organizing themes
from codes will be an
important process in
analyzing a qualitative
data.
The process of cutting
out codes and moving
them around on is
often called the
“table method.”
The process of coding and categorizing is an essential
part after doing an interview, observation, and others.
Codes serve as a direction to label, compile and
organize a researcher‘s data. It can also allow a
researcher to summarize and synthesize what
is happening in his/her data.
The term “a priori codes” refers
to a ― “start list” of pre-set codes.
Jotting down notes of a researcher‘s
reactions and ideas that emerge is
essential. Ideas are important to the
analytic process.
CHAPTER IV:
Presentation of Findings
and Discussion
01 02 03
Commenting
on the results
obtained
This is the second to the last chapter of your research paper. This is the section where you
present the results you gathered through the data gathering techniques (instruments) that
you used. You present the results and discuss them by:
Interpreting
what the
results mean
Explaining any
results which
are unexpected
You present the findings from the interview and/or observation and then compare them to other
bodies of research. You do this by analyzing your data which we have previously discussed.
ASS. #3
Study the picture and come up with at least:
6 CODES, then categorize them into 2 or 3
ORGANIZING THEMES and 1 GLOBAL THEME.
ASS. #3
Study the picture and come up with at least:
6 CODES, then categorize them into 2 or 3
ORGANIZING THEMES and 1 GLOBAL THEME.
CODES ORGANIZING
THEMES
GLOBAL
THEME
END OF THE
PRESENTATION.

PR1 Lesson 7 - ANALYZING THE MEANING OF DATA AND DRAWING CONCLUSION.pptx

  • 1.
    PRACTICAL RESEARCH I Module7: ANALYZING THE MEANING OF DATA AND DRAWING CONCLUSION
  • 2.
  • 3.
  • 4.
    According to Yin (1994:102)– data analysis consists of examining, categorizing, tabulating, or otherwise recombining the evidence to address the initial prepositions of a study.
  • 5.
    DATA ANALYSIS APPROACHTO WHAT / HOW IT IS USED.. CONTENT ANALYSIS verbal data, or behavioral data NARRATIVE ANALYSIS text that may come from variety of sources (transcripts from interviews, diaries, field notes, surveys and other written forms) DISCOURSE ANALYSIS naturally occurring spoken interactions and written text and is concerned with the social context in which the communication occurred ANALYTIC INDUCTION attempts to develop causal explanations of a phenomenon from one or more cases being studied CONVERSATION ANALYSIS use of language by people as a type of action or skilled accomplishment; a key concept in this analysis is the principle of people taking turns in conversation
  • 6.
  • 7.
    Drawing conclusions fromwhat we personally see or hear daily is very similar to drawing conclusions from empirical patterns and themes from qualitative data gathered through research methods such as observation and interview. However, there are distinct differences between conclusions that we make everyday and the conclusions done in research because these are based solely on empirical data, reasoning and factual evidence or inference..
  • 8.
    THEMES and PATTERNS ..words or phrasesthat collectively describe the experience or thoughts of every participant. ..they appear on several occasions and are mentioned by many participants. ..they represent broad categories of information. ..identified by using codes that are grouped together due to similar thoughts and experiences.
  • 9.
  • 10.
    Coding is theprocess of filtering, analyzing the data and searching for essential information that answers the research questions. It involves taking text data or pictures gathered during data collection, segmenting it into categories, and labeling those categories with a term, often used by the actual participant. It is used to easily identify meanings and group similar patterns or themes that occur or transpire in the interview transcript of each participant. Codes are words that represent themes or patterns.
  • 11.
    TWO TYPES OFCODES IN QUALITATIVE RESEARCH: A list of codes created in advance by the researcher based on the research question, learning outcomes, or conceptual framework. PRE-SET EMERGENT Ideas, concepts, actions and meanings that come up from reading and analyzing the data that are not in the pre-set codes.
  • 14.
    As can beseen from the example, all participants‘ responses per question are transcribed and arranged accordingly. Written before the responses are codes represented by letters (V, R, F, A). These letters refer to Variety (V), Relevance (R), Facilitators (F), and Attendance (A). As a researcher, it is your responsibility to generate possible and relevant codes as dictated by the responses.
  • 15.
    APPROACHES IN ANALYZINGYOUR DATA Begin by collecting data that is relevant to the topic of interest. Once a substantial amount of data have been collected, look for patterns in the data, working to develop a theory that could explain those patterns. INDUCTIVE APPROACH DEDUCTIVE APPROACH Start with compelling social theory and then test its implications with data. This typically associate with scientific investigation: reads existing studies/theories and then tests hypotheses that emerge.
  • 16.
  • 17.
    A code isa word or a short phrase that descriptively captures the essence of elements of your material (e.g. a quotation) and is the first step in your data reduction and interpretation. For example: In organizing a library, if you have several reading materials: different types of books, journal, newspaper, dictionary and other reading materials that are mixed together, you will find ways to organize them into groups. Perhaps you group books together and classify them according to subjects? That is very similar to finding patterns and themes and then organizing them into categories.
  • 18.
    How to AnalyzeData and Use Codes or Categories (Taylor-Powell and Renner 2003) GET TO KNOW YOUR DATA. Read your data very well and have a good grasp of the meaning that each statement tries to convey. Open-coding, the initial coding, is the process of examining data and finding themes that are apparent (Strauss and Corbin 1990). 01 FOCUS THE ANALYSIS. Your participants might be giving pieces of information that are not related or significant to your present study. Be sure to identify and disregard them. 02 REVIEW THE PURPOSE AND GO BACK TO THE QUESTION. Always go back to the purpose of your study and your research questions. They will guide and help you identify what is important and they are your main guide in analyzing your data. 03
  • 19.
    IDENTIFY THEMES ORPATTERNS. Use codes or labels, such as the one in the example given, during this process. Basically, we use labels or highlighter to identify themes or patterns. Your thorough understanding of your data will facilitate this process. 04 ASK TEAMMATES TO ANALYZE. You can ask another person (your teammates) to reanalyze the data to make sure nothing is missed during the open-coding. 05 ORGANIZE THEMES INTO CATEGORIES: PRESET OR EMERGENT. Organize themes into categories: preset or emergent. Once codes have been identified, you can now organize them in tabular form. 06 IDENTIFY PATTERNS WITHIN AND AMONG CATEGORIES. This is when you categorize patterns and themes that you have identified in your data. This is the final step. You can further streamline your categories by looking at those that you think could be combined to form just one category. Go back to your research questions. Those themes and patterns that you have identified are the answers to your research questions. 07
  • 22.
    It is veryimportant to that developing organizing themes from codes will be an important process in analyzing a qualitative data. The process of cutting out codes and moving them around on is often called the “table method.”
  • 23.
    The process ofcoding and categorizing is an essential part after doing an interview, observation, and others. Codes serve as a direction to label, compile and organize a researcher‘s data. It can also allow a researcher to summarize and synthesize what is happening in his/her data. The term “a priori codes” refers to a ― “start list” of pre-set codes. Jotting down notes of a researcher‘s reactions and ideas that emerge is essential. Ideas are important to the analytic process.
  • 24.
    CHAPTER IV: Presentation ofFindings and Discussion
  • 25.
    01 02 03 Commenting onthe results obtained This is the second to the last chapter of your research paper. This is the section where you present the results you gathered through the data gathering techniques (instruments) that you used. You present the results and discuss them by: Interpreting what the results mean Explaining any results which are unexpected You present the findings from the interview and/or observation and then compare them to other bodies of research. You do this by analyzing your data which we have previously discussed.
  • 27.
    ASS. #3 Study thepicture and come up with at least: 6 CODES, then categorize them into 2 or 3 ORGANIZING THEMES and 1 GLOBAL THEME.
  • 28.
    ASS. #3 Study thepicture and come up with at least: 6 CODES, then categorize them into 2 or 3 ORGANIZING THEMES and 1 GLOBAL THEME. CODES ORGANIZING THEMES GLOBAL THEME
  • 29.