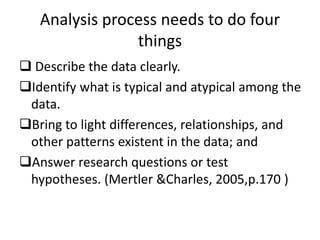
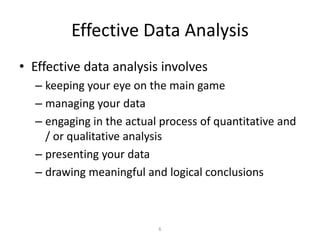
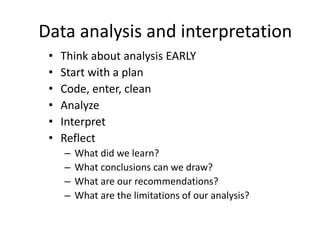
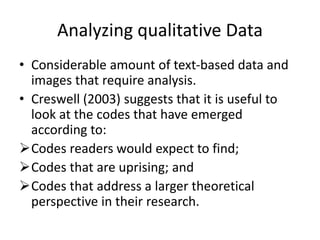
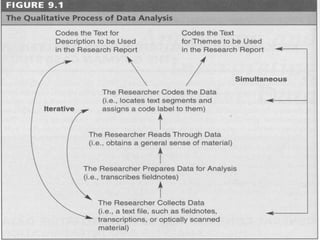
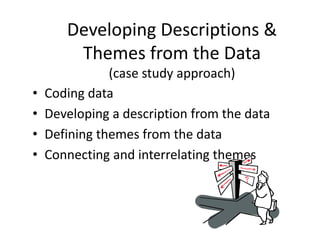
SlideShare a Scribd company logo
1 of 56
Analysing Data
• Introduction
• Analysing
qualitative data
• Analysing
quantitative data
• Activities
• Conclusion
Presentation Outline
Introduction
• In the previous lectures we explored a number
of different ways we can organize the data we
have collected in order to support the analysis
process.
• In this lecture we will look at how we can
analyze data, identifying particular techniques
and processes in both qualitative and
quantitative designs.
What is data analysis?
• A complex process that involves moving
back and forth
– between concrete bits of data and abstract
concepts
– between inductive and deductive reasoning
– between description and interpretation
• Simply put: Data analysis is the process of
making meaning from the data
Analysis process needs to do four
things
 Describe the data clearly.
Identify what is typical and atypical among the
data.
Bring to light differences, relationships, and
other patterns existent in the data; and
Answer research questions or test
hypotheses. (Mertler &Charles, 2005,p.170 )
6
Effective Data Analysis
• Effective data analysis involves
– keeping your eye on the main game
– managing your data
– engaging in the actual process of quantitative and
/ or qualitative analysis
– presenting your data
– drawing meaningful and logical conclusions
Data analysis and interpretation
• Think about analysis EARLY
• Start with a plan
• Code, enter, clean
• Analyze
• Interpret
• Reflect
– What did we learn?
– What conclusions can we draw?
– What are our recommendations?
– What are the limitations of our analysis?
Analyzing qualitative Data
• Considerable amount of text-based data and
images that require analysis.
• Creswell (2003) suggests that it is useful to
look at the codes that have emerged
according to:
Codes readers would expect to find;
Codes that are uprising; and
Codes that address a larger theoretical
perspective in their research.
Why do I need an analysis plan?
• To make sure the questions and your
data collection instrument will get the
information you want.
• To align your desired “report” with the
results of analysis and interpretation.
• To improve reliability--consistent
measures over time.
Preliminary Exploratory Analysis
• Explore the data by reading through all of
your information to obtain a general sense
of the information
• Memo ideas while thinking about the
organization of the data and considering
whether more data are needed
– Jot memos in margins of fieldnotes, transcripts,
documents, photos
EDUC 7741/Paris/Terry
Developing Descriptions &
Themes from the Data
(case study approach)
• Coding data
• Developing a description from the data
• Defining themes from the data
• Connecting and interrelating themes
Codes
• Exploration of the different types of codes
assist researchers in ensuring their analysis is
balanced
• Share your codes with your colleagues this is a
useful way building depth into analysis and
ensuring accuracy in interpretation of data
Coding Data
• Open Coding
– Assign a code word or phrase that accurately
describes the meaning of the text segment
– Line-by-line coding is done first in theoretical
research
– More general coding involving larger segments
of text is adequate for practical research
(action research)
EDUC 7741/Paris/Terry
Axial Coding
• The process of looking for categories that cut
across all data sets
• After this type of coding, you have identified
your themes
• You can’t classify something as a theme unless
it cuts across the majority of the data
Clustering
• After open coding an entire text, make a list
of all code words
• Cluster together similar codes and look for
redundant codes
• Objective: reduce the long list of codes to a
smaller, more manageable number (25 or
30)
EDUC 7741/Paris/Terry
Preliminary organizing scheme
• Take this new list of codes and go back to the
data
• Reduce this list to codes to get 5 to 7 themes or
descriptions
• Themes are similar codes aggregated together to
form a major idea in the database
• Identify the 5-7 themes by constantly comparing
the data (Constant Comparative Analysis)
Constant Comparative Analysis
(Glaser & Strauss; p. 86, The Art of Classroom Inquiry)
• A process whereby the data gradually
evolve into a core of emerging theory
• This core is a theoretical framework that
further guides the collection of data
• Major modifications are lessened as
comparisons of the next incidents of a
category to its properties are carried out
(Merriam, 1998).
Why themes?
• It is best to write a qualitative report providing
detailed information about a few themes
rather than general information about many
themes
• Themes can also be referred to as Categories
Naming the Themes or Categories
• The names can come from at least three
sources:
– The researcher
– The participants
– The literature
• Most common: when the researcher
comes up with terms, concepts, and
categories that reflect what he or she sees
in the data
Themes should…
• Reflect the purpose of the research
• Be exhaustive--you must place all data in a
category
• Be sensitizing--should be sensitive to what
is in the data
– i.e., “leadership” vs. “charismatic leadership”
• Be conceptually congruent--the same level
of abstraction should characterize all
categories at the same level
Types of themes
• Ordinary: themes a researcher expects
• Unexpected: themes that are surprises and not expected
to surface
• Hard-to-classify: themes that contain ideas that do not
easily fit into one theme or that overlap with several
themes
• Major & minor themes: themes that represent the major
ideas, or minor, secondary ideas in a database
– Minor themes fit under major themes in the write up
A Description
• A detailed rendering of people, places, or
events in a setting in qualitative research
• Codes such as “seating arrangements,”
“teaching approach,” or “physical layout of the
room,” might all be used to describe a
classroom where instruction takes place
Narrative description
• From the coding and the themes, construct a
narrative description and possibly a visual
display of the findings for your research report
• Use the assigned format
Constructing the narrative
• Identify dialogue that provides support for themes
• Look for dialogue in the participants’ own dialect
• Use metaphors and analogies
• Collect quotes from interview data or observations
• Locate multiple perspectives & contrary evidence
• Look for vibrant detail
• Identify tensions and contradictions in individual
experiences
Conveying personal reflections
Because qualitative researchers believe that personal
views can never be kept separate from interpretations,
personal reflections about the meaning of the data are
included in the research study
– “David had been diagnosed with AD/HD and also with mild
Tourette Syndrome. He took medication for AD/HD. He was
selected to participate in the project as a confirming participant
because he was so involved with the project and so intense
during the first observation. Unaware that he had AD/HD and
Tourette Syndrome until I interviewed his mother during the
second year of the project, I was surprised because he was the
most focused student in the classroom.”(Terry, 2003)
Providing Visual Data Displays
• Qualitative researchers often display their
findings visually
– Comparison table or matrix
– Hierarchical tree diagram that represents
themes and their connections
– Boxes that show connections between themes
– Physical layout of the setting
– Personal or demographic information for each
person or site
Enhances Commitment,
Attitudes,
and Student Development
Making comparisons with the
Literature
• Interpret the data in view of past research
• Show how the findings both support and contradict
prior studies
– “These findings are consistent with other studies in
regard to duration. It has been found that the length or
duration of service learning projects has an impact on
student outcomes, with the longer duration projects
having greater impacts. However, significant differences
are not found in projects lasting over 18 weeks (Conrad
& Hedin, 1981). The project on which this study focused
was examined over a year and a half period of time; thus
it is considered to be long in duration which helps to
explain its impact on student outcomes.”
Synthesis of the data
• Once researchers have a sense of what data
mean and have identified categories and
themes , it is time to start offering some
hypothesis or propositions from the study.
• This may describe the relationships among the
categories that have been identified.
• They may also show how the data fit with the
proposed research problem at the beginning
of the study
• As researchers move through this process,
they may discover that their initial guiding
questions do not relate to what it is that the
data reveal.
• This is normal and quite acceptable in
qualitative research designs.
• It is important that research questions in
qualitative studies evolve and change as
directed by the data
• Revisit some of the techniques, look for
correlation, how well is your problem,
research question and methods are
correlated.
• For example, using diagram, a table, or a flow
chart may help researcher communicate the
findings they have come up through analysis
• The ultimate goal of synthesizing the analysis of
data is to ensure that interpretation are clearly
communicated to the readers of the research
• It is therefore necessary that there is a clear
connection between the data, the categories that
emerge from the coding process and the
interpretations offered.
• It must be clear to the reader how the
researchers drew their conclusions in relation to
the identified study and the collected data
Analysing quantitative data
• Researchers' who have completed
quantitative data gathering techniques will
typically have considerable numerical data
that require analysis .
• As data are gathered, they are typically
disorganised and made up of separate bits of
information.
• When numbers look this way , the meaning is
not clear
• Statistical analysis of these numbers is a way
to focus and manage data.
• Mertler and Charles (2005) identify a number
of different purposes for using statistics.
Specifically, statistics can:
Summarise data and reveal what is typical and
atypical within a group;
Identify the relative standing of individuals
within an identified cohort;
• Show relationship between and among
variables;
• Show similarities and differences among
groups;
• Identify error that is inherent in a sample
selection;
• Test for significance of findings; and
• Support the researchers in making other
inferences about population
• Statistics help to condense a vast body of data
into an amount of information that the mind
can more easily understand.
• Statistics identifies patterns and relationships
within the data that they may otherwise go
unnoticed.
Generating statistics
• For many, the thought of generating statistics
can be quite scary
• The process of engaging with formulas and
completing complex calculation can be
daunting.
• However modern technology, the software
program such as SPSS ( Statistical Package for
the Social Sciences)
Measurement scales
• Any form of measurement fall into one of the
following four categories(referred to scales
within the literature
Measurement
scale
Characteristics Statistical possibilities
Nominal scale Data are measured by assigning a
name to identify specific
categories. For example, when
looking at data collected within a
classroom we could distinguish
between boys and girls within this
group
•Frequency distribution
(mode)
•Proportions ( percentage
values)
•Chi square
Ordinal Scale Data are measured according to
rank. Data are compared and
contrasted to determine those
that are greater than(>) compared
to less than (<) within the data
set.
This scale can be used to rank
students within a class according
to their positions when compared
with peers.
As for ordinal scale plus
• Median
•Percentile rank
•Spearman rank order
•Correlation
•Mann- Whitney test
Ratio Scale
Interval Scale Two key features are incorporated within this
approach
1. The data are measured by equal units of
measurement;
2. A zero point is established.
Temperature is measured
on an interval scale
As for ordinal scale
plus:
Mean
Standard deviation
Pearson Product-
moment
Correlation
Inferential
procedures (e.g., t-
test, ANOVA)
Ratio Scale Two key features are incorporated within this
approach
1. The data are measured by equal units (as
in interval scale)
2. An absolute zero point is established
3. In the temperature example for interval
scale, the material from which the
temperature is obtained may have a
different starting point (i.e. May be
warmer or cooler than other materials
measured.
As for ratio scale
plus:
 Geometric mean
Percentage
variance
Inferential
procedures
How the above collected data can fit
within each of these scales
• One object is different from another, you have a
nominal scale
• One object is bigger or better or more of anything
than another, you have an ordinal scale.
• One object is so many units (degrees, inches)
more than another you have an interval scale;
• One object is so many times big or bright or
bright or tall or heavy as another you have a ratio
scale
Descriptive statistics
• Calculated in order to report on and describe
what happened during the period of research.
• There are three basic categories of descriptive
statistics, all of which are frequently used by
teacher- researchers. These categories are:
Measures of central tendency.
Measures of dispersion
Measures of relationship
Measures of central tendency
• Statistical procedures that indicate, with a
single score, what is typical or standard about
a group of individuals. These indices are
commonly used when trying to describe the
collective level of performance, attitude, or
opinion of a group of study participants. There
are three measures of central tendency: the
mean, the median, and the mode.
Measures of dispersion
• Indicates what is different within a group of
scores,
• It also indicates how much spread or diversity
exist within a group of scores.
• The two primary measures of dispersion
Range (H-L)
Standard deviation is formally designed as the
average distance to scores away from the
mean
Measures of relationship
• The third type of descriptive statistics
measures relationship between variables.
There are numerous types of correlation
coefficients, the name given to these various
measures the direction and degree of relation
ship between two variables. It is calculated
when analysing data from studies using
correlation design.
Activity
• Look at the research paper. As you read the paper
identify.
a. The research question and hypothesis
b. How the participants were selected.
c. The instrument used for measurement
d. How the statistics were generated
e. How the data and statistics have been analysed
and
f. The relationship between the statistics ,
conclusions and research.
Workshop
• Discussion about Presentation
• Rubrics
Conclusion
53
The Big Picture
• Analysis should be approached as a critical,
reflective, and iterative process that cycles
between data and an overarching research
framework that keeps the big picture in mind
54
Managing Data
• Regardless of data type, managing your data involves
– familiarizing yourself with appropriate software
– developing a data management system
– systematically organizing and screening your data
– entering the data into a program
– and finally ‘cleaning’ your data
55
Drawing Conclusions
• Your findings and conclusions need to flow
from analysis and show clear relevance to
your overall project
• Findings should be considered in light of
– significance
– current research literature
– limitations of the study
– your questions, aims, objectives, and theory
56
Looking ahead
Ethics and Communicating research

More Related Content

Similar to Analysing_quantitative_data.ppt

Making Sense of It All: Analyzing Qualitative Data
Making Sense of It All: Analyzing Qualitative DataMaking Sense of It All: Analyzing Qualitative Data
Making Sense of It All: Analyzing Qualitative DataGeorge Hayhoe
 
Project Planning I- Introudction, Title (Concept)_Prof. R. K. Dixit.pptx
Project Planning I- Introudction, Title (Concept)_Prof. R. K. Dixit.pptxProject Planning I- Introudction, Title (Concept)_Prof. R. K. Dixit.pptx
Project Planning I- Introudction, Title (Concept)_Prof. R. K. Dixit.pptxProf Rakesh Dixit
 
362248809-Grounded-theory-ppt.ppt
362248809-Grounded-theory-ppt.ppt362248809-Grounded-theory-ppt.ppt
362248809-Grounded-theory-ppt.pptARVIDREELOMERA
 
Advanced Research Methodology Session-4.pptx
Advanced Research Methodology Session-4.pptxAdvanced Research Methodology Session-4.pptx
Advanced Research Methodology Session-4.pptxHarariMki1
 
Week 10 writing research proposal
Week 10  writing research proposalWeek 10  writing research proposal
Week 10 writing research proposalwawaaa789
 
Simple guidelines to do a postgraduate research project slide share
Simple guidelines to do a postgraduate research project  slide shareSimple guidelines to do a postgraduate research project  slide share
Simple guidelines to do a postgraduate research project slide shareManori Gamage
 
Research proposal: How to Write a Research Proposal
Research proposal: How to Write a Research ProposalResearch proposal: How to Write a Research Proposal
Research proposal: How to Write a Research ProposalM. A. Shahzad
 
chapter 1 Course Overview.pptx
chapter 1 Course Overview.pptxchapter 1 Course Overview.pptx
chapter 1 Course Overview.pptxYoniYoni7
 
Chapter Session 4.4 Grounded theory.ppt
Chapter Session 4.4 Grounded theory.pptChapter Session 4.4 Grounded theory.ppt
Chapter Session 4.4 Grounded theory.pptetebarkhmichale
 
Ma dissertation workshop
Ma dissertation workshopMa dissertation workshop
Ma dissertation workshopCarolina Matos
 
Research Methodology.pptx
Research Methodology.pptxResearch Methodology.pptx
Research Methodology.pptxUdayaShankarS1
 
Data analysis – qualitative data presentation 2
Data analysis – qualitative data   presentation 2Data analysis – qualitative data   presentation 2
Data analysis – qualitative data presentation 2Azura Zaki
 
Week 9 Qualitative Data Analysis 2022.pptx
Week 9 Qualitative Data Analysis 2022.pptxWeek 9 Qualitative Data Analysis 2022.pptx
Week 9 Qualitative Data Analysis 2022.pptxMulaedzaTshivhase
 
unit 2 overview of research processL.ppt
unit 2 overview of research processL.pptunit 2 overview of research processL.ppt
unit 2 overview of research processL.pptMitikuTeka1
 
BRM_UNIT_1_PPT.pptx
BRM_UNIT_1_PPT.pptxBRM_UNIT_1_PPT.pptx
BRM_UNIT_1_PPT.pptxSujeetTambe3
 

Similar to Analysing_quantitative_data.ppt (20)

Qualitative
QualitativeQualitative
Qualitative
 
Grounded theory new
Grounded theory newGrounded theory new
Grounded theory new
 
Writing A Sound Proposal
Writing A Sound ProposalWriting A Sound Proposal
Writing A Sound Proposal
 
Making Sense of It All: Analyzing Qualitative Data
Making Sense of It All: Analyzing Qualitative DataMaking Sense of It All: Analyzing Qualitative Data
Making Sense of It All: Analyzing Qualitative Data
 
Project Planning I- Introudction, Title (Concept)_Prof. R. K. Dixit.pptx
Project Planning I- Introudction, Title (Concept)_Prof. R. K. Dixit.pptxProject Planning I- Introudction, Title (Concept)_Prof. R. K. Dixit.pptx
Project Planning I- Introudction, Title (Concept)_Prof. R. K. Dixit.pptx
 
362248809-Grounded-theory-ppt.ppt
362248809-Grounded-theory-ppt.ppt362248809-Grounded-theory-ppt.ppt
362248809-Grounded-theory-ppt.ppt
 
Advanced Research Methodology Session-4.pptx
Advanced Research Methodology Session-4.pptxAdvanced Research Methodology Session-4.pptx
Advanced Research Methodology Session-4.pptx
 
Week 10 writing research proposal
Week 10  writing research proposalWeek 10  writing research proposal
Week 10 writing research proposal
 
Simple guidelines to do a postgraduate research project slide share
Simple guidelines to do a postgraduate research project  slide shareSimple guidelines to do a postgraduate research project  slide share
Simple guidelines to do a postgraduate research project slide share
 
Research Methodology
Research Methodology  Research Methodology
Research Methodology
 
Research proposal: How to Write a Research Proposal
Research proposal: How to Write a Research ProposalResearch proposal: How to Write a Research Proposal
Research proposal: How to Write a Research Proposal
 
chapter 1 Course Overview.pptx
chapter 1 Course Overview.pptxchapter 1 Course Overview.pptx
chapter 1 Course Overview.pptx
 
Chapter Session 4.4 Grounded theory.ppt
Chapter Session 4.4 Grounded theory.pptChapter Session 4.4 Grounded theory.ppt
Chapter Session 4.4 Grounded theory.ppt
 
Ma dissertation workshop
Ma dissertation workshopMa dissertation workshop
Ma dissertation workshop
 
Research proposal
Research proposal Research proposal
Research proposal
 
Research Methodology.pptx
Research Methodology.pptxResearch Methodology.pptx
Research Methodology.pptx
 
Data analysis – qualitative data presentation 2
Data analysis – qualitative data   presentation 2Data analysis – qualitative data   presentation 2
Data analysis – qualitative data presentation 2
 
Week 9 Qualitative Data Analysis 2022.pptx
Week 9 Qualitative Data Analysis 2022.pptxWeek 9 Qualitative Data Analysis 2022.pptx
Week 9 Qualitative Data Analysis 2022.pptx
 
unit 2 overview of research processL.ppt
unit 2 overview of research processL.pptunit 2 overview of research processL.ppt
unit 2 overview of research processL.ppt
 
BRM_UNIT_1_PPT.pptx
BRM_UNIT_1_PPT.pptxBRM_UNIT_1_PPT.pptx
BRM_UNIT_1_PPT.pptx
 

Recently uploaded

Solving Puzzles Benefits Everyone (English).pptx
Solving Puzzles Benefits Everyone (English).pptxSolving Puzzles Benefits Everyone (English).pptx
Solving Puzzles Benefits Everyone (English).pptxOH TEIK BIN
 
ECONOMIC CONTEXT - PAPER 1 Q3: NEWSPAPERS.pptx
ECONOMIC CONTEXT - PAPER 1 Q3: NEWSPAPERS.pptxECONOMIC CONTEXT - PAPER 1 Q3: NEWSPAPERS.pptx
ECONOMIC CONTEXT - PAPER 1 Q3: NEWSPAPERS.pptxiammrhaywood
 
How to Configure Email Server in Odoo 17
How to Configure Email Server in Odoo 17How to Configure Email Server in Odoo 17
How to Configure Email Server in Odoo 17Celine George
 
Computed Fields and api Depends in the Odoo 17
Computed Fields and api Depends in the Odoo 17Computed Fields and api Depends in the Odoo 17
Computed Fields and api Depends in the Odoo 17Celine George
 
How to do quick user assign in kanban in Odoo 17 ERP
How to do quick user assign in kanban in Odoo 17 ERPHow to do quick user assign in kanban in Odoo 17 ERP
How to do quick user assign in kanban in Odoo 17 ERPCeline George
 
ACC 2024 Chronicles. Cardiology. Exam.pdf
ACC 2024 Chronicles. Cardiology. Exam.pdfACC 2024 Chronicles. Cardiology. Exam.pdf
ACC 2024 Chronicles. Cardiology. Exam.pdfSpandanaRallapalli
 
Introduction to AI in Higher Education_draft.pptx
Introduction to AI in Higher Education_draft.pptxIntroduction to AI in Higher Education_draft.pptx
Introduction to AI in Higher Education_draft.pptxpboyjonauth
 
Framing an Appropriate Research Question 6b9b26d93da94caf993c038d9efcdedb.pdf
Framing an Appropriate Research Question 6b9b26d93da94caf993c038d9efcdedb.pdfFraming an Appropriate Research Question 6b9b26d93da94caf993c038d9efcdedb.pdf
Framing an Appropriate Research Question 6b9b26d93da94caf993c038d9efcdedb.pdfUjwalaBharambe
 
Earth Day Presentation wow hello nice great
Earth Day Presentation wow hello nice greatEarth Day Presentation wow hello nice great
Earth Day Presentation wow hello nice greatYousafMalik24
 
Keynote by Prof. Wurzer at Nordex about IP-design
Keynote by Prof. Wurzer at Nordex about IP-designKeynote by Prof. Wurzer at Nordex about IP-design
Keynote by Prof. Wurzer at Nordex about IP-designMIPLM
 
Quarter 4 Peace-education.pptx Catch Up Friday
Quarter 4 Peace-education.pptx Catch Up FridayQuarter 4 Peace-education.pptx Catch Up Friday
Quarter 4 Peace-education.pptx Catch Up FridayMakMakNepo
 
Planning a health career 4th Quarter.pptx
Planning a health career 4th Quarter.pptxPlanning a health career 4th Quarter.pptx
Planning a health career 4th Quarter.pptxLigayaBacuel1
 
Difference Between Search & Browse Methods in Odoo 17
Difference Between Search & Browse Methods in Odoo 17Difference Between Search & Browse Methods in Odoo 17
Difference Between Search & Browse Methods in Odoo 17Celine George
 
Procuring digital preservation CAN be quick and painless with our new dynamic...
Procuring digital preservation CAN be quick and painless with our new dynamic...Procuring digital preservation CAN be quick and painless with our new dynamic...
Procuring digital preservation CAN be quick and painless with our new dynamic...Jisc
 
Atmosphere science 7 quarter 4 .........
Atmosphere science 7 quarter 4 .........Atmosphere science 7 quarter 4 .........
Atmosphere science 7 quarter 4 .........LeaCamillePacle
 
Field Attribute Index Feature in Odoo 17
Field Attribute Index Feature in Odoo 17Field Attribute Index Feature in Odoo 17
Field Attribute Index Feature in Odoo 17Celine George
 
Crayon Activity Handout For the Crayon A
Crayon Activity Handout For the Crayon ACrayon Activity Handout For the Crayon A
Crayon Activity Handout For the Crayon AUnboundStockton
 
Proudly South Africa powerpoint Thorisha.pptx
Proudly South Africa powerpoint Thorisha.pptxProudly South Africa powerpoint Thorisha.pptx
Proudly South Africa powerpoint Thorisha.pptxthorishapillay1
 

Recently uploaded (20)

Solving Puzzles Benefits Everyone (English).pptx
Solving Puzzles Benefits Everyone (English).pptxSolving Puzzles Benefits Everyone (English).pptx
Solving Puzzles Benefits Everyone (English).pptx
 
ECONOMIC CONTEXT - PAPER 1 Q3: NEWSPAPERS.pptx
ECONOMIC CONTEXT - PAPER 1 Q3: NEWSPAPERS.pptxECONOMIC CONTEXT - PAPER 1 Q3: NEWSPAPERS.pptx
ECONOMIC CONTEXT - PAPER 1 Q3: NEWSPAPERS.pptx
 
How to Configure Email Server in Odoo 17
How to Configure Email Server in Odoo 17How to Configure Email Server in Odoo 17
How to Configure Email Server in Odoo 17
 
Computed Fields and api Depends in the Odoo 17
Computed Fields and api Depends in the Odoo 17Computed Fields and api Depends in the Odoo 17
Computed Fields and api Depends in the Odoo 17
 
How to do quick user assign in kanban in Odoo 17 ERP
How to do quick user assign in kanban in Odoo 17 ERPHow to do quick user assign in kanban in Odoo 17 ERP
How to do quick user assign in kanban in Odoo 17 ERP
 
ACC 2024 Chronicles. Cardiology. Exam.pdf
ACC 2024 Chronicles. Cardiology. Exam.pdfACC 2024 Chronicles. Cardiology. Exam.pdf
ACC 2024 Chronicles. Cardiology. Exam.pdf
 
Introduction to AI in Higher Education_draft.pptx
Introduction to AI in Higher Education_draft.pptxIntroduction to AI in Higher Education_draft.pptx
Introduction to AI in Higher Education_draft.pptx
 
Framing an Appropriate Research Question 6b9b26d93da94caf993c038d9efcdedb.pdf
Framing an Appropriate Research Question 6b9b26d93da94caf993c038d9efcdedb.pdfFraming an Appropriate Research Question 6b9b26d93da94caf993c038d9efcdedb.pdf
Framing an Appropriate Research Question 6b9b26d93da94caf993c038d9efcdedb.pdf
 
Earth Day Presentation wow hello nice great
Earth Day Presentation wow hello nice greatEarth Day Presentation wow hello nice great
Earth Day Presentation wow hello nice great
 
Keynote by Prof. Wurzer at Nordex about IP-design
Keynote by Prof. Wurzer at Nordex about IP-designKeynote by Prof. Wurzer at Nordex about IP-design
Keynote by Prof. Wurzer at Nordex about IP-design
 
Quarter 4 Peace-education.pptx Catch Up Friday
Quarter 4 Peace-education.pptx Catch Up FridayQuarter 4 Peace-education.pptx Catch Up Friday
Quarter 4 Peace-education.pptx Catch Up Friday
 
Planning a health career 4th Quarter.pptx
Planning a health career 4th Quarter.pptxPlanning a health career 4th Quarter.pptx
Planning a health career 4th Quarter.pptx
 
Difference Between Search & Browse Methods in Odoo 17
Difference Between Search & Browse Methods in Odoo 17Difference Between Search & Browse Methods in Odoo 17
Difference Between Search & Browse Methods in Odoo 17
 
Procuring digital preservation CAN be quick and painless with our new dynamic...
Procuring digital preservation CAN be quick and painless with our new dynamic...Procuring digital preservation CAN be quick and painless with our new dynamic...
Procuring digital preservation CAN be quick and painless with our new dynamic...
 
Atmosphere science 7 quarter 4 .........
Atmosphere science 7 quarter 4 .........Atmosphere science 7 quarter 4 .........
Atmosphere science 7 quarter 4 .........
 
TataKelola dan KamSiber Kecerdasan Buatan v022.pdf
TataKelola dan KamSiber Kecerdasan Buatan v022.pdfTataKelola dan KamSiber Kecerdasan Buatan v022.pdf
TataKelola dan KamSiber Kecerdasan Buatan v022.pdf
 
Raw materials used in Herbal Cosmetics.pptx
Raw materials used in Herbal Cosmetics.pptxRaw materials used in Herbal Cosmetics.pptx
Raw materials used in Herbal Cosmetics.pptx
 
Field Attribute Index Feature in Odoo 17
Field Attribute Index Feature in Odoo 17Field Attribute Index Feature in Odoo 17
Field Attribute Index Feature in Odoo 17
 
Crayon Activity Handout For the Crayon A
Crayon Activity Handout For the Crayon ACrayon Activity Handout For the Crayon A
Crayon Activity Handout For the Crayon A
 
Proudly South Africa powerpoint Thorisha.pptx
Proudly South Africa powerpoint Thorisha.pptxProudly South Africa powerpoint Thorisha.pptx
Proudly South Africa powerpoint Thorisha.pptx
 

Analysing_quantitative_data.ppt

  • 2. • Introduction • Analysing qualitative data • Analysing quantitative data • Activities • Conclusion Presentation Outline
  • 3. Introduction • In the previous lectures we explored a number of different ways we can organize the data we have collected in order to support the analysis process. • In this lecture we will look at how we can analyze data, identifying particular techniques and processes in both qualitative and quantitative designs.
  • 4. What is data analysis? • A complex process that involves moving back and forth – between concrete bits of data and abstract concepts – between inductive and deductive reasoning – between description and interpretation • Simply put: Data analysis is the process of making meaning from the data
  • 5. Analysis process needs to do four things  Describe the data clearly. Identify what is typical and atypical among the data. Bring to light differences, relationships, and other patterns existent in the data; and Answer research questions or test hypotheses. (Mertler &Charles, 2005,p.170 )
  • 6. 6 Effective Data Analysis • Effective data analysis involves – keeping your eye on the main game – managing your data – engaging in the actual process of quantitative and / or qualitative analysis – presenting your data – drawing meaningful and logical conclusions
  • 7. Data analysis and interpretation • Think about analysis EARLY • Start with a plan • Code, enter, clean • Analyze • Interpret • Reflect – What did we learn? – What conclusions can we draw? – What are our recommendations? – What are the limitations of our analysis?
  • 8. Analyzing qualitative Data • Considerable amount of text-based data and images that require analysis. • Creswell (2003) suggests that it is useful to look at the codes that have emerged according to: Codes readers would expect to find; Codes that are uprising; and Codes that address a larger theoretical perspective in their research.
  • 9. Why do I need an analysis plan? • To make sure the questions and your data collection instrument will get the information you want. • To align your desired “report” with the results of analysis and interpretation. • To improve reliability--consistent measures over time.
  • 10. Preliminary Exploratory Analysis • Explore the data by reading through all of your information to obtain a general sense of the information • Memo ideas while thinking about the organization of the data and considering whether more data are needed – Jot memos in margins of fieldnotes, transcripts, documents, photos
  • 12. Developing Descriptions & Themes from the Data (case study approach) • Coding data • Developing a description from the data • Defining themes from the data • Connecting and interrelating themes
  • 13. Codes • Exploration of the different types of codes assist researchers in ensuring their analysis is balanced • Share your codes with your colleagues this is a useful way building depth into analysis and ensuring accuracy in interpretation of data
  • 14. Coding Data • Open Coding – Assign a code word or phrase that accurately describes the meaning of the text segment – Line-by-line coding is done first in theoretical research – More general coding involving larger segments of text is adequate for practical research (action research)
  • 16. Axial Coding • The process of looking for categories that cut across all data sets • After this type of coding, you have identified your themes • You can’t classify something as a theme unless it cuts across the majority of the data
  • 17. Clustering • After open coding an entire text, make a list of all code words • Cluster together similar codes and look for redundant codes • Objective: reduce the long list of codes to a smaller, more manageable number (25 or 30)
  • 19. Preliminary organizing scheme • Take this new list of codes and go back to the data • Reduce this list to codes to get 5 to 7 themes or descriptions • Themes are similar codes aggregated together to form a major idea in the database • Identify the 5-7 themes by constantly comparing the data (Constant Comparative Analysis)
  • 20. Constant Comparative Analysis (Glaser & Strauss; p. 86, The Art of Classroom Inquiry) • A process whereby the data gradually evolve into a core of emerging theory • This core is a theoretical framework that further guides the collection of data • Major modifications are lessened as comparisons of the next incidents of a category to its properties are carried out (Merriam, 1998).
  • 21. Why themes? • It is best to write a qualitative report providing detailed information about a few themes rather than general information about many themes • Themes can also be referred to as Categories
  • 22. Naming the Themes or Categories • The names can come from at least three sources: – The researcher – The participants – The literature • Most common: when the researcher comes up with terms, concepts, and categories that reflect what he or she sees in the data
  • 23. Themes should… • Reflect the purpose of the research • Be exhaustive--you must place all data in a category • Be sensitizing--should be sensitive to what is in the data – i.e., “leadership” vs. “charismatic leadership” • Be conceptually congruent--the same level of abstraction should characterize all categories at the same level
  • 24. Types of themes • Ordinary: themes a researcher expects • Unexpected: themes that are surprises and not expected to surface • Hard-to-classify: themes that contain ideas that do not easily fit into one theme or that overlap with several themes • Major & minor themes: themes that represent the major ideas, or minor, secondary ideas in a database – Minor themes fit under major themes in the write up
  • 25. A Description • A detailed rendering of people, places, or events in a setting in qualitative research • Codes such as “seating arrangements,” “teaching approach,” or “physical layout of the room,” might all be used to describe a classroom where instruction takes place
  • 26. Narrative description • From the coding and the themes, construct a narrative description and possibly a visual display of the findings for your research report • Use the assigned format
  • 27. Constructing the narrative • Identify dialogue that provides support for themes • Look for dialogue in the participants’ own dialect • Use metaphors and analogies • Collect quotes from interview data or observations • Locate multiple perspectives & contrary evidence • Look for vibrant detail • Identify tensions and contradictions in individual experiences
  • 28. Conveying personal reflections Because qualitative researchers believe that personal views can never be kept separate from interpretations, personal reflections about the meaning of the data are included in the research study – “David had been diagnosed with AD/HD and also with mild Tourette Syndrome. He took medication for AD/HD. He was selected to participate in the project as a confirming participant because he was so involved with the project and so intense during the first observation. Unaware that he had AD/HD and Tourette Syndrome until I interviewed his mother during the second year of the project, I was surprised because he was the most focused student in the classroom.”(Terry, 2003)
  • 29. Providing Visual Data Displays • Qualitative researchers often display their findings visually – Comparison table or matrix – Hierarchical tree diagram that represents themes and their connections – Boxes that show connections between themes – Physical layout of the setting – Personal or demographic information for each person or site
  • 31. Making comparisons with the Literature • Interpret the data in view of past research • Show how the findings both support and contradict prior studies – “These findings are consistent with other studies in regard to duration. It has been found that the length or duration of service learning projects has an impact on student outcomes, with the longer duration projects having greater impacts. However, significant differences are not found in projects lasting over 18 weeks (Conrad & Hedin, 1981). The project on which this study focused was examined over a year and a half period of time; thus it is considered to be long in duration which helps to explain its impact on student outcomes.”
  • 32. Synthesis of the data • Once researchers have a sense of what data mean and have identified categories and themes , it is time to start offering some hypothesis or propositions from the study. • This may describe the relationships among the categories that have been identified. • They may also show how the data fit with the proposed research problem at the beginning of the study
  • 33. • As researchers move through this process, they may discover that their initial guiding questions do not relate to what it is that the data reveal. • This is normal and quite acceptable in qualitative research designs. • It is important that research questions in qualitative studies evolve and change as directed by the data
  • 34. • Revisit some of the techniques, look for correlation, how well is your problem, research question and methods are correlated. • For example, using diagram, a table, or a flow chart may help researcher communicate the findings they have come up through analysis
  • 35. • The ultimate goal of synthesizing the analysis of data is to ensure that interpretation are clearly communicated to the readers of the research • It is therefore necessary that there is a clear connection between the data, the categories that emerge from the coding process and the interpretations offered. • It must be clear to the reader how the researchers drew their conclusions in relation to the identified study and the collected data
  • 36.
  • 37. Analysing quantitative data • Researchers' who have completed quantitative data gathering techniques will typically have considerable numerical data that require analysis . • As data are gathered, they are typically disorganised and made up of separate bits of information. • When numbers look this way , the meaning is not clear
  • 38. • Statistical analysis of these numbers is a way to focus and manage data. • Mertler and Charles (2005) identify a number of different purposes for using statistics. Specifically, statistics can: Summarise data and reveal what is typical and atypical within a group; Identify the relative standing of individuals within an identified cohort;
  • 39. • Show relationship between and among variables; • Show similarities and differences among groups; • Identify error that is inherent in a sample selection; • Test for significance of findings; and • Support the researchers in making other inferences about population
  • 40. • Statistics help to condense a vast body of data into an amount of information that the mind can more easily understand. • Statistics identifies patterns and relationships within the data that they may otherwise go unnoticed.
  • 41. Generating statistics • For many, the thought of generating statistics can be quite scary • The process of engaging with formulas and completing complex calculation can be daunting. • However modern technology, the software program such as SPSS ( Statistical Package for the Social Sciences)
  • 42. Measurement scales • Any form of measurement fall into one of the following four categories(referred to scales within the literature
  • 43. Measurement scale Characteristics Statistical possibilities Nominal scale Data are measured by assigning a name to identify specific categories. For example, when looking at data collected within a classroom we could distinguish between boys and girls within this group •Frequency distribution (mode) •Proportions ( percentage values) •Chi square Ordinal Scale Data are measured according to rank. Data are compared and contrasted to determine those that are greater than(>) compared to less than (<) within the data set. This scale can be used to rank students within a class according to their positions when compared with peers. As for ordinal scale plus • Median •Percentile rank •Spearman rank order •Correlation •Mann- Whitney test Ratio Scale
  • 44. Interval Scale Two key features are incorporated within this approach 1. The data are measured by equal units of measurement; 2. A zero point is established. Temperature is measured on an interval scale As for ordinal scale plus: Mean Standard deviation Pearson Product- moment Correlation Inferential procedures (e.g., t- test, ANOVA) Ratio Scale Two key features are incorporated within this approach 1. The data are measured by equal units (as in interval scale) 2. An absolute zero point is established 3. In the temperature example for interval scale, the material from which the temperature is obtained may have a different starting point (i.e. May be warmer or cooler than other materials measured. As for ratio scale plus:  Geometric mean Percentage variance Inferential procedures
  • 45. How the above collected data can fit within each of these scales • One object is different from another, you have a nominal scale • One object is bigger or better or more of anything than another, you have an ordinal scale. • One object is so many units (degrees, inches) more than another you have an interval scale; • One object is so many times big or bright or bright or tall or heavy as another you have a ratio scale
  • 46. Descriptive statistics • Calculated in order to report on and describe what happened during the period of research. • There are three basic categories of descriptive statistics, all of which are frequently used by teacher- researchers. These categories are: Measures of central tendency. Measures of dispersion Measures of relationship
  • 47. Measures of central tendency • Statistical procedures that indicate, with a single score, what is typical or standard about a group of individuals. These indices are commonly used when trying to describe the collective level of performance, attitude, or opinion of a group of study participants. There are three measures of central tendency: the mean, the median, and the mode.
  • 48. Measures of dispersion • Indicates what is different within a group of scores, • It also indicates how much spread or diversity exist within a group of scores. • The two primary measures of dispersion Range (H-L) Standard deviation is formally designed as the average distance to scores away from the mean
  • 49. Measures of relationship • The third type of descriptive statistics measures relationship between variables. There are numerous types of correlation coefficients, the name given to these various measures the direction and degree of relation ship between two variables. It is calculated when analysing data from studies using correlation design.
  • 50. Activity • Look at the research paper. As you read the paper identify. a. The research question and hypothesis b. How the participants were selected. c. The instrument used for measurement d. How the statistics were generated e. How the data and statistics have been analysed and f. The relationship between the statistics , conclusions and research.
  • 51. Workshop • Discussion about Presentation • Rubrics
  • 53. 53 The Big Picture • Analysis should be approached as a critical, reflective, and iterative process that cycles between data and an overarching research framework that keeps the big picture in mind
  • 54. 54 Managing Data • Regardless of data type, managing your data involves – familiarizing yourself with appropriate software – developing a data management system – systematically organizing and screening your data – entering the data into a program – and finally ‘cleaning’ your data
  • 55. 55 Drawing Conclusions • Your findings and conclusions need to flow from analysis and show clear relevance to your overall project • Findings should be considered in light of – significance – current research literature – limitations of the study – your questions, aims, objectives, and theory
  • 56. 56 Looking ahead Ethics and Communicating research