Downloaded 196 times
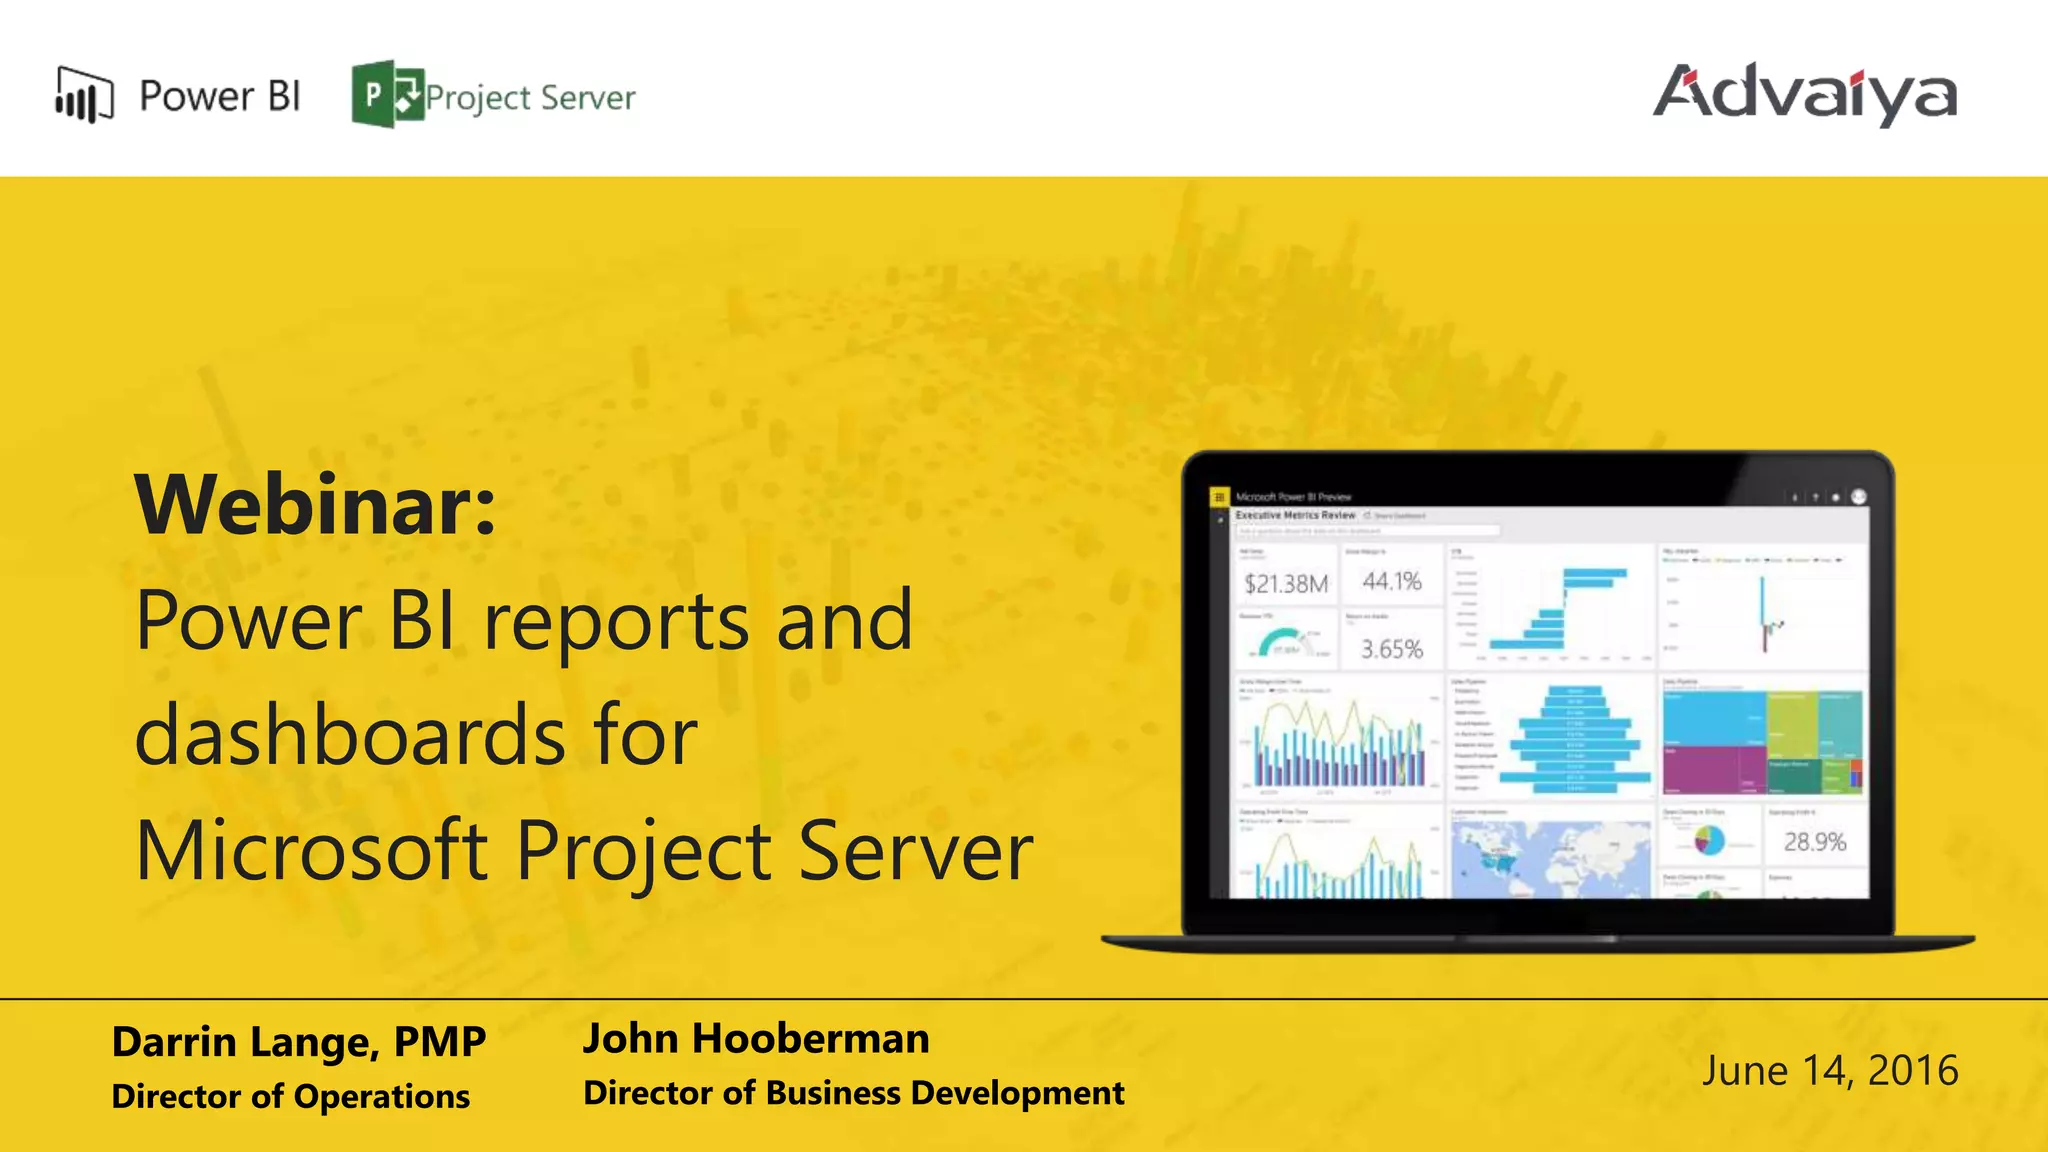


The webinar on Power BI reports and dashboards for Microsoft Project Server, led by Darrin Lange and John Hooberman, covers essential concepts such as accessing PWA data, using Power BI tools, and creating collaborative workspaces. Attendees will learn about building blocks of Power BI, the power of natural query language, and the use of custom visuals for data representation. The session also provides an overview of Advaiya Solutions and its capabilities in project management and technology consulting.
Introduction to the webinar on Power BI and speakers Darrin Lange and John Hooberman, highlighting their roles.
Overview and code of conduct for the webinar including session format and attendee expectations.
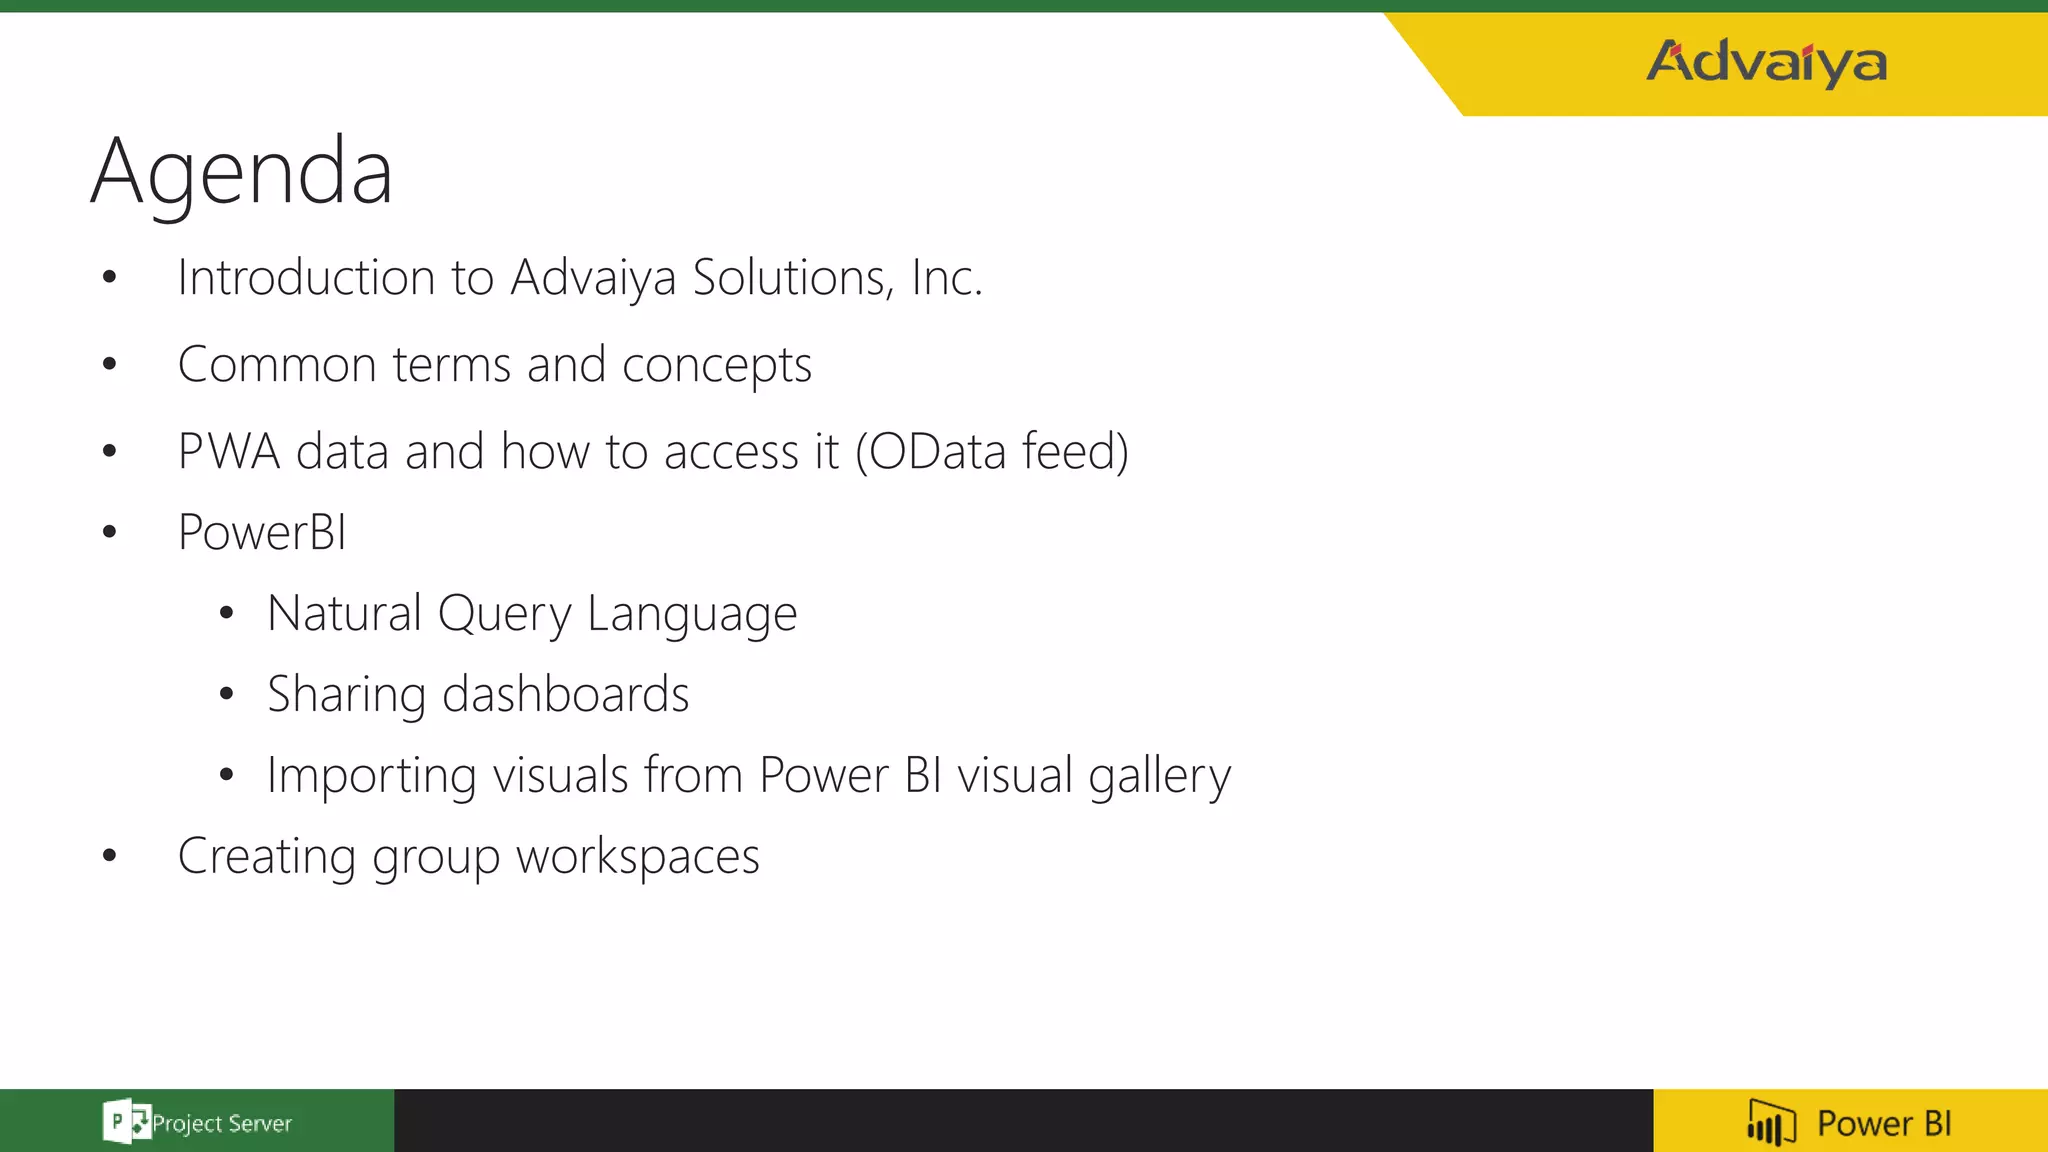
Detailed agenda covering topics from company introduction to Power BI features and functionalities.
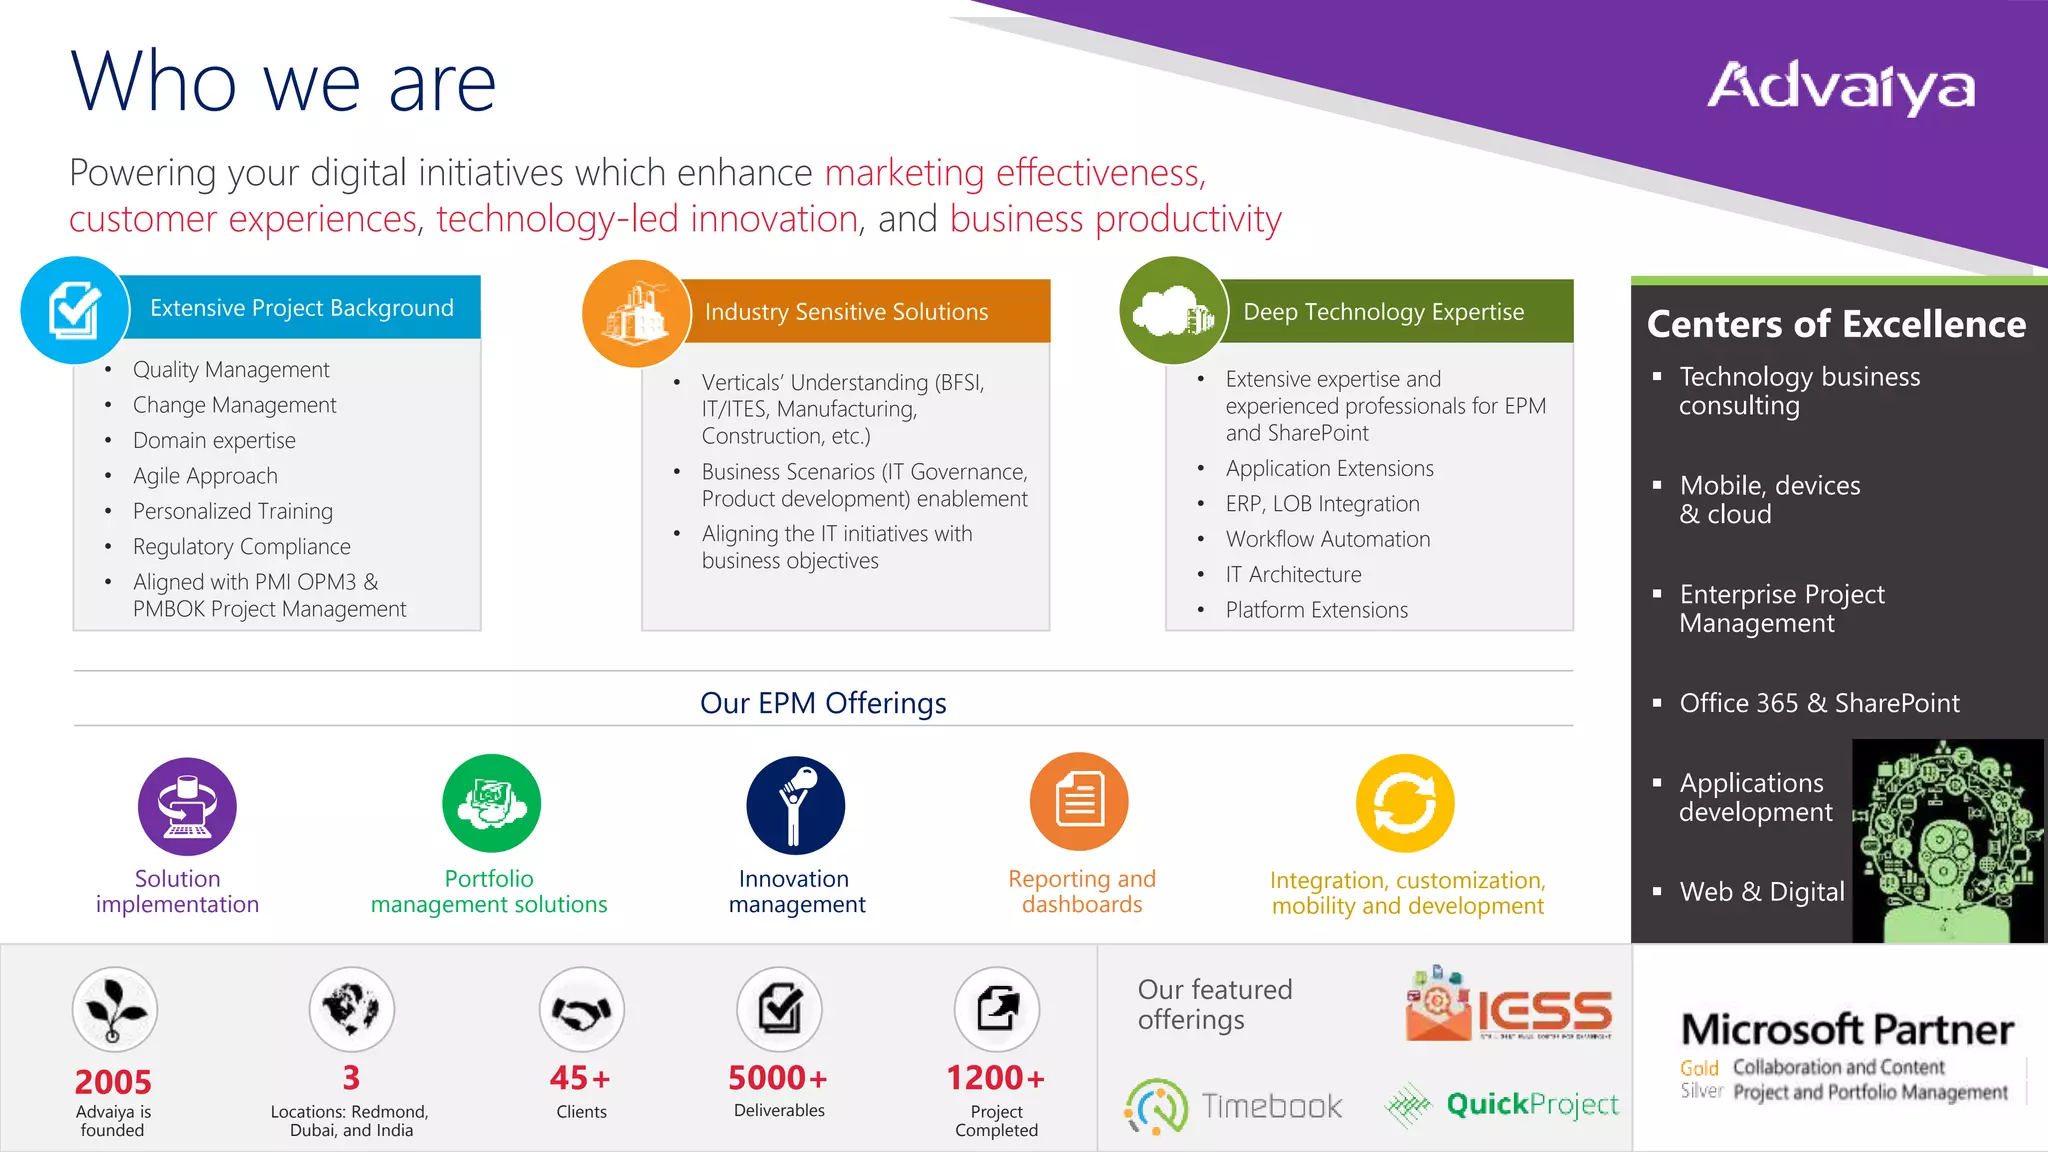
Insight into Advaiya Solutions' offerings, expertise in EPM, project management, and client achievements.
Brief mention of key terms and concepts relevant to the Power BI discussion.
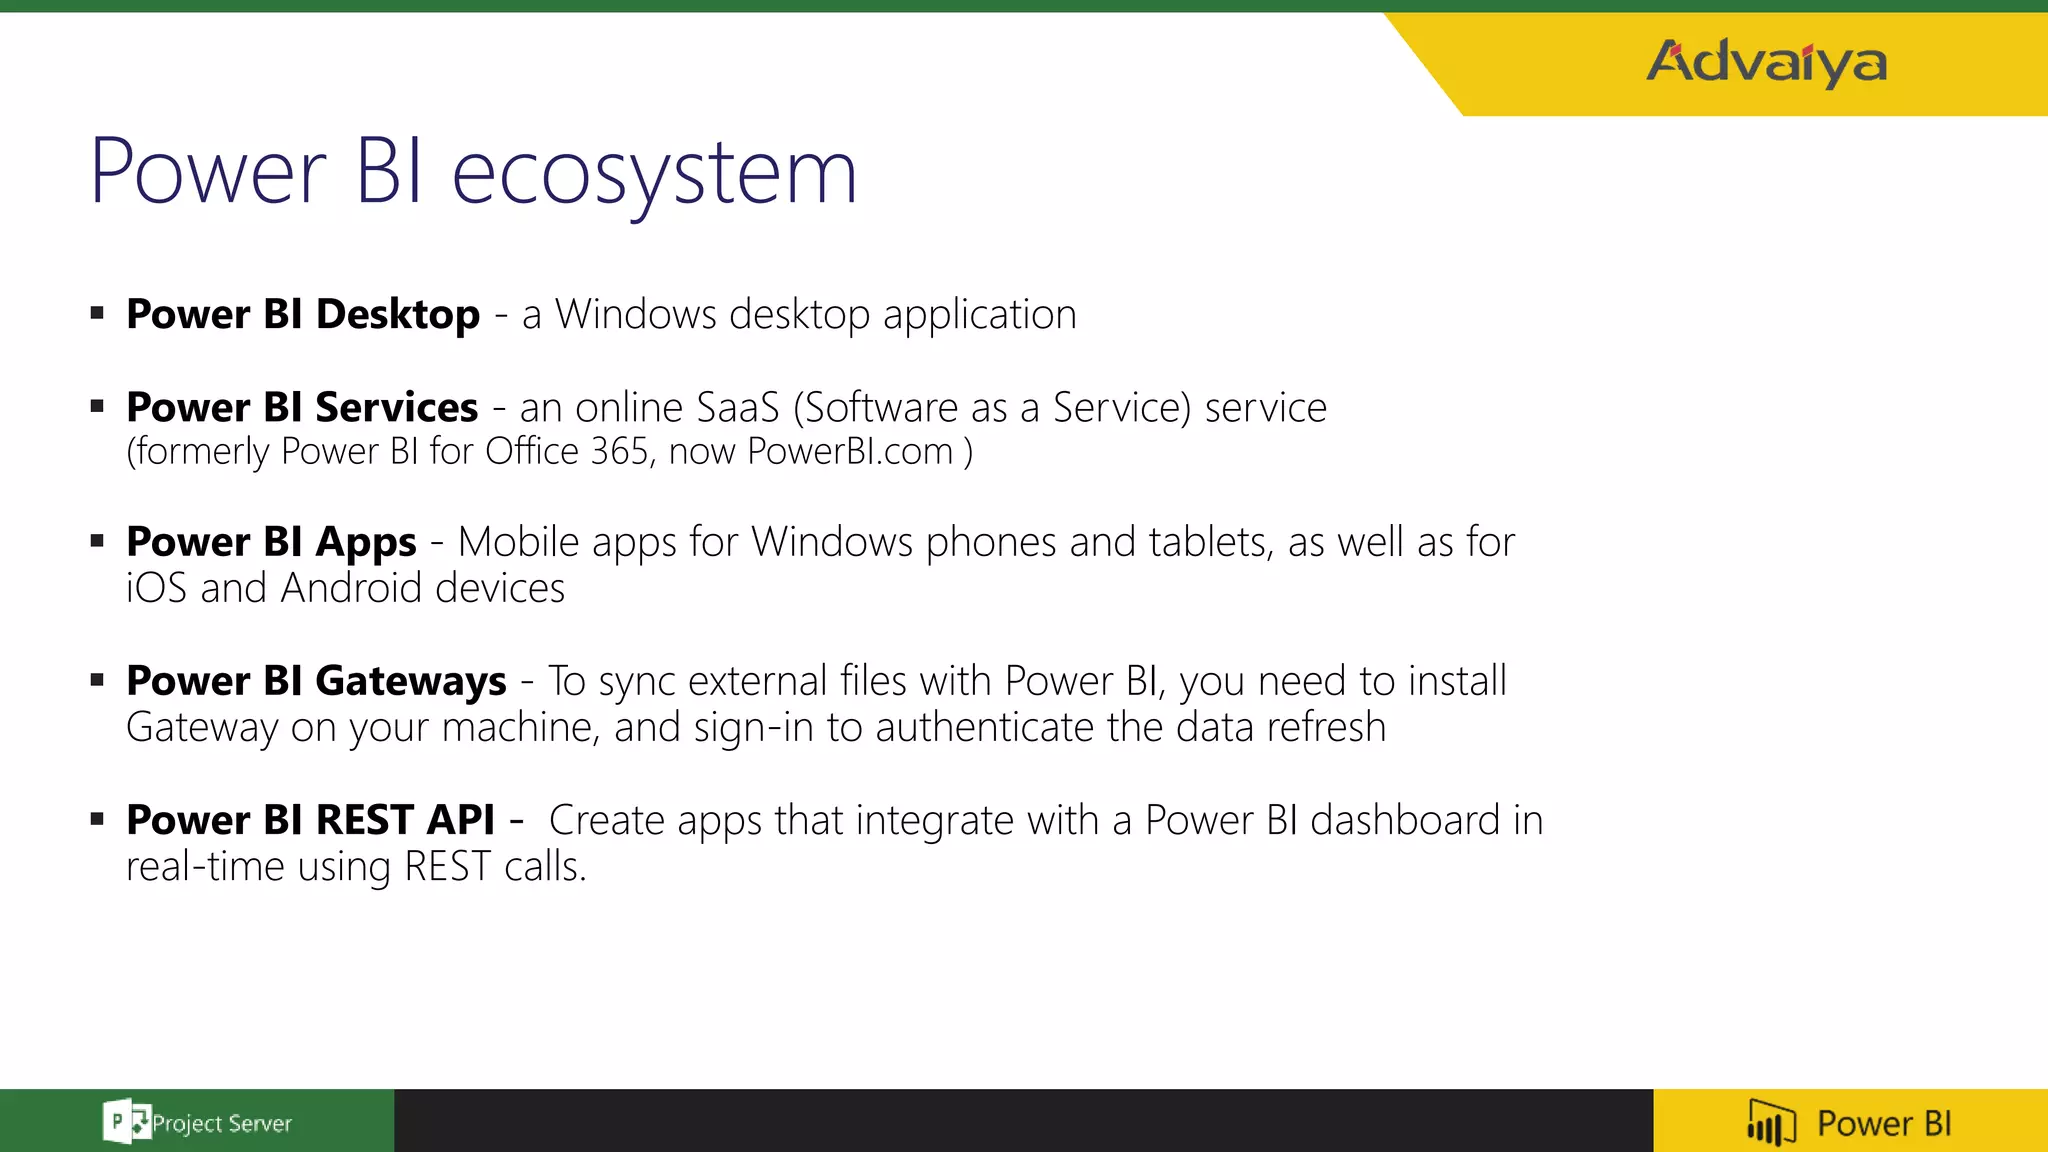
Components of Power BI including Desktop, Services, Apps, Gateways, and REST API for integrations.
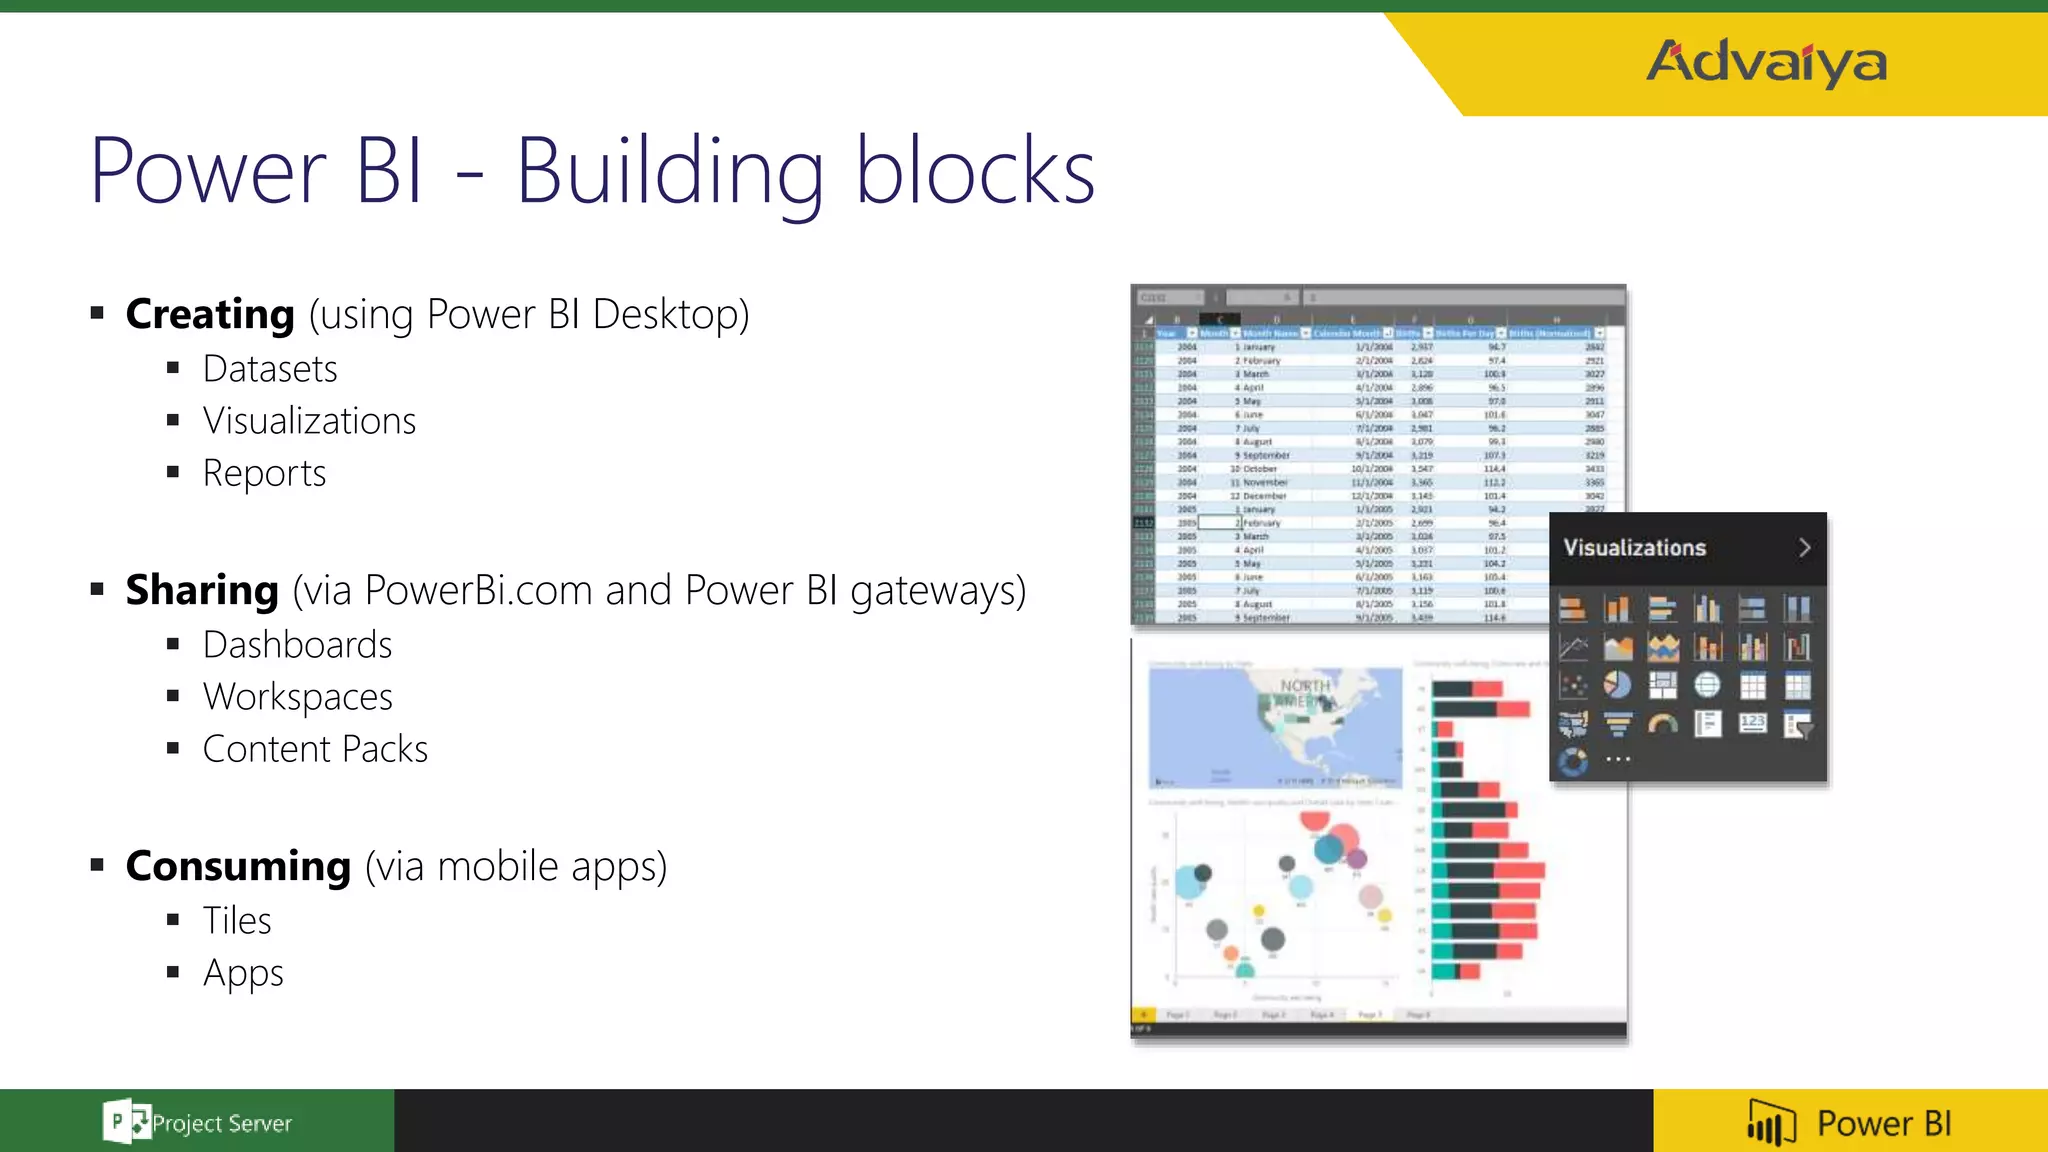
Core elements of Power BI like datasets, reports, dashboards, workspaces, and sharing capabilities.
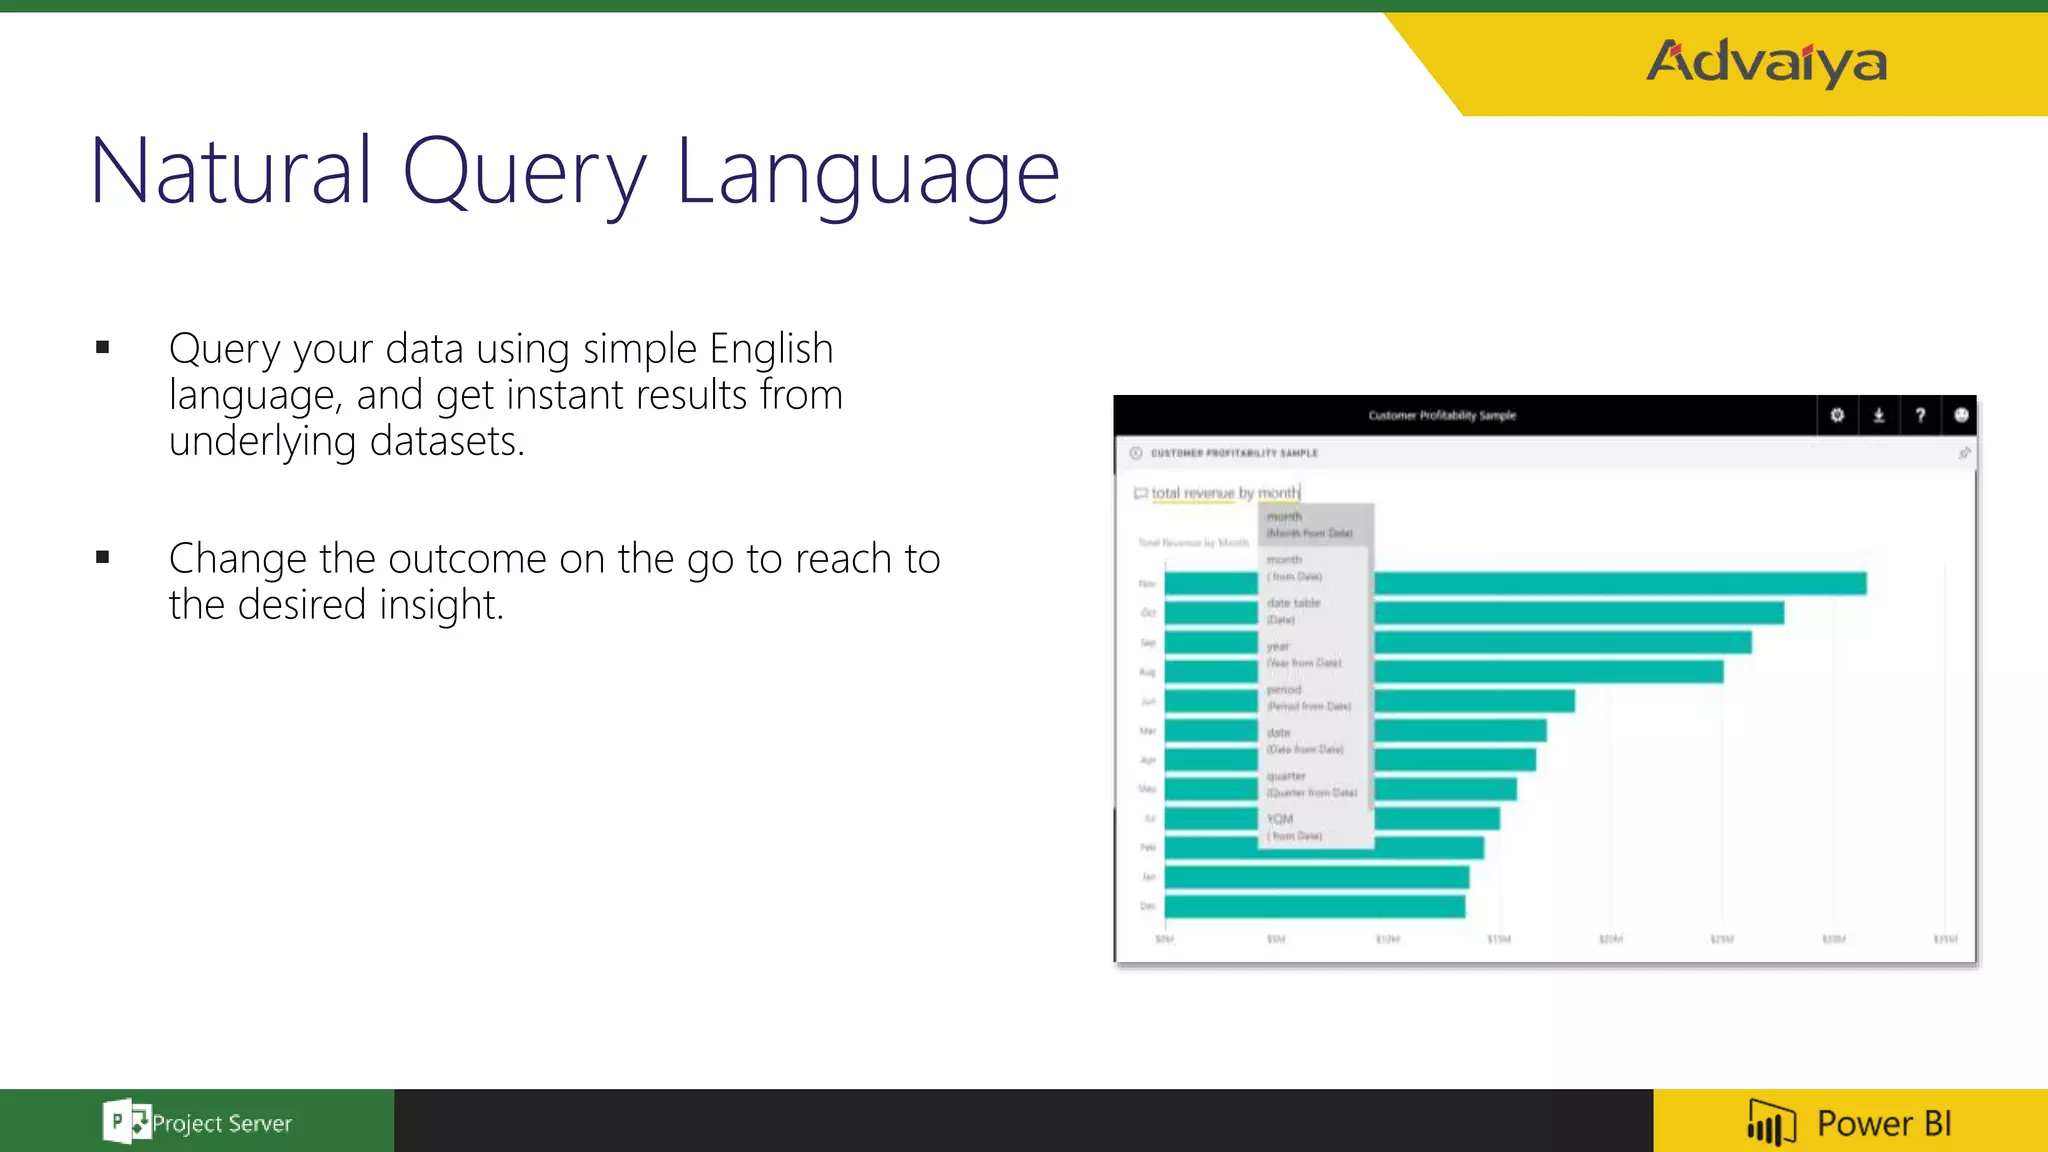
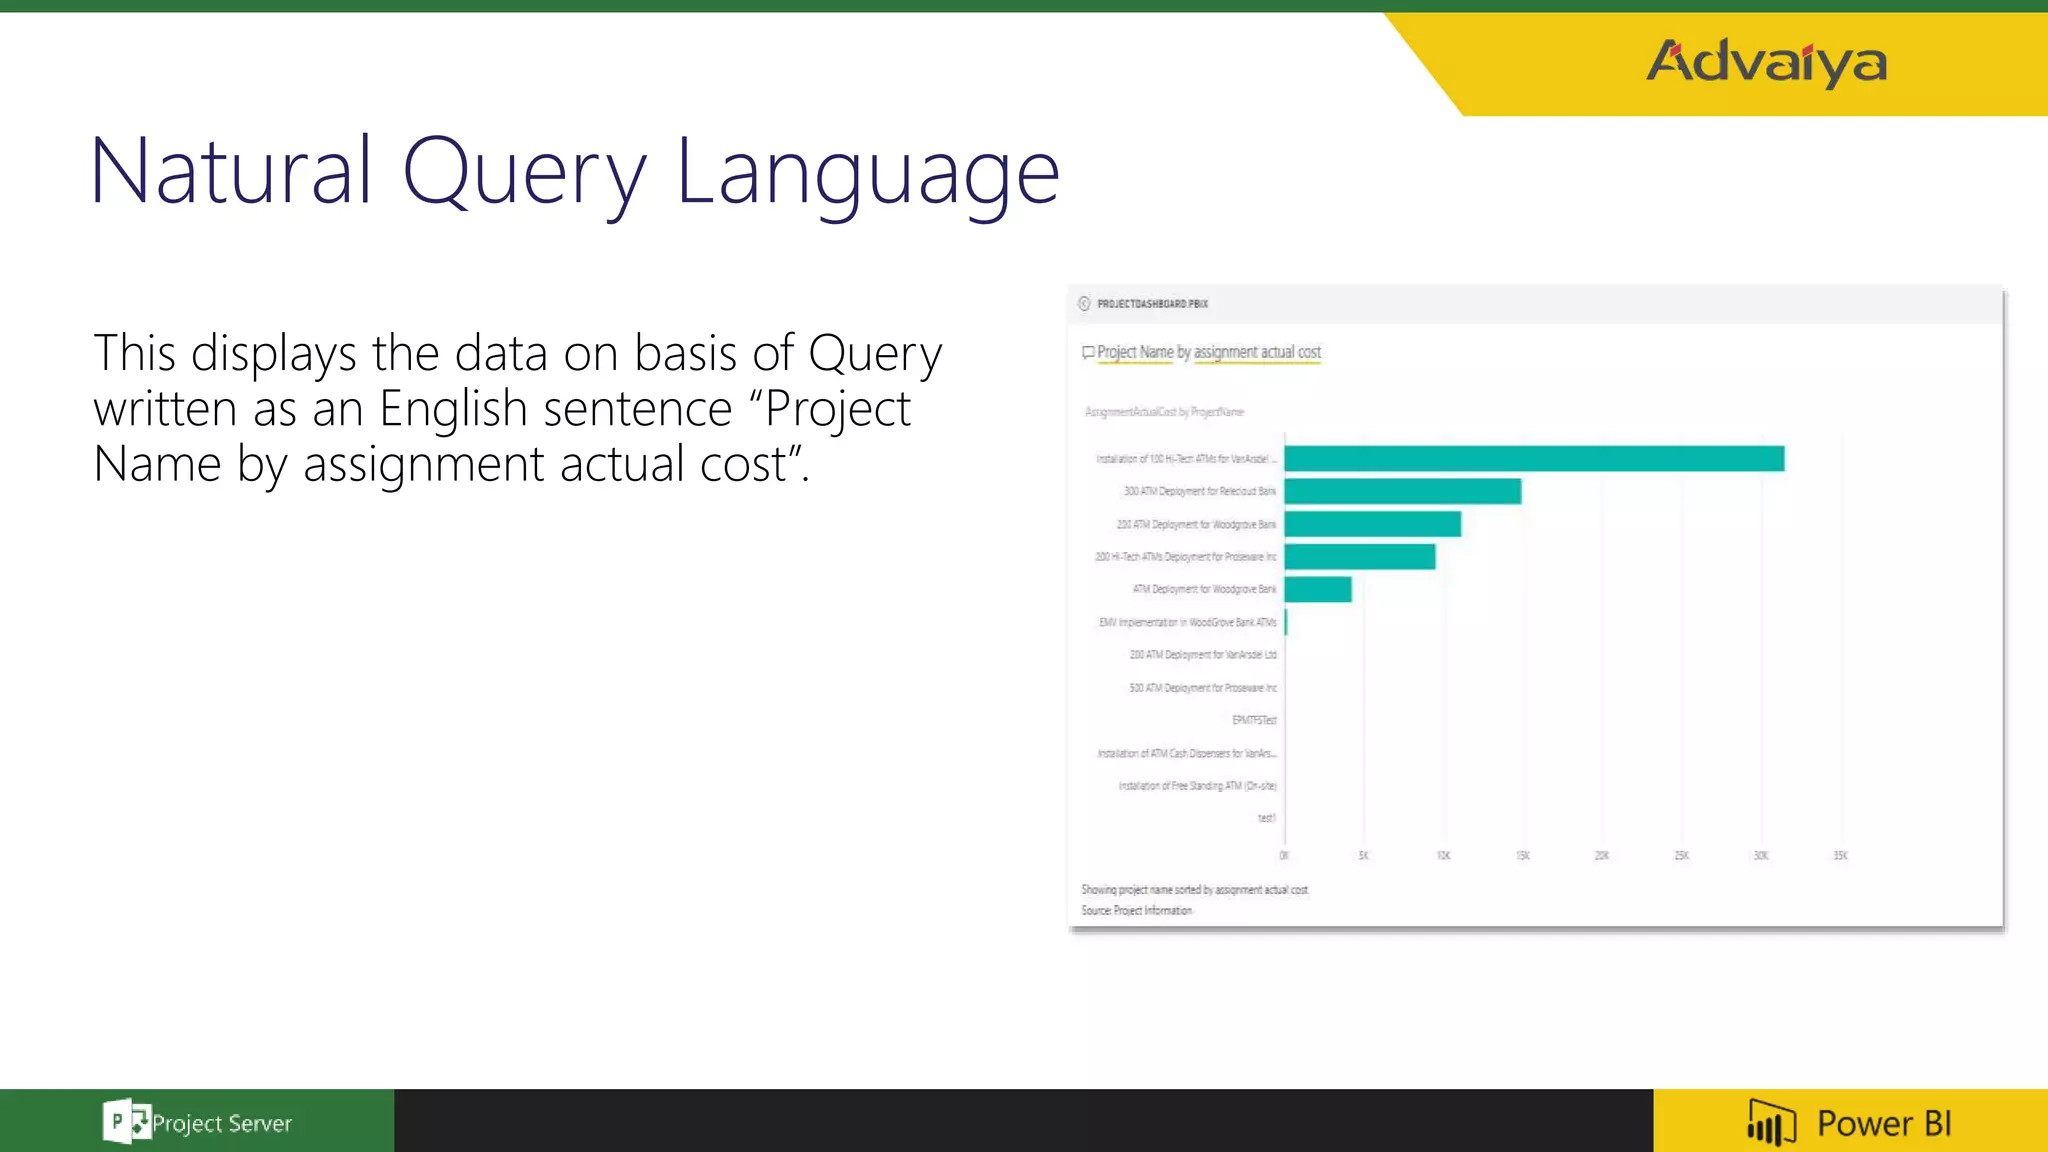
Explanation of Natural Query Language that allows querying data in simple English for insights.
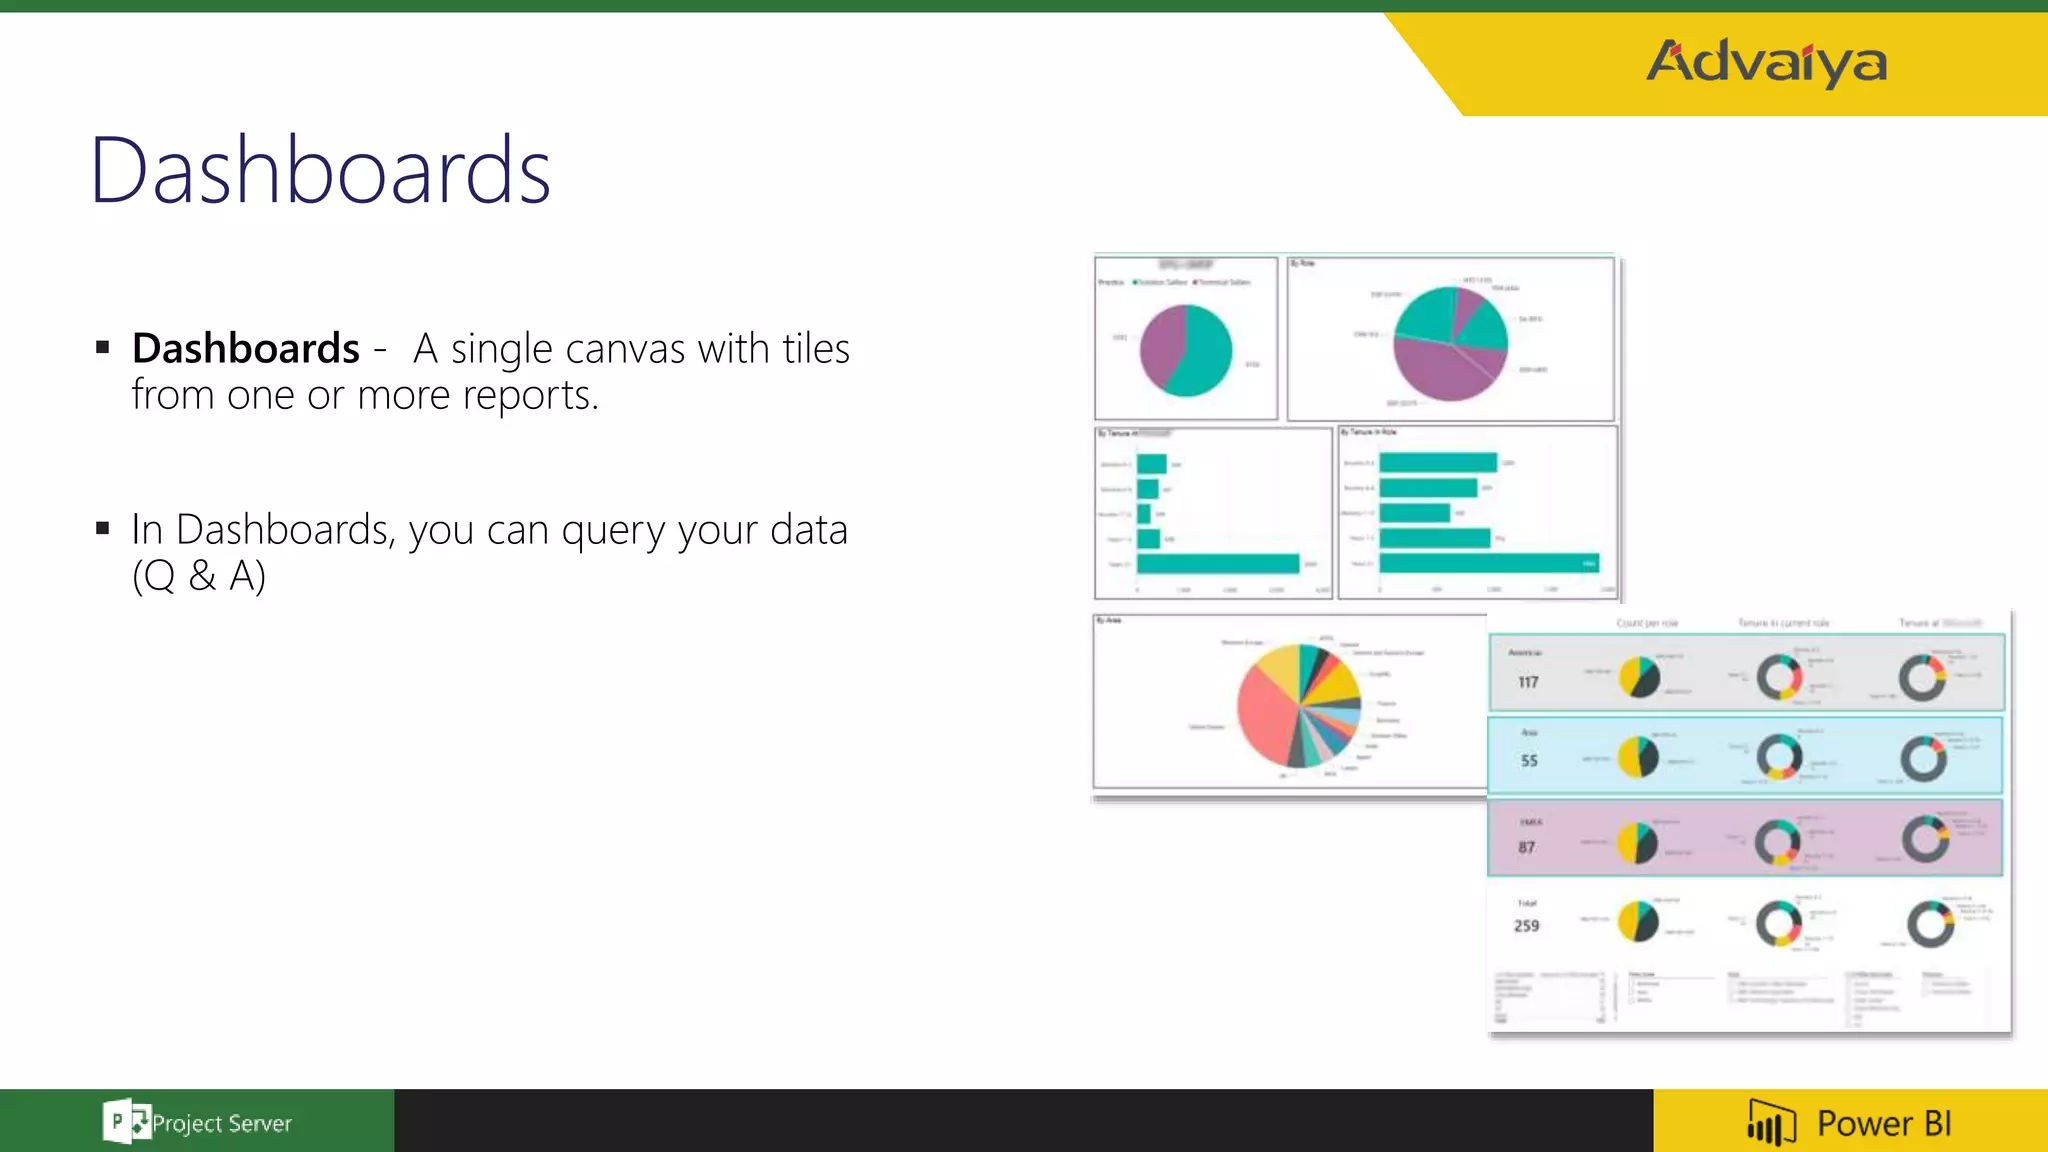
Explanation of dashboards in Power BI and their capabilities to represent data from multiple reports.
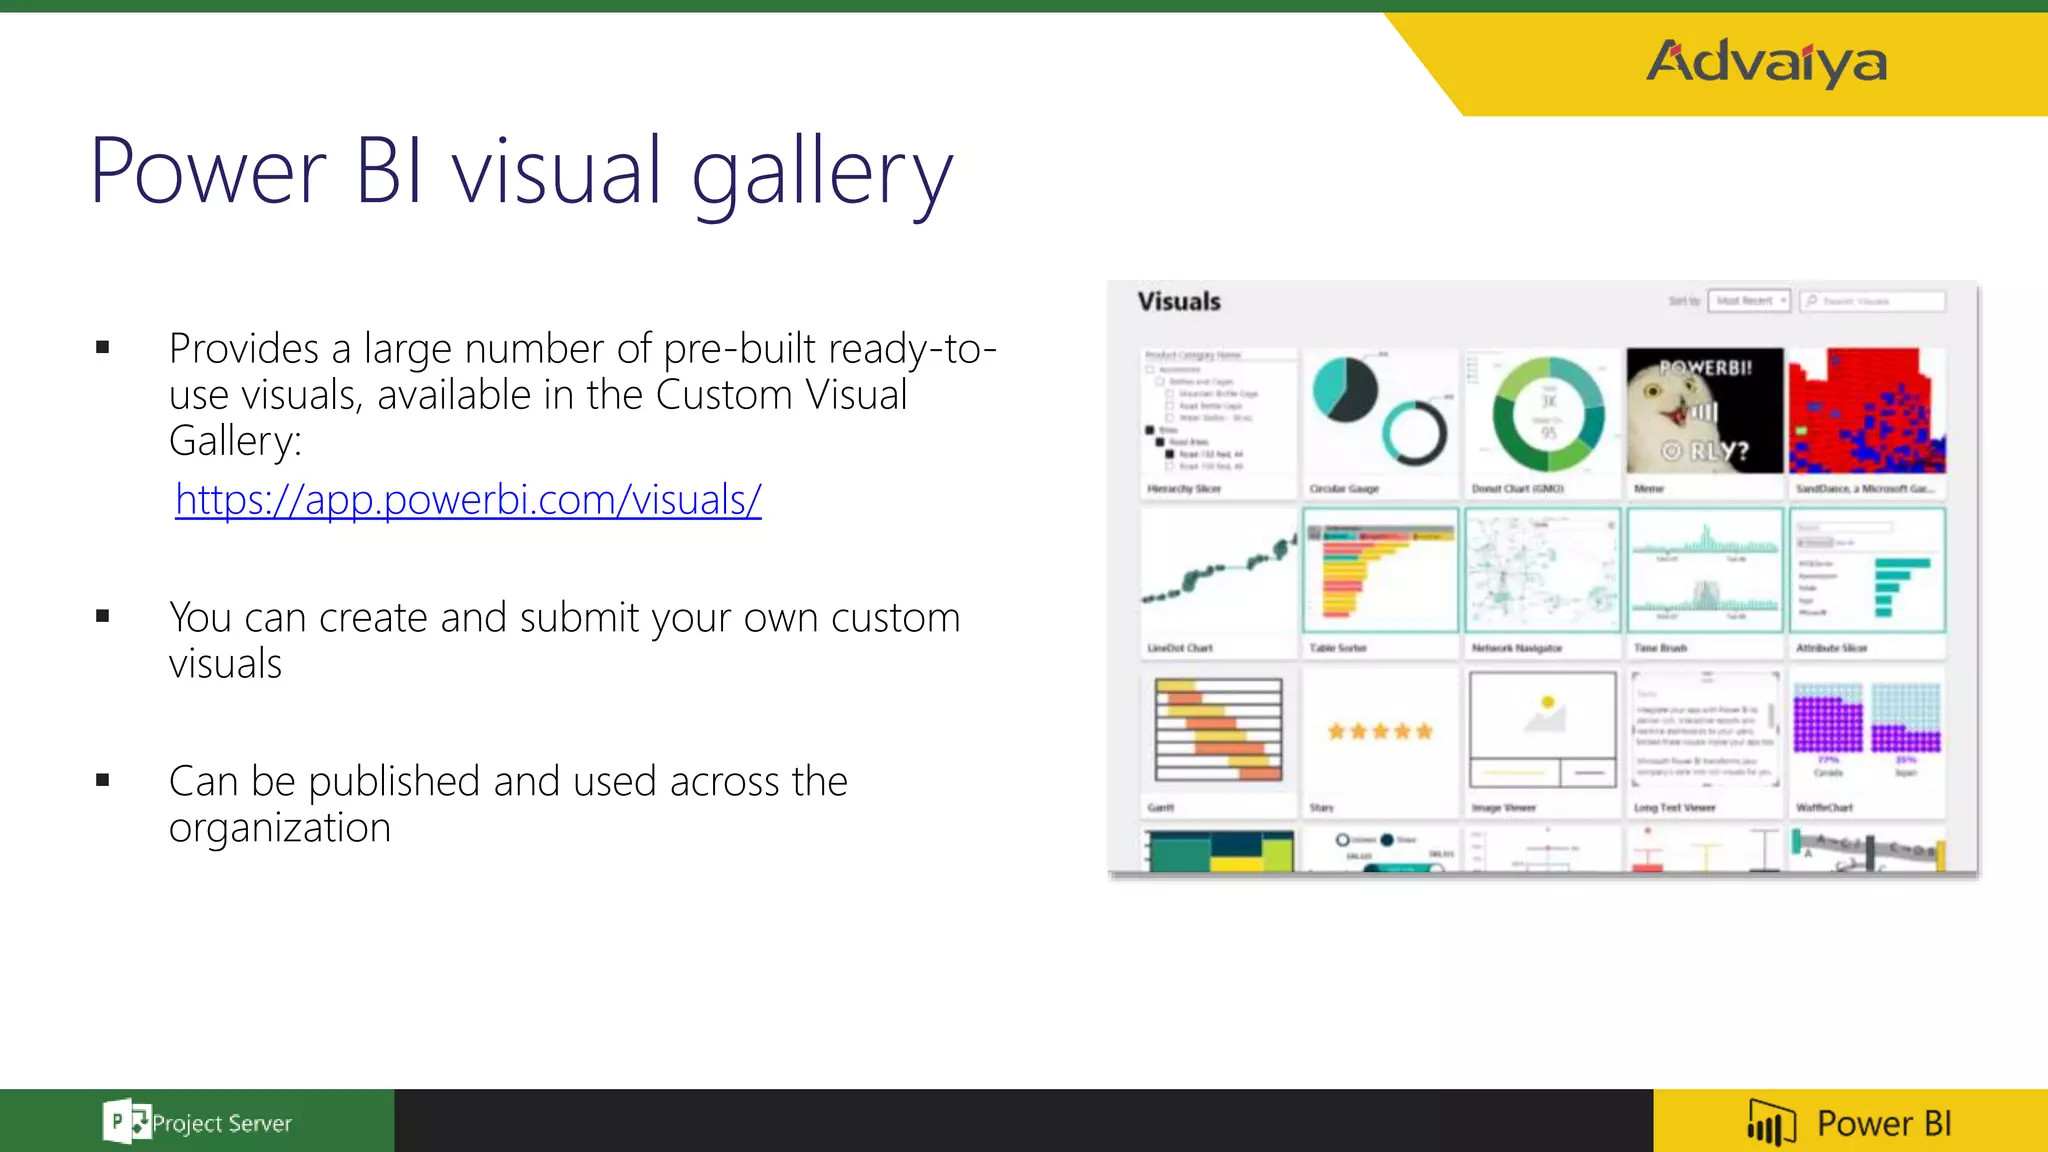
Introduction to the Custom Visual Gallery offering pre-built visuals and options to create custom ones.
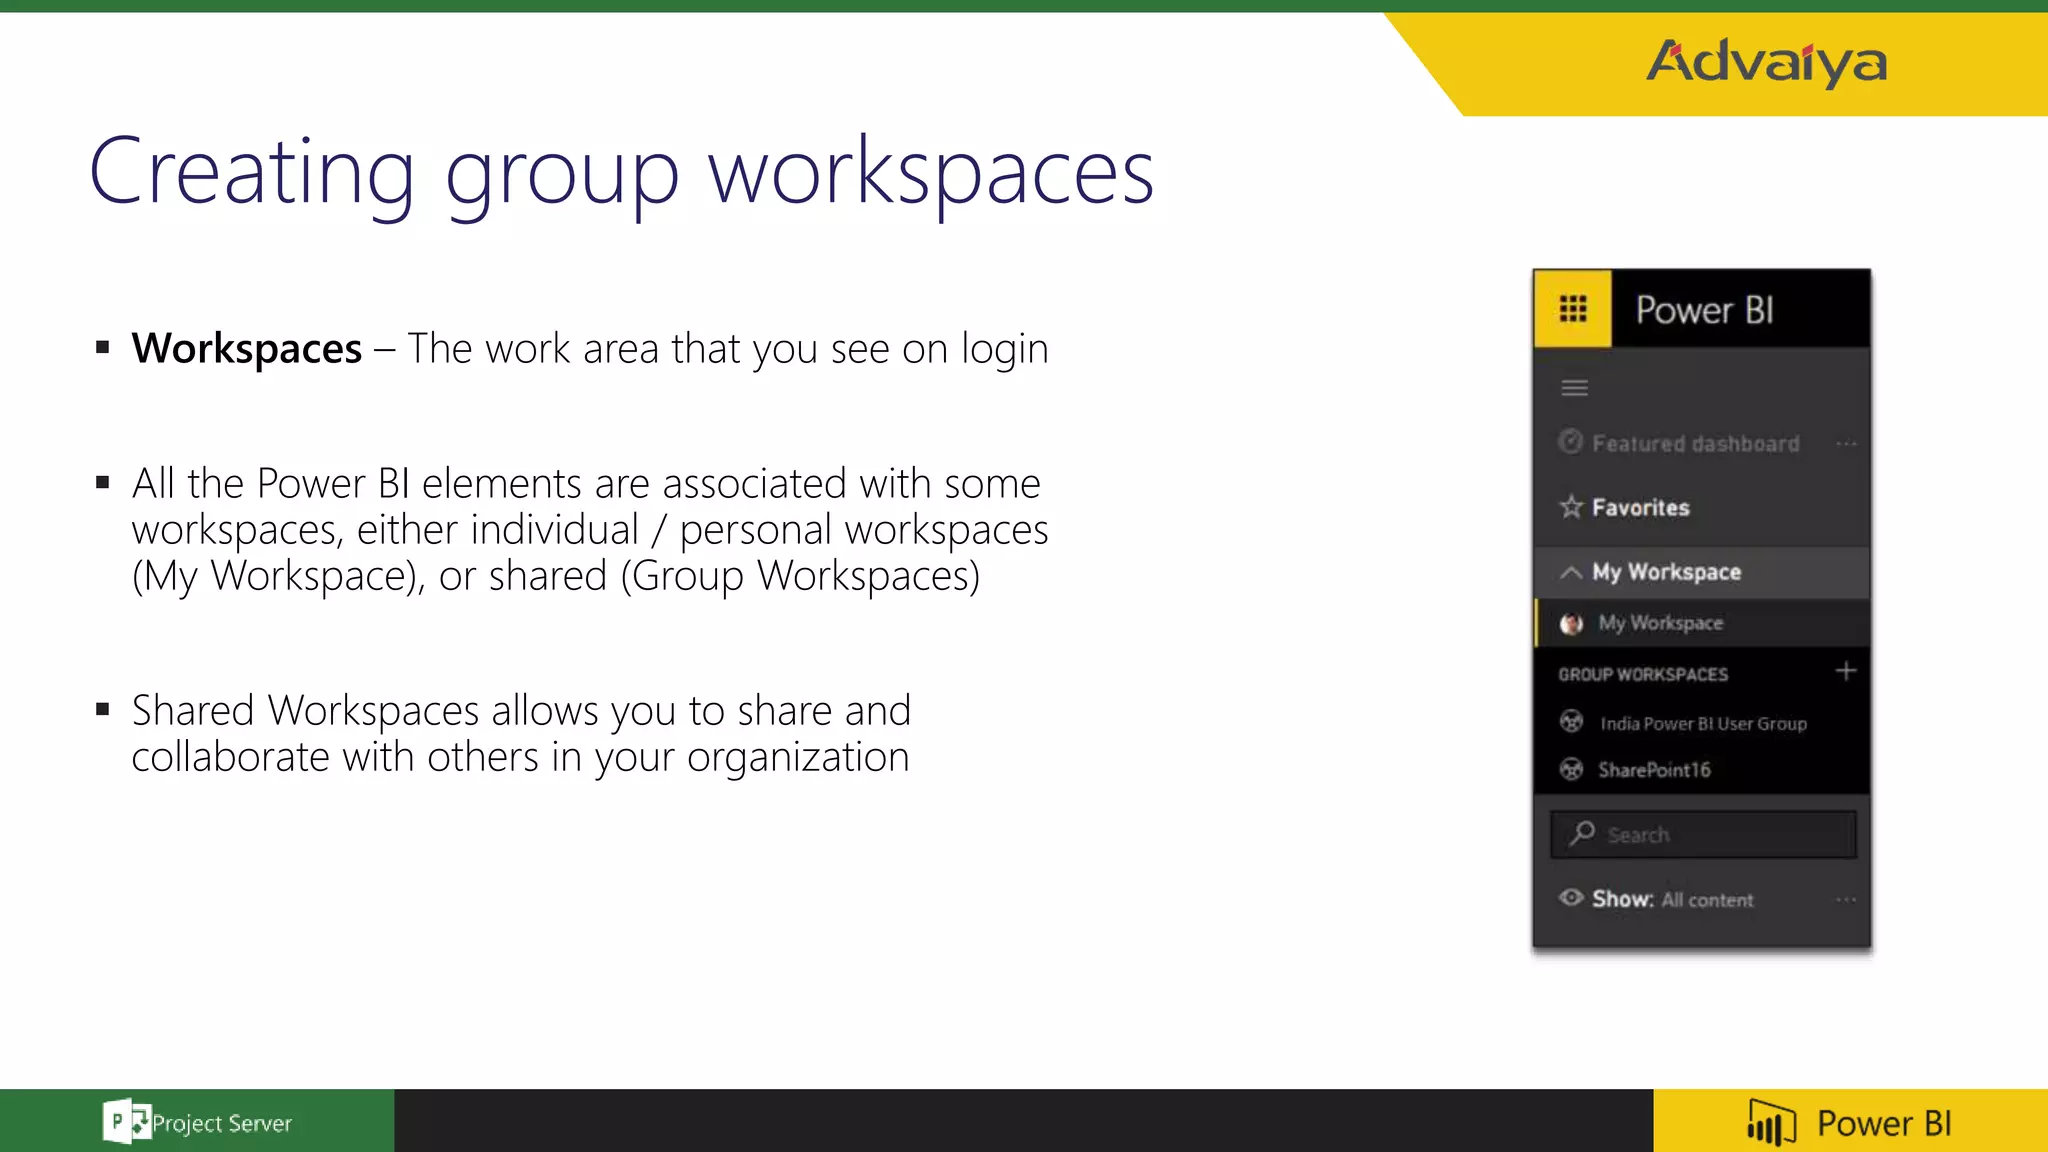
Details on workspaces within Power BI for collaboration and sharing among users.
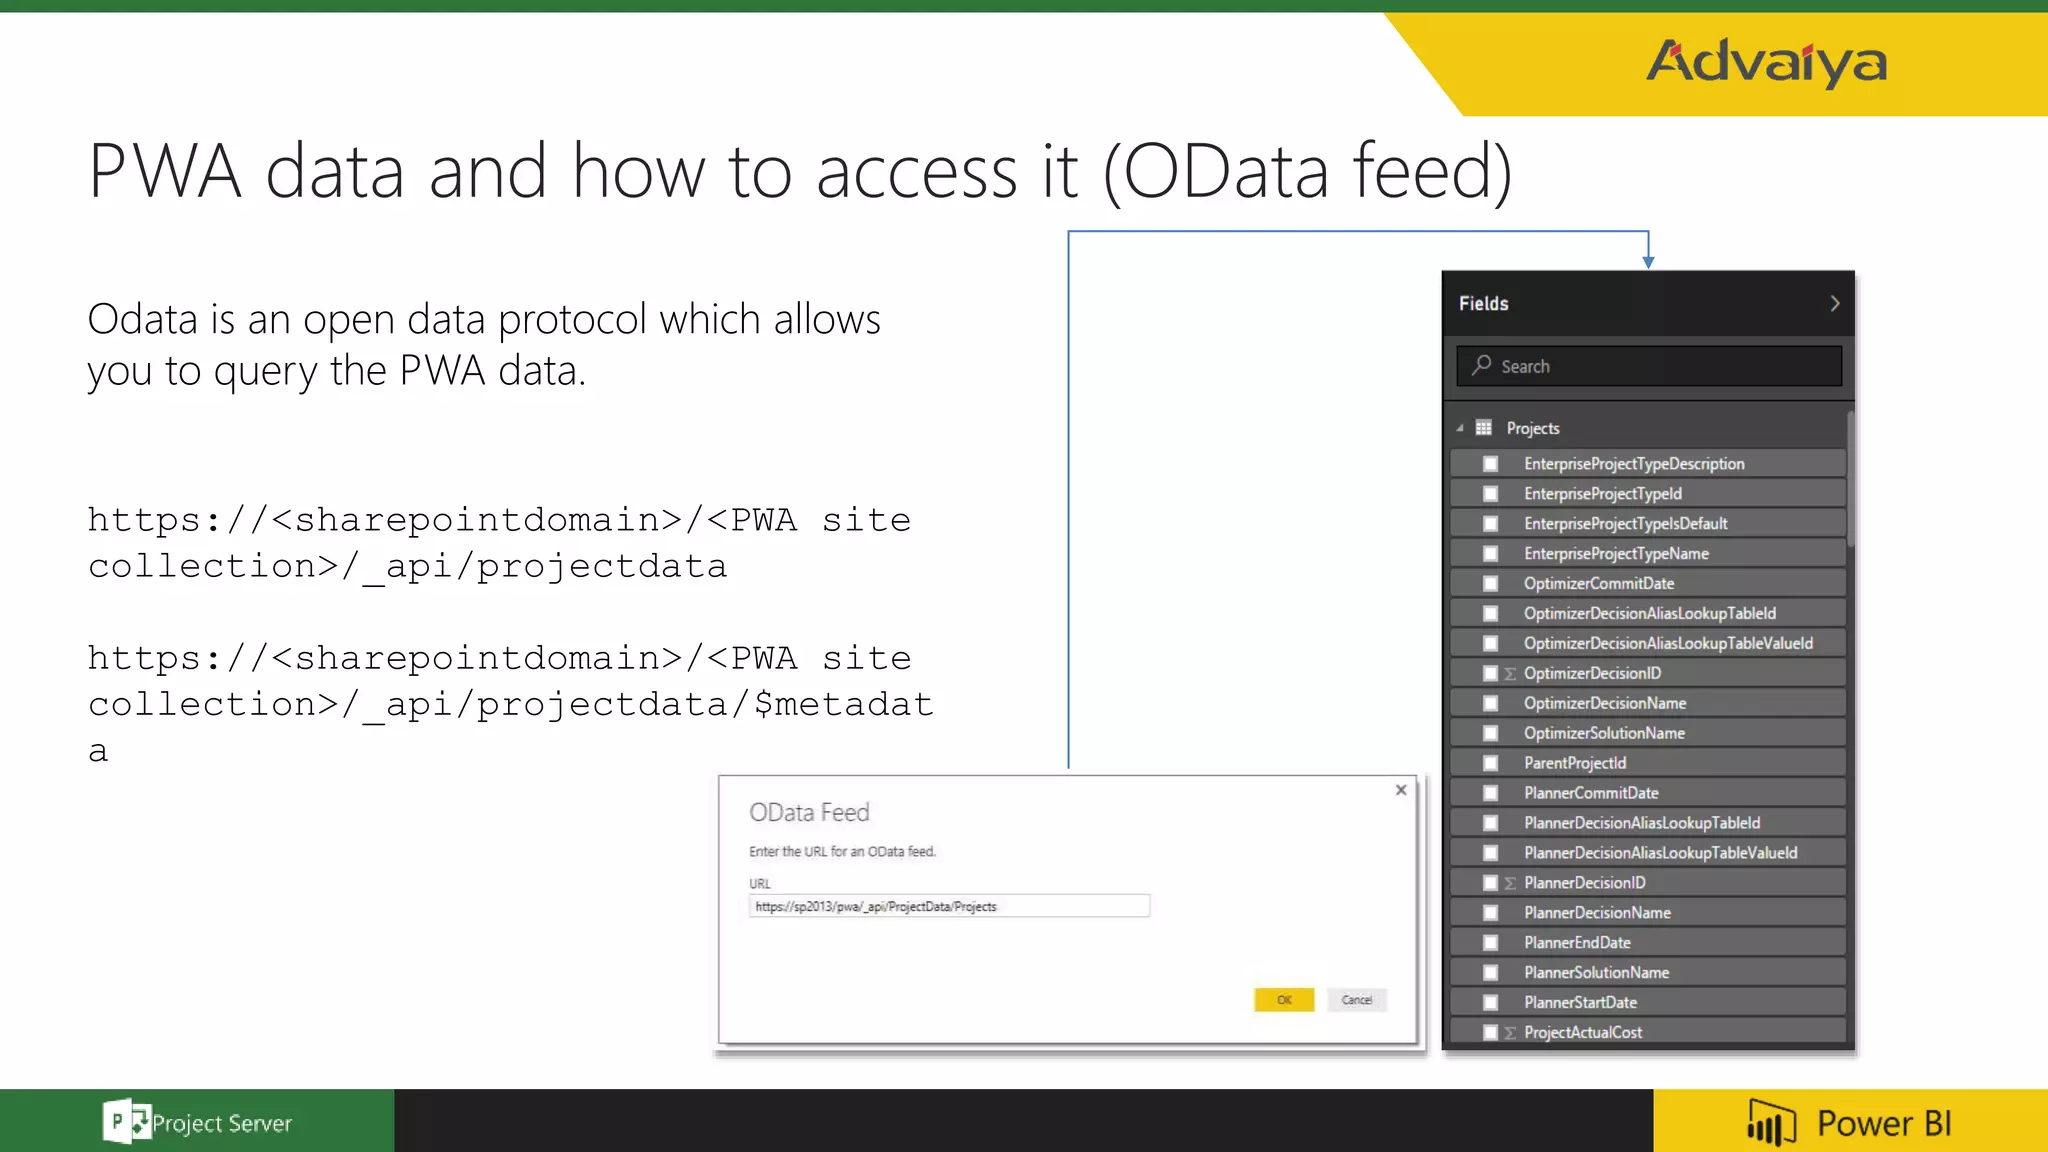
Methods to access Project Web App (PWA) data using OData protocol with links for querying.
Example application of Natural Query Language to display project-related data.
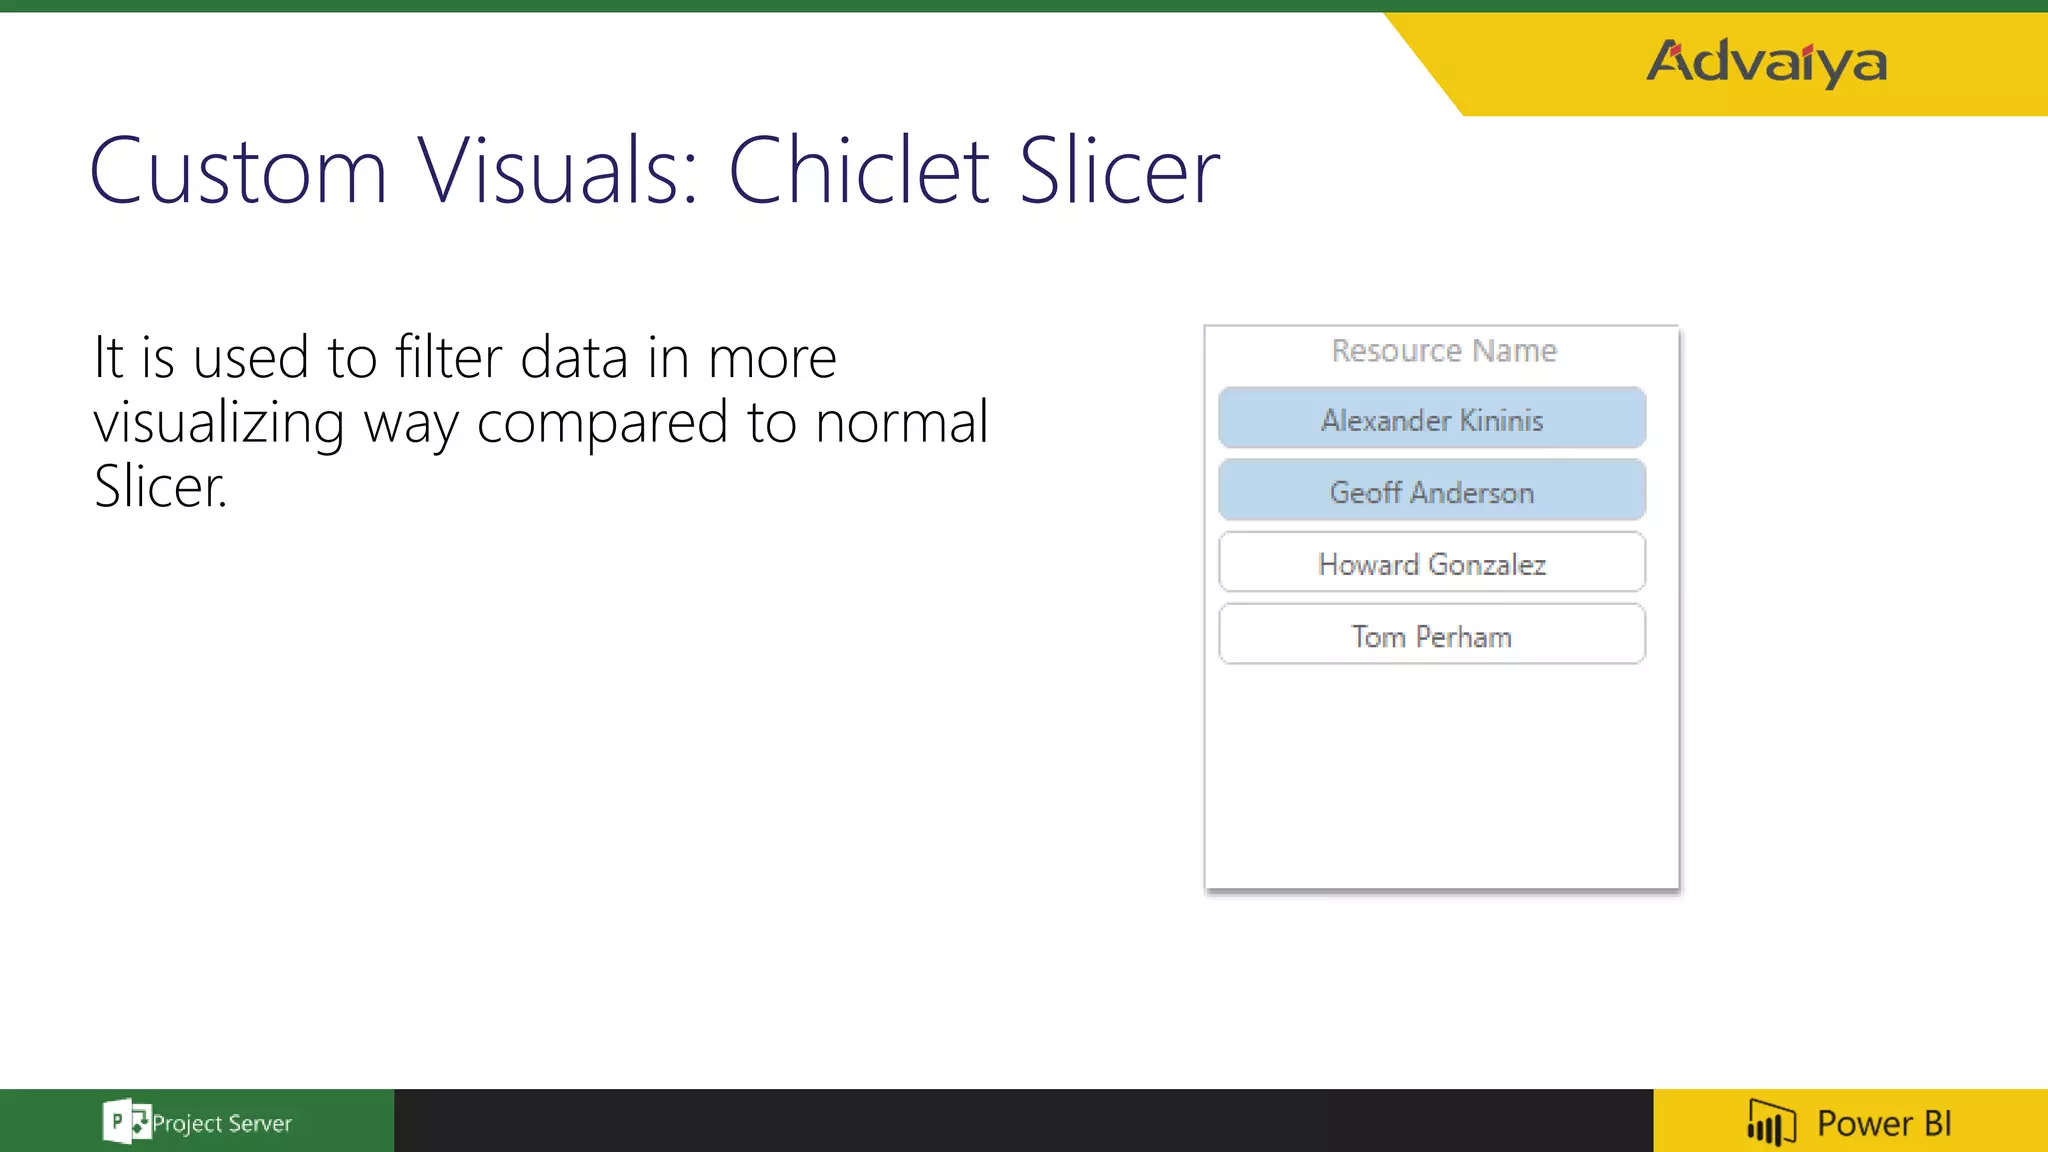
Description of Chiclet Slicer as a custom visual tool for enhanced data filtering.
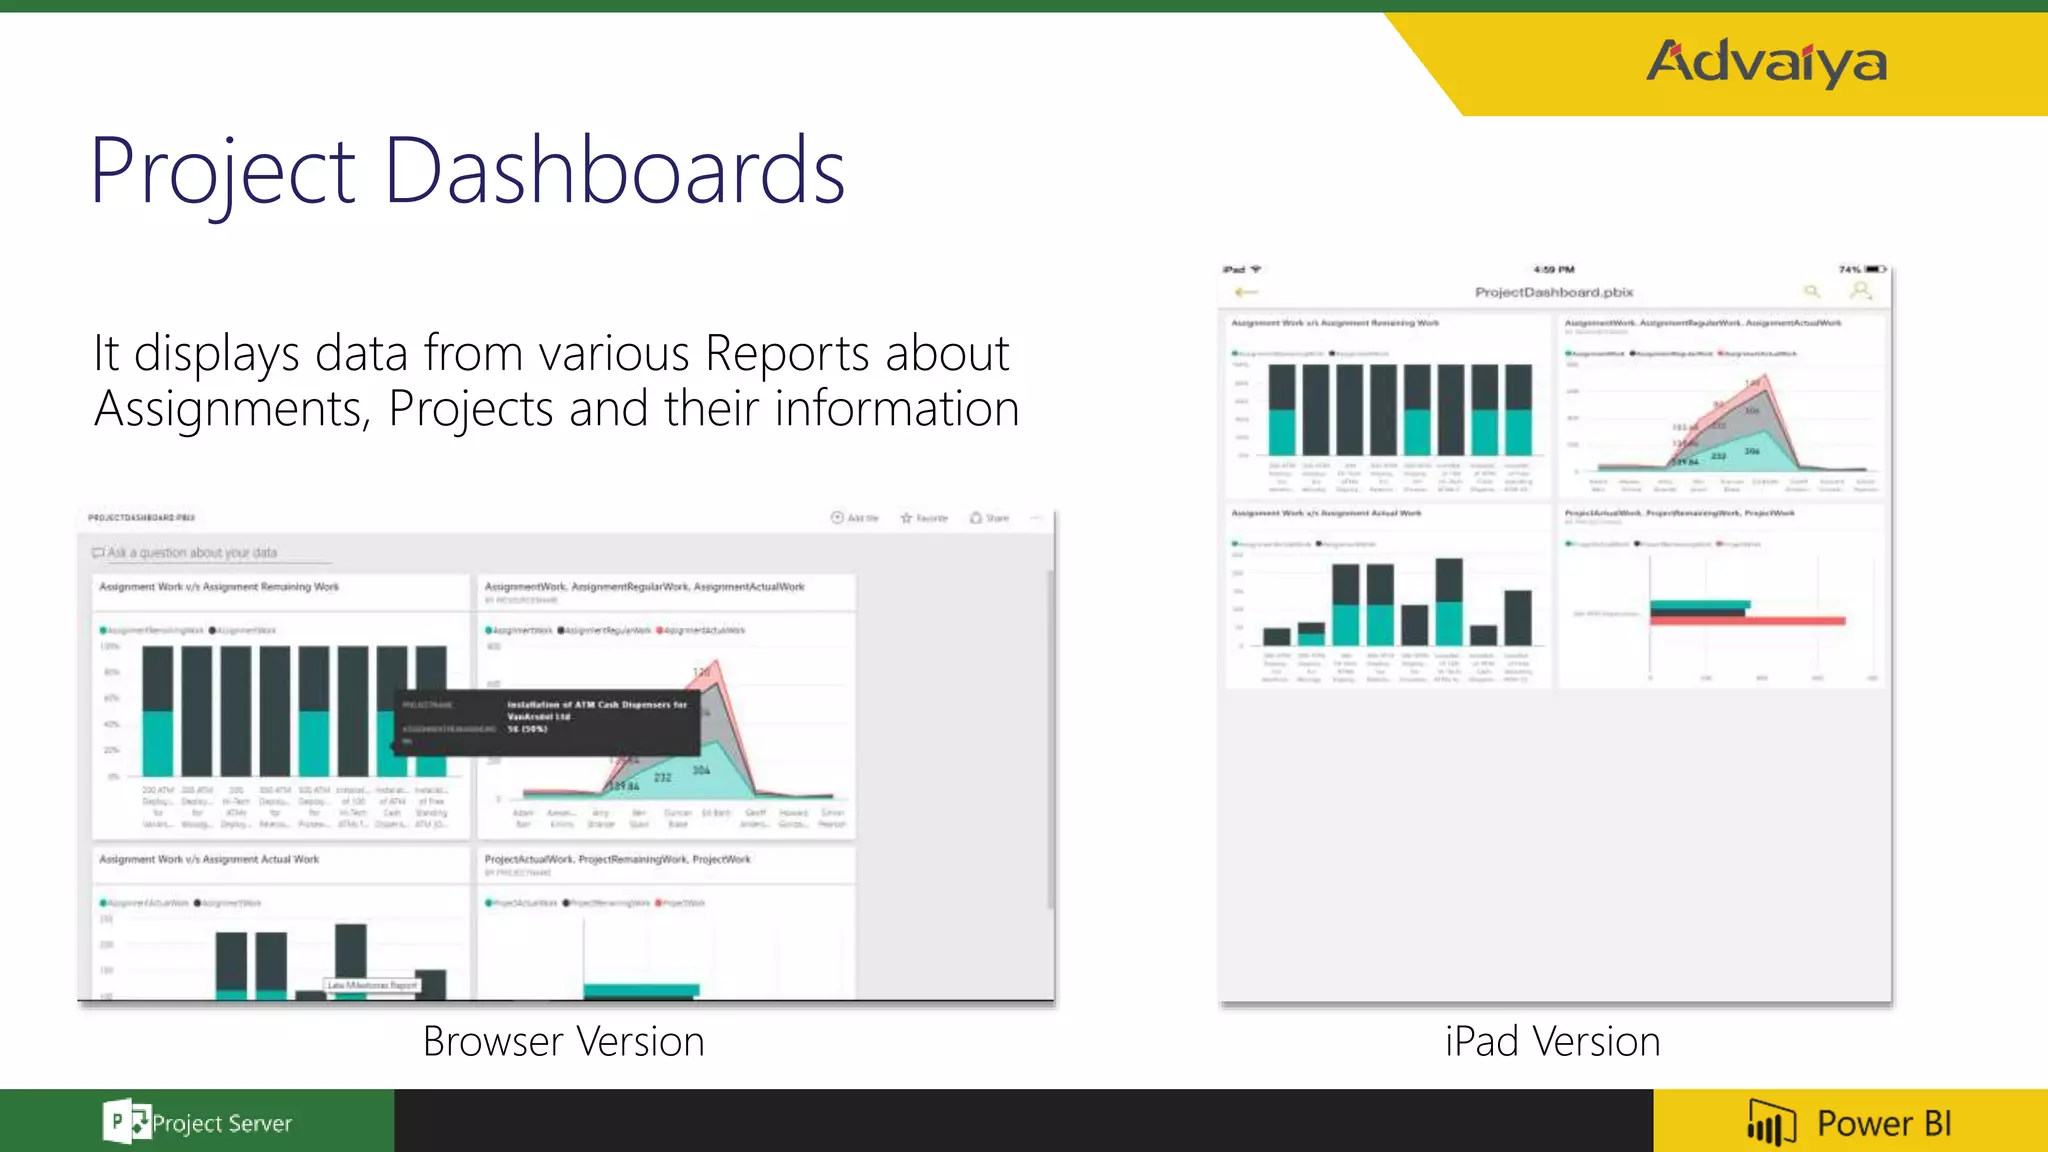
Presentation of project dashboards showcasing assignments and project information.
Section for demonstrating Power BI functionalities in real-time.
Open floor for questions from attendees regarding the webinar content.
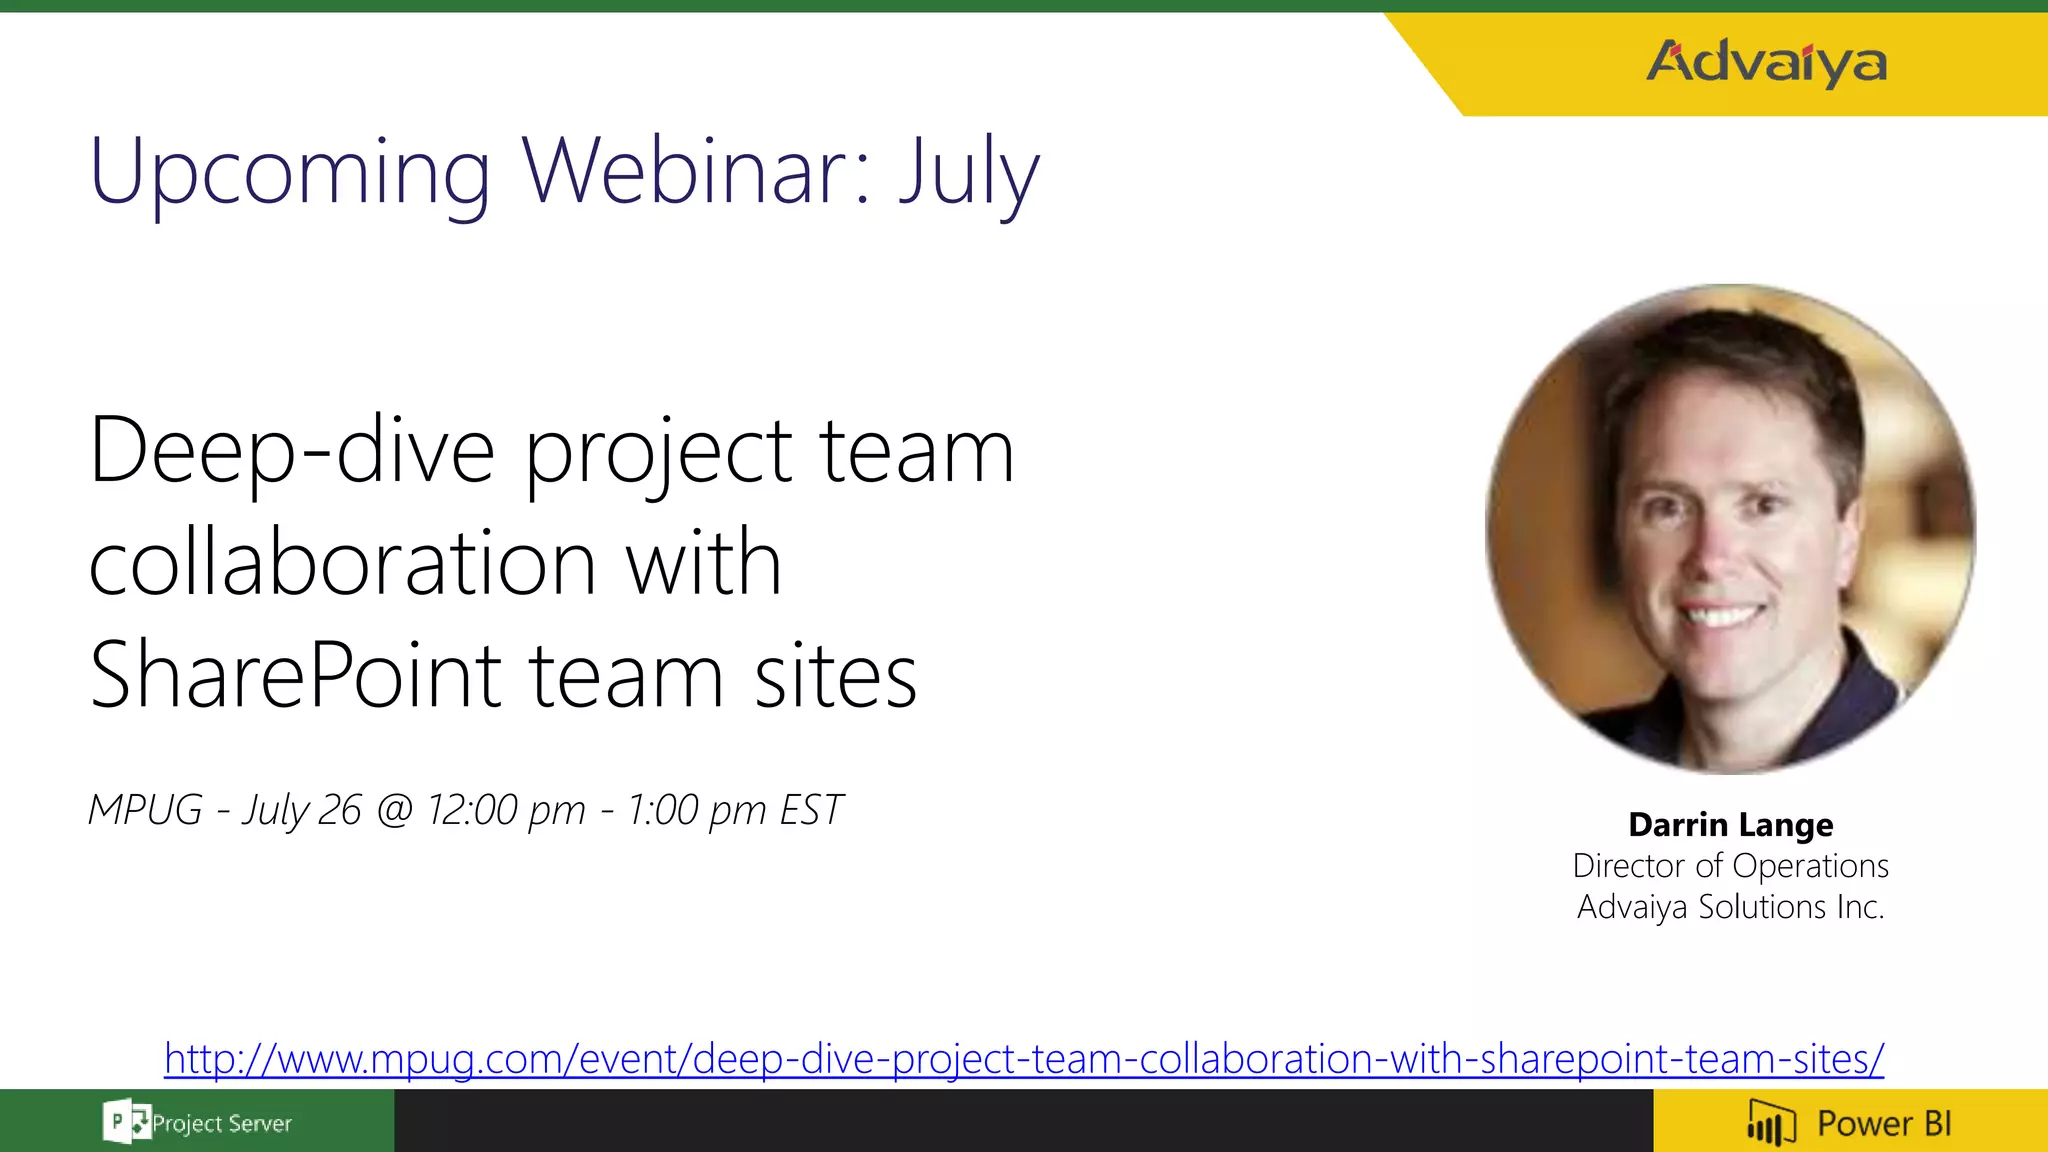
Announcement for the next webinar focusing on collaboration with SharePoint team sites.
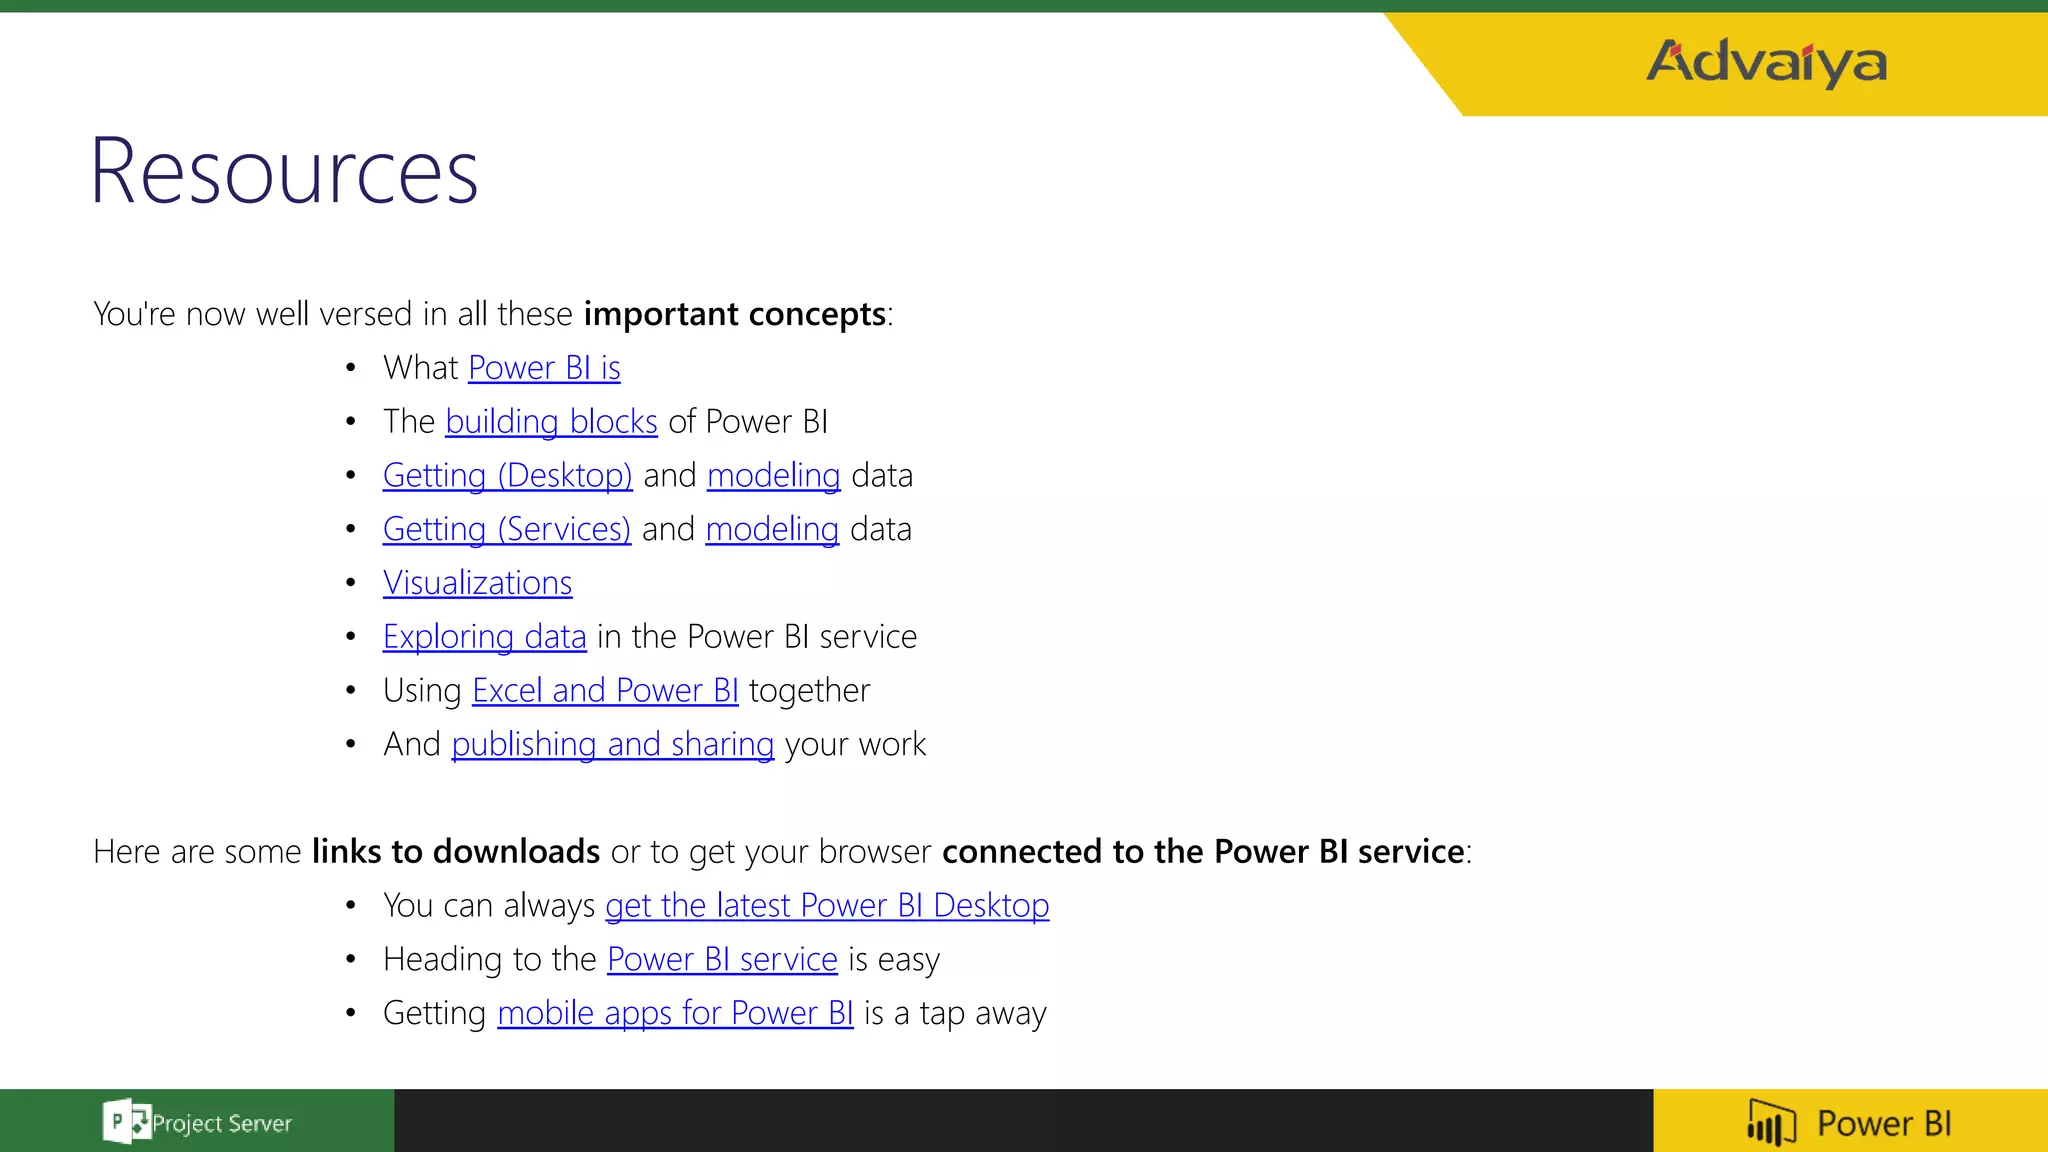
List of important resources and downloads related to Power BI and its applications.
Contact details for Advaiya Solutions and speaker for further inquiries.
Closing remarks and thanks to participants.