Downloaded 366 times

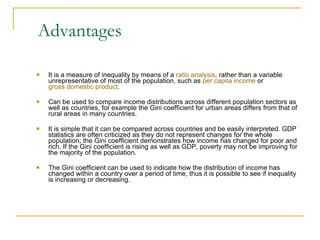
![Computing Big Mac Index The Big Mac PPP exchange rate between two countries is obtained by dividing the price of a Big Mac in one country (in its currency) by the price of a Big Mac in another country (in its currency). This value is then compared with the actual exchange rate; if it is lower, then the first currency is under-valued (according to PPP theory) compared with the second, and conversely, if it is higher, then the first currency is over-valued. For example, using figures in July 2008: the price of a Big Mac was $3.57 in the United States the price of a Big Mac was £2.29 in the United Kingdom (Britain) (Varies by region) the implied purchasing power parity was $1.56 to £1, that is $3.57/£2.29 = 1.56 this compares with an actual exchange rate of $2.00 to £1 at the time [(1.56-2.00)/2.00]*100= -22% the pound was thus overvalued against the dollar by 22%](https://image.slidesharecdn.com/povertyunderdevelopment-110905060121-phpapp01/85/Poverty-Underdevelopment-32-320.jpg)


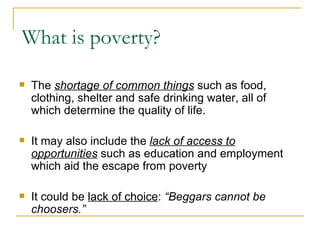
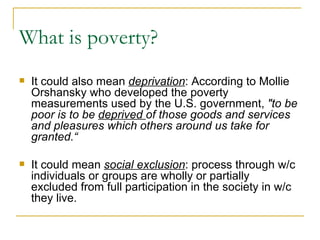
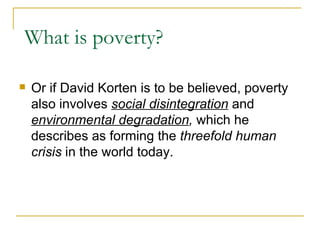
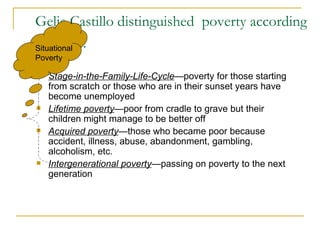
The document discusses various definitions and conceptualizations of poverty. It defines poverty as a lack of basic needs like food, shelter, and income, as well as a lack of access to opportunities and social inclusion. Poverty is multidimensional and can be defined and measured in both absolute and relative terms. The document also discusses causes, effects, and types of poverty.