Download to read offline


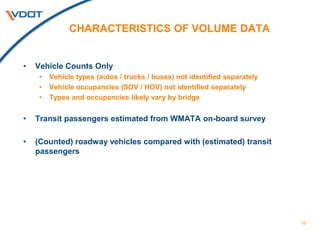

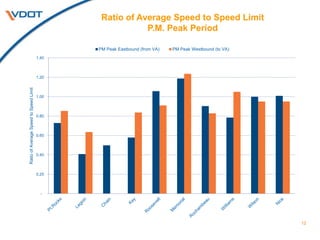


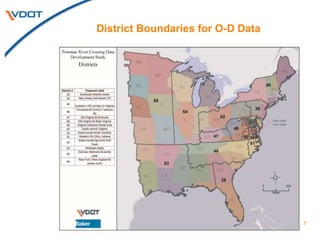


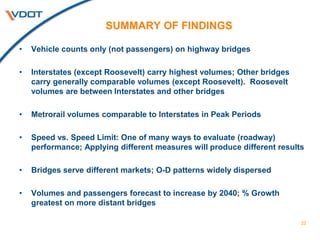

The document summarizes a study examining existing and future cross-river traffic between Virginia and Maryland across the Potomac River. It analyzed traffic volumes, speeds, and origin-destination patterns at multiple river crossings. Key findings include that interstate highways carry the highest traffic volumes currently, while rail volumes are comparable during peak periods. Speeds varied by crossing and time of day. Origin-destination data showed disbursed trip patterns across the region. Traffic and passenger volumes are forecasted to increase the most by 2040 at more distant crossings. The study developed a common set of data on crossings but did not make recommendations, only defining problems.


