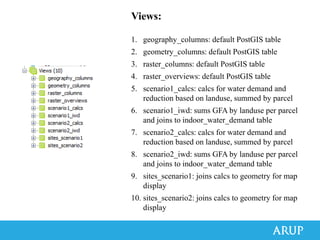
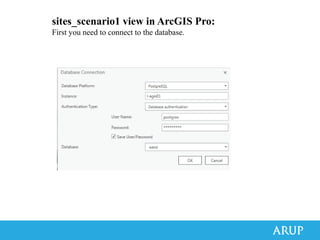
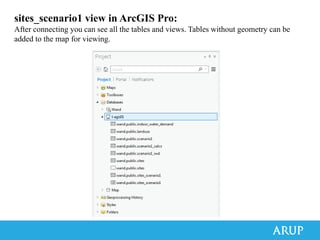
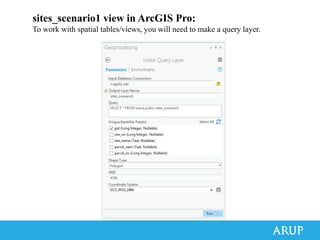
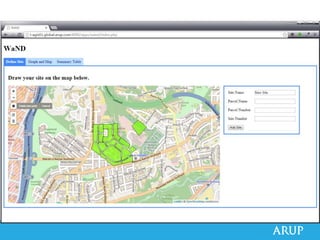
The magic of PostgreSQL view tables
What is the task?
Existing System
How can we improve?
WaND database:
Consists of 5 tables and 7 views.
The tables store the data related to the
site geography, site information, and
constants.
The views store the calculations
performed based on the data in the
tables.
Tables:
1. indoor_water_demand: constants for demands
and percent reduction based on landuse
2. landuse: landuse lookup table
3. scenarios: building and landscape data for
parcels; multiple entries per parcel are allowed
4. sites: parcel boundary and site information
(contains geography)
5. spatial_ref_sys: default PostGIS table
Sites versus Scenarios:
sites table:
User create this (first step) as geometry
scenarios table snippet:
User fills this out as tabular data (no geometry)
Views:
1. geography_columns: default PostGIS table
2. geometry_columns: default PostGIS table
3. raster_columns: default PostGIS table
4. raster_overviews: default PostGIS table
5. scenario1_calcs: calcs for water demand and
reduction based on landuse, summed by parcel
6. scenario1_iwd: sums GFA by landuse per parcel
and joins to indoor_water_demand table
7. scenario2_calcs: calcs for water demand and
reduction based on landuse, summed by parcel
8. scenario2_iwd: sums GFA by landuse per parcel
and joins to indoor_water_demand table
9. sites_scenario1: joins calcs to geometry for map
display
10. sites_scenario2: joins calcs to geometry for map
display
scenario1_calcs view snippet:
All this is run by the database automatically as sites and
scenario1 are updated
scenario1_calcs view create SQL snippet:
Here’s a bit of what the create SQL code looks like. It is
summing the calculations by parcel number (more on next
slide).
scenario1_calcs view create SQL snippet:
This shows the nested query (derived table) that calculates the water demand and
reductions that are then used in the monthly calcs. This format allows it to be
calculated once then reused by the monthly calcs (kind of like a variable).
scenario1_iwd view snippet:
All this is run by the database automatically as sites and scenario1
are updated.
scenario1_iwd view create SQL snippet:
This code joins the indoor water demand table to the user input scenario data
based on landuse. The GFA are summed for that landuse type within the parcel.
These numbers drive the scenario1_calcs view.
In GIS
sites_scenario1 view in QGIS:
Colors and data will automatically update as the user inputs additional buildings or
landscaping into the scenario1 table. Geometry will automatically update to match sites
table.
sites_scenario1 view in ArcGIS Pro:
First you need to connect to the database.
sites_scenario1 view in ArcGIS Pro:
After connecting you can see all the tables and views. Tables without geometry can be
added to the map for viewing.
sites_scenario1 view in ArcGIS Pro:
To work with spatial tables/views, you will need to make a query layer.
sites_scenario1 view in ArcGIS Pro:
Now we have a dynamic connection to our database.
sites_scenario1 view in ArcGIS Pro:
In order to keep the data refreshed, we’ll need to adjust the caching. This will auto-
update the data, but if any fields change, the query will need to be re-run.
With linked views in ArcGIS Pro, you can compare multiple scenarios side by side.
Shown below is annual business as usual water demand
Annual design reclaimed grey wastewater supply…
In the Browser
Twitter: @bondaharper
Email: bond.harper@arup.com

PostgreSQL GIS

  • 1.
    The magic ofPostgreSQL view tables
  • 2.
  • 5.
  • 8.
    How can weimprove?
  • 9.
    WaND database: Consists of5 tables and 7 views. The tables store the data related to the site geography, site information, and constants. The views store the calculations performed based on the data in the tables.
  • 10.
    Tables: 1. indoor_water_demand: constantsfor demands and percent reduction based on landuse 2. landuse: landuse lookup table 3. scenarios: building and landscape data for parcels; multiple entries per parcel are allowed 4. sites: parcel boundary and site information (contains geography) 5. spatial_ref_sys: default PostGIS table
  • 11.
  • 12.
    sites table: User createthis (first step) as geometry
  • 13.
    scenarios table snippet: Userfills this out as tabular data (no geometry)
  • 14.
    Views: 1. geography_columns: defaultPostGIS table 2. geometry_columns: default PostGIS table 3. raster_columns: default PostGIS table 4. raster_overviews: default PostGIS table 5. scenario1_calcs: calcs for water demand and reduction based on landuse, summed by parcel 6. scenario1_iwd: sums GFA by landuse per parcel and joins to indoor_water_demand table 7. scenario2_calcs: calcs for water demand and reduction based on landuse, summed by parcel 8. scenario2_iwd: sums GFA by landuse per parcel and joins to indoor_water_demand table 9. sites_scenario1: joins calcs to geometry for map display 10. sites_scenario2: joins calcs to geometry for map display
  • 15.
    scenario1_calcs view snippet: Allthis is run by the database automatically as sites and scenario1 are updated
  • 16.
    scenario1_calcs view createSQL snippet: Here’s a bit of what the create SQL code looks like. It is summing the calculations by parcel number (more on next slide).
  • 17.
    scenario1_calcs view createSQL snippet: This shows the nested query (derived table) that calculates the water demand and reductions that are then used in the monthly calcs. This format allows it to be calculated once then reused by the monthly calcs (kind of like a variable).
  • 18.
    scenario1_iwd view snippet: Allthis is run by the database automatically as sites and scenario1 are updated.
  • 19.
    scenario1_iwd view createSQL snippet: This code joins the indoor water demand table to the user input scenario data based on landuse. The GFA are summed for that landuse type within the parcel. These numbers drive the scenario1_calcs view.
  • 20.
  • 21.
    sites_scenario1 view inQGIS: Colors and data will automatically update as the user inputs additional buildings or landscaping into the scenario1 table. Geometry will automatically update to match sites table.
  • 22.
    sites_scenario1 view inArcGIS Pro: First you need to connect to the database.
  • 23.
    sites_scenario1 view inArcGIS Pro: After connecting you can see all the tables and views. Tables without geometry can be added to the map for viewing.
  • 24.
    sites_scenario1 view inArcGIS Pro: To work with spatial tables/views, you will need to make a query layer.
  • 25.
    sites_scenario1 view inArcGIS Pro: Now we have a dynamic connection to our database.
  • 26.
    sites_scenario1 view inArcGIS Pro: In order to keep the data refreshed, we’ll need to adjust the caching. This will auto- update the data, but if any fields change, the query will need to be re-run.
  • 27.
    With linked viewsin ArcGIS Pro, you can compare multiple scenarios side by side. Shown below is annual business as usual water demand
  • 28.
    Annual design reclaimedgrey wastewater supply…
  • 29.
  • 33.