1. CR = 85.7mm
CR = 316.6mm
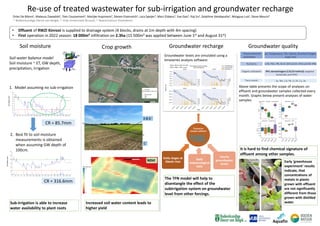
Re-use of treated wastewater for sub-irrigation and groundwater recharge
Crop growth
Soil moisture Groundwater recharge Groundwater quality
• Effluent of RWZI Kinrooi is supplied to drainage system (4 blocks, drains at 1m depth with 4m spacing)
• First operation in 2022 season: 18 000m³ infiltration on 2.3ha (15 500m³ was applied between June 1st and August 31st)
1. Model assuming no sub-irrigation
2. Best fit to soil moisture
measurements is obtained
when assuming GW depth of
100cm.
A & B
C
NDVI
Dries De Bièvre1, Mateusz Zawadzki2, Tom Coussement1, Marijke Huysmans2, Steven Eisenreich2, Lara Speijer2, Marc Elskens2, Yue Gao2, Yiqi Su2, Delphine Vandeputte2, Mingyue Luo2, Steve Meuris3
1: Bodemkundige Dienst van België, 2: Vrije Universiteit Brussel, 3: Boerennatuur Vlaanderen
Groundwater levels are simulated using a
timeseries analysis software:
The TFN model will help to
disentangle the effect of the
subirrigation system on groundwater
level from other forcings.
PB07A, PB06 A >300 m away
PB15A, PB16 A within the field
Timeseries
analysis software
Daily stages at
Abeek river
Daily
meteorological
data
Hourly
groundwater
levels
It is hard to find chemical signature of
effluent among other samples.
Early ‘greenhouse
experiment’ results
indicate, that
concentrations of
metals in plants
grown with effluent
are not significantly
different from those
grown with distilled
water.
Above table presents the scope of analyses on
effluent and groundwater samples collected every
month. Graphs below present analyses of water
samples.
Sub-irrigation is able to increase
water availability to plant roots
Increased soil water content leads to
higher yield
Soil-water balance model
Soil moisture ~ ET, GW depth,
precipitation, irrigation
0
10
20
30
40
50
60
70
80
90
100
1/4 11/4 21/4 1/5 11/5 21/5 31/5 10/6 20/6 30/6 10/7 20/7 30/7 9/8 19/8 29/8 8/9 18/9 28/9 8/10
soil
moisture
(mm)
0
20
40
60
80
100
120
1/4 11/4 21/4 1/5 11/5 21/5 31/5 10/6 20/6 30/6 10/7 20/7 30/7 9/8 19/8 29/8 8/9 18/9 28/9 8/10
soil
moisture
(mm)
Physicochemical
parameters
Nutrients
Organic pollutants
Trace metals
pH, Temperature, TDS, Salinity, Dissolved Oxygen,
major ions
C/N, POC, PN, δ13C (DIC),δ13C (POC),δ15N (PN)
PAH, xenoestrogens (CALUX method), targeted
herbicides and PFAS
Fe, Mn, Cd, Pb, Cr, Ni, Cu, As