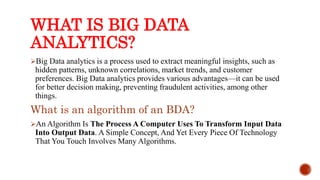
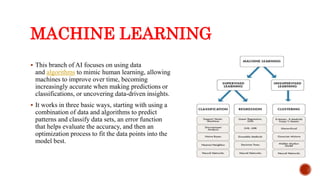
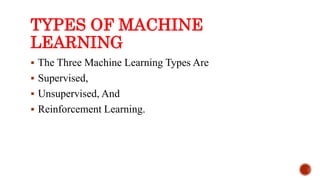
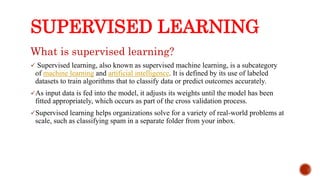
NADAR SARSWATHI COLLEGE OF ARTS AND SCIENCE
THENI
DEPARTMENT OF INFORMATION TECHNOLOGY
BIG DATA ANALYTICS
SUPERVISED LEARNING
PRESENTED BY:
G.KAVIYA
II. M.SC(IT)
SYNOPSIS
What Is Big Data Analytics?
Machine Learning.
Types Of Machine Learning.
Supervised Learning.
Types Of Supervised Learning.
Regression.
Classification.
WHAT IS BIG DATA
ANALYTICS?
Big Data analytics is a process used to extract meaningful insights, such as
hidden patterns, unknown correlations, market trends, and customer
preferences. Big Data analytics provides various advantages—it can be used
for better decision making, preventing fraudulent activities, among other
things.
What is an algorithm of an BDA?
An Algorithm Is The Process A Computer Uses To Transform Input Data
Into Output Data. A Simple Concept, And Yet Every Piece Of Technology
That You Touch Involves Many Algorithms.
MACHINE LEARNING
 This branch of AI focuses on using data
and algorithms to mimic human learning, allowing
machines to improve over time, becoming
increasingly accurate when making predictions or
classifications, or uncovering data-driven insights.
 It works in three basic ways, starting with using a
combination of data and algorithms to predict
patterns and classify data sets, an error function
that helps evaluate the accuracy, and then an
optimization process to fit the data points into the
model best.
TYPES OF MACHINE
LEARNING
 The Three Machine Learning Types Are
 Supervised,
 Unsupervised, And
 Reinforcement Learning.
SUPERVISED LEARNING
What is supervised learning?
 Supervised learning, also known as supervised machine learning, is a subcategory
of machine learning and artificial intelligence. It is defined by its use of labeled
datasets to train algorithms that to classify data or predict outcomes accurately.
As input data is fed into the model, it adjusts its weights until the model has been
fitted appropriately, which occurs as part of the cross validation process.
Supervised learning helps organizations solve for a variety of real-world problems at
scale, such as classifying spam in a separate folder from your inbox.
TYPES OF SUPERVISED
LEARNING
REGRESSION
Regression algorithms are used if there is a relationship between the input variable and the
output variable. It is used for the prediction of continuous variables, such as Weather forecasting,
Market Trends, etc.
Types of regression,
 Decision Tree Regression
 Principal Components Regression
 Polynomial Regression
 Random Forest Regression
 Simple Linear Regression
 Support Vector Regression
 Decision Tree Regression: The primary purpose of this regression is to divide the dataset into
smaller subsets. These subsets are created to plot the value of any data point connecting to the
problem statement.
 Principal Components Regression: This regression technique is widely used. There are many
independent variables, or multicollinearity exists in your data.
 Polynomial Regression: This type fits a non-linear equation by using the polynomial functions
of an independent variable.
 Random Forest Regression: Random forest regression is heavily used in Machine Learning. It
uses multiple decision trees to predict the output. Random data points are chosen from the
given dataset and used to build a decision tree via this algorithm.
 Simple Linear Regression: This type is the least complicated form of regression, where the
dependent variable is continuous.
 Support Vector Regression: This regression type solves both linear and non-linear models. It
uses non-linear kernel functions, like polynomials, to find an optimal solution for non-linear
models.
CLASSIFICATION
 On the other hand, Classification is an algorithm that finds functions that help divide the
dataset into classes based on various parameters. When using a Classification algorithm, a
computer program gets taught on the training dataset and categorizes the data into various
categories depending on what it learned.
 Classification algorithms find the mapping function to map the “x” input to “y” discrete output.
The algorithms estimate discrete values (in other words, binary values such as 0 and 1, yes and
no, true or false, based on a particular set of independent variables. To put it another, more
straightforward way, classification algorithms predict an event occurrence probability by fitting
data to a logit function.
 Classification algorithms are used for things like email and spam classification, predicting the
willingness of bank customers to pay their loans, and identifying cancer tumor cells.
Types of Classification,
 Decision Tree Classification
 K-Nearest Neighbors
 Logistic Regression
 Naïve Bayes
 Random Forest Classification
 Support Vector Machines
 Decision Tree Classification: This type divides a dataset into segments based on particular
feature variables. The divisions’ threshold values are typically the mean or mode of the feature
variable in question if they happen to be numerical.
 K-Nearest Neighbors: This Classification type identifies the K nearest neighbors to a given
observation point. It then uses K points to evaluate the proportions of each type of target
variable and predicts the target variable that has the highest ratio.
 Logistic Regression: This classification type isn't complex so it can be easily adopted with
minimal training. It predicts the probability of Y being associated with the X input variable.
 Naïve Bayes: This classifier is one of the most effective yet simplest algorithms. It’s based on
Bayes’ theorem, which describes how event probability is evaluated based on the previous
knowledge of conditions that could be related to the event.
 Random Forest Classification: Random forest processes many decision trees, each one
predicting a value for target variable probability. You then arrive at the final output by
averaging the probabilities.
 Support Vector Machines: This algorithm employs support vector classifiers with an exciting
change, making it ideal for evaluating non-linear decision boundaries. This process is possible
by enlarging feature variable space by employing special functions known as kernels.
Big Data Analytics.pptx

Big Data Analytics.pptx

  • 1.
    NADAR SARSWATHI COLLEGEOF ARTS AND SCIENCE THENI DEPARTMENT OF INFORMATION TECHNOLOGY BIG DATA ANALYTICS SUPERVISED LEARNING PRESENTED BY: G.KAVIYA II. M.SC(IT)
  • 2.
    SYNOPSIS What Is BigData Analytics? Machine Learning. Types Of Machine Learning. Supervised Learning. Types Of Supervised Learning. Regression. Classification.
  • 3.
    WHAT IS BIGDATA ANALYTICS? Big Data analytics is a process used to extract meaningful insights, such as hidden patterns, unknown correlations, market trends, and customer preferences. Big Data analytics provides various advantages—it can be used for better decision making, preventing fraudulent activities, among other things. What is an algorithm of an BDA? An Algorithm Is The Process A Computer Uses To Transform Input Data Into Output Data. A Simple Concept, And Yet Every Piece Of Technology That You Touch Involves Many Algorithms.
  • 4.
    MACHINE LEARNING  Thisbranch of AI focuses on using data and algorithms to mimic human learning, allowing machines to improve over time, becoming increasingly accurate when making predictions or classifications, or uncovering data-driven insights.  It works in three basic ways, starting with using a combination of data and algorithms to predict patterns and classify data sets, an error function that helps evaluate the accuracy, and then an optimization process to fit the data points into the model best.
  • 5.
    TYPES OF MACHINE LEARNING The Three Machine Learning Types Are  Supervised,  Unsupervised, And  Reinforcement Learning.
  • 6.
    SUPERVISED LEARNING What issupervised learning?  Supervised learning, also known as supervised machine learning, is a subcategory of machine learning and artificial intelligence. It is defined by its use of labeled datasets to train algorithms that to classify data or predict outcomes accurately. As input data is fed into the model, it adjusts its weights until the model has been fitted appropriately, which occurs as part of the cross validation process. Supervised learning helps organizations solve for a variety of real-world problems at scale, such as classifying spam in a separate folder from your inbox.
  • 7.
  • 8.
    REGRESSION Regression algorithms areused if there is a relationship between the input variable and the output variable. It is used for the prediction of continuous variables, such as Weather forecasting, Market Trends, etc. Types of regression,  Decision Tree Regression  Principal Components Regression  Polynomial Regression  Random Forest Regression  Simple Linear Regression  Support Vector Regression
  • 9.
     Decision TreeRegression: The primary purpose of this regression is to divide the dataset into smaller subsets. These subsets are created to plot the value of any data point connecting to the problem statement.  Principal Components Regression: This regression technique is widely used. There are many independent variables, or multicollinearity exists in your data.  Polynomial Regression: This type fits a non-linear equation by using the polynomial functions of an independent variable.  Random Forest Regression: Random forest regression is heavily used in Machine Learning. It uses multiple decision trees to predict the output. Random data points are chosen from the given dataset and used to build a decision tree via this algorithm.  Simple Linear Regression: This type is the least complicated form of regression, where the dependent variable is continuous.  Support Vector Regression: This regression type solves both linear and non-linear models. It uses non-linear kernel functions, like polynomials, to find an optimal solution for non-linear models.
  • 10.
    CLASSIFICATION  On theother hand, Classification is an algorithm that finds functions that help divide the dataset into classes based on various parameters. When using a Classification algorithm, a computer program gets taught on the training dataset and categorizes the data into various categories depending on what it learned.  Classification algorithms find the mapping function to map the “x” input to “y” discrete output. The algorithms estimate discrete values (in other words, binary values such as 0 and 1, yes and no, true or false, based on a particular set of independent variables. To put it another, more straightforward way, classification algorithms predict an event occurrence probability by fitting data to a logit function.  Classification algorithms are used for things like email and spam classification, predicting the willingness of bank customers to pay their loans, and identifying cancer tumor cells.
  • 11.
    Types of Classification, Decision Tree Classification  K-Nearest Neighbors  Logistic Regression  Naïve Bayes  Random Forest Classification  Support Vector Machines
  • 12.
     Decision TreeClassification: This type divides a dataset into segments based on particular feature variables. The divisions’ threshold values are typically the mean or mode of the feature variable in question if they happen to be numerical.  K-Nearest Neighbors: This Classification type identifies the K nearest neighbors to a given observation point. It then uses K points to evaluate the proportions of each type of target variable and predicts the target variable that has the highest ratio.  Logistic Regression: This classification type isn't complex so it can be easily adopted with minimal training. It predicts the probability of Y being associated with the X input variable.  Naïve Bayes: This classifier is one of the most effective yet simplest algorithms. It’s based on Bayes’ theorem, which describes how event probability is evaluated based on the previous knowledge of conditions that could be related to the event.  Random Forest Classification: Random forest processes many decision trees, each one predicting a value for target variable probability. You then arrive at the final output by averaging the probabilities.  Support Vector Machines: This algorithm employs support vector classifiers with an exciting change, making it ideal for evaluating non-linear decision boundaries. This process is possible by enlarging feature variable space by employing special functions known as kernels.