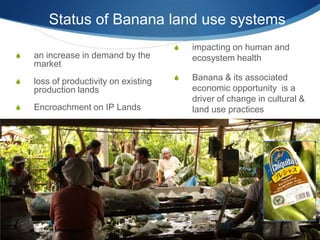
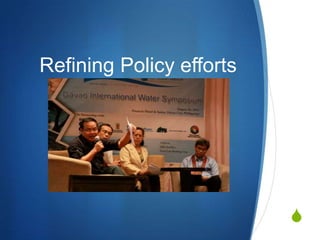
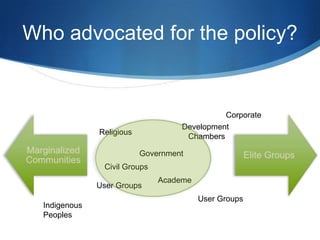
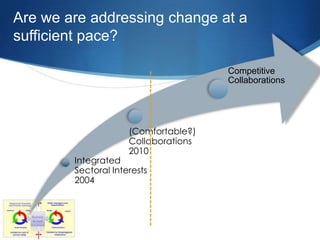
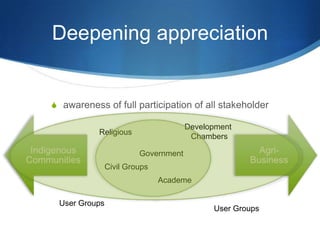
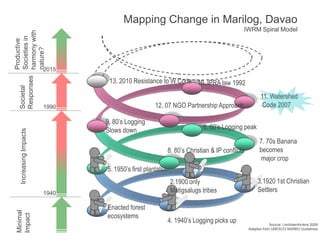
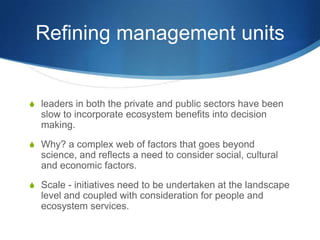
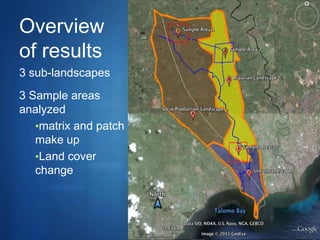
A review of Policy impacts
         in the upper watersheds of Davao, Philippines


Declan Hearne | Strengthening Governance and Institutions


                                                       S
Policy* a statement of intent


S Policy -> Action -> desired impacts

S But who is measuring?

S Are there unexpected outcomes?

S If we are not measuring, how can we adapt?
Overview


S Watershed Code

S Rapid review
  S Power structures governing the uplands
  S Impacts on two user groups
  S Refining policy's and actions
Watershed Code


S   In 2006, the HELP Davao Network developed a draft IWRM framework

S   Watershed Management Codewas enacted by the City Council in 2007 - lays down
    the provisions for protection, conservation, and management of the watersheds.

S   The code regulates the use of 34,000 hectares of watershed areas that are
    classified into conservation areas, agro-forestry non-tillage areas and prime
    agricultural lands. Infrastructural development and mono-crop plantations are
    banned in the first two of these categories.

S   a shift from narrow issues based policy to recognition of the need for more holistic
    and integrated approaches for the management of water resources.

S   4 years on - Risk that the Code has has alienated two sets of major land users
Methods
               A rapid assessment of policy impacts


S Review of secondary data (maps, bio, physical and
  social)

S Conduct of rapid field assessments and community
  interviews

S Conduct of review of decision making tools to guide more
  effective actions and reinforce the intended policy
  impacts
Marilog
Findings


           S
atus of Indigenous People’s
P’s) land use systems


              84% >4$ day
Status of Banana land use systems
                                       S   impacting on human and
S   an increase in demand by the           ecosystem health
    market
S   loss of productivity on existing   S   Banana & its associated
    production lands                       economic opportunity is a
                                           driver of change in cultural &
S   Encroachment on IP Lands               land use practices
Impacts

           Banana                          IP’s


S Resistance to formation of   S Unsure of requirement
  the WMC
                                 has lead to resistance.
S Outsourcing of production
                               S Fear of loss is costly.
S Organizing marginalised
  famers                         ‘loss aversion’

S Scoping lands outside the
  region
                    …Costs of non participation?
Both impacted


S Yet both are valued by society.

S The challenge: how to guide the evolution of landscape
  management practices to reap some of the economic
  rewards seen in agri-business production models but still
  retain desirable levels of cultural and ecological integrity
  across the region.
Refining Policy efforts


                          S
Recommendations
Deeper appreciation of stakeholders

               governance systems

             Decision support tools


                                      S
Who advocated for the policy?


                                              Corporate
                                    Development
               Religious
                                     Chambers

                           Government
                Civil Groups
                               Academe
               User Groups
                                         User Groups
  Indigenous
  Peoples
Are we are addressing change at a
sufficient pace?

                                      Competitive
                                      Collaborations


                     (Comfortable?)
                     Collaborations
                     2010
        Integrated
        Sectoral Interests
        2004
Deepening appreciation


S awareness of full participation of all stakeholder

                                     Development
           Religious
                                      Chambers

                        Government
               Civil Groups
                              Academe

 User Groups
                                           User Groups
Plural governance systems


S formal law has the highest legal authority that guides and
  controls management of natural resources, however…

S failure to consider traditional systems can result in costly
  barriers to implementation.
The value of working with local traditions
                  and culture


    Recognizing                           Conceptualizing … to
                                             Implementing
S    Recognized and reinforce the
                                      S     Put aside planned ‘solutions’
     multi layered power structures
                                            and embrace a real
                                            partnerships to achieve real
S    Customary Knowledge is                 user-driven outcomes
     adaptive.
Decision support tools


                         S
Mapping Change in Marilog, Davao
Responses harmony with                                                                  IWRM Spiral Model
          Societies in
          Productive


          nature?


                         2015

                                 13. 2010 Resistance to W Code 10. IPRA law 1992
Societal


                                                                                                   11. Watershed
                         1990                       12. 07 NGO Partnership Approach                 Code 2007

                                9. 80’s Logging
                                Slows down                               6. 60’s Logging peak
    Increasing Impacts


                                                                                                  7. 70s Banana
                                                         8. 80’s Christian & IP conflicts         becomes
                                                                                                  major crop
                                5. 1950’s first plantation
                                                             2.1900 only                         3.1920 1st Christian
                         1940                                Matigsalugs tribes                  Settlers

                                Enacted forest
 Minimal


                                ecosystems
 Impact


                                                         4. 1940’s Logging picks up                     Source: LincklaenArriens 2009
                                                                                            Adapted from UNESCO-NARBO Guidelines
Refining management units


S leaders in both the private and public sectors have been
  slow to incorporate ecosystem benefits into decision
  making.
S Why? a complex web of factors that goes beyond
  science, and reflects a need to consider social, cultural
  and economic factors.
S Scale - initiatives need to be undertaken at the landscape
  level and coupled with consideration for people and
  ecosystem services.
Ecological Value: High
 Economic Value: Medium
                                     Mixed Agro Forestry Zone
                                     Low input, high water dependence


                    Backyard Food Production
                    High input, high water dependence


Ecological Value: Medium
Economic Value: Medium


           Ecological Value: Low                          Sloping Agri Cropping Zone
           Economic Value: Low                            High input, high water dependence, Soil erosion
                                                          high


                                   Agro Forestry subsistence landscapes, Davao, Philippines. ©
                                                                          Photo: Declan Hearne, HELP Davao
Defining
landscapes


              S
SA2: Riparian
landscape


  Open Canopy

  Grassland

  Built Up Areas

  Matrix TP


                   S
Overview
of results
3 sub-landscapes
3 Sample areas
analyzed
   •matrix and patch
   make up
   •Land cover
   change


                       S
In summary
      Critical for involvement of a full
            spectrum of stakeholders

          Invest time to aligning with
              customary approaches

Localization of decision support tools


                                           S

Policy Impacts in Davao Watersheds

  • 1.
    A review ofPolicy impacts in the upper watersheds of Davao, Philippines Declan Hearne | Strengthening Governance and Institutions S
  • 2.
    Policy* a statementof intent S Policy -> Action -> desired impacts S But who is measuring? S Are there unexpected outcomes? S If we are not measuring, how can we adapt?
  • 3.
    Overview S Watershed Code SRapid review S Power structures governing the uplands S Impacts on two user groups S Refining policy's and actions
  • 4.
    Watershed Code S In 2006, the HELP Davao Network developed a draft IWRM framework S Watershed Management Codewas enacted by the City Council in 2007 - lays down the provisions for protection, conservation, and management of the watersheds. S The code regulates the use of 34,000 hectares of watershed areas that are classified into conservation areas, agro-forestry non-tillage areas and prime agricultural lands. Infrastructural development and mono-crop plantations are banned in the first two of these categories. S a shift from narrow issues based policy to recognition of the need for more holistic and integrated approaches for the management of water resources. S 4 years on - Risk that the Code has has alienated two sets of major land users
  • 5.
    Methods A rapid assessment of policy impacts S Review of secondary data (maps, bio, physical and social) S Conduct of rapid field assessments and community interviews S Conduct of review of decision making tools to guide more effective actions and reinforce the intended policy impacts
  • 6.
  • 7.
  • 8.
    atus of IndigenousPeople’s P’s) land use systems 84% >4$ day
  • 9.
    Status of Bananaland use systems S impacting on human and S an increase in demand by the ecosystem health market S loss of productivity on existing S Banana & its associated production lands economic opportunity is a driver of change in cultural & S Encroachment on IP Lands land use practices
  • 10.
    Impacts Banana IP’s S Resistance to formation of S Unsure of requirement the WMC has lead to resistance. S Outsourcing of production S Fear of loss is costly. S Organizing marginalised famers ‘loss aversion’ S Scoping lands outside the region …Costs of non participation?
  • 11.
    Both impacted S Yetboth are valued by society. S The challenge: how to guide the evolution of landscape management practices to reap some of the economic rewards seen in agri-business production models but still retain desirable levels of cultural and ecological integrity across the region.
  • 12.
  • 13.
    Recommendations Deeper appreciation ofstakeholders governance systems Decision support tools S
  • 14.
    Who advocated forthe policy? Corporate Development Religious Chambers Government Civil Groups Academe User Groups User Groups Indigenous Peoples
  • 15.
    Are we areaddressing change at a sufficient pace? Competitive Collaborations (Comfortable?) Collaborations 2010 Integrated Sectoral Interests 2004
  • 16.
    Deepening appreciation S awarenessof full participation of all stakeholder Development Religious Chambers Government Civil Groups Academe User Groups User Groups
  • 17.
    Plural governance systems Sformal law has the highest legal authority that guides and controls management of natural resources, however… S failure to consider traditional systems can result in costly barriers to implementation.
  • 18.
    The value ofworking with local traditions and culture Recognizing Conceptualizing … to Implementing S Recognized and reinforce the S Put aside planned ‘solutions’ multi layered power structures and embrace a real partnerships to achieve real S Customary Knowledge is user-driven outcomes adaptive.
  • 19.
  • 20.
    Mapping Change inMarilog, Davao Responses harmony with IWRM Spiral Model Societies in Productive nature? 2015 13. 2010 Resistance to W Code 10. IPRA law 1992 Societal 11. Watershed 1990 12. 07 NGO Partnership Approach Code 2007 9. 80’s Logging Slows down 6. 60’s Logging peak Increasing Impacts 7. 70s Banana 8. 80’s Christian & IP conflicts becomes major crop 5. 1950’s first plantation 2.1900 only 3.1920 1st Christian 1940 Matigsalugs tribes Settlers Enacted forest Minimal ecosystems Impact 4. 1940’s Logging picks up Source: LincklaenArriens 2009 Adapted from UNESCO-NARBO Guidelines
  • 21.
    Refining management units Sleaders in both the private and public sectors have been slow to incorporate ecosystem benefits into decision making. S Why? a complex web of factors that goes beyond science, and reflects a need to consider social, cultural and economic factors. S Scale - initiatives need to be undertaken at the landscape level and coupled with consideration for people and ecosystem services.
  • 22.
    Ecological Value: High Economic Value: Medium Mixed Agro Forestry Zone Low input, high water dependence Backyard Food Production High input, high water dependence Ecological Value: Medium Economic Value: Medium Ecological Value: Low Sloping Agri Cropping Zone Economic Value: Low High input, high water dependence, Soil erosion high Agro Forestry subsistence landscapes, Davao, Philippines. © Photo: Declan Hearne, HELP Davao
  • 23.
  • 24.
    SA2: Riparian landscape Open Canopy Grassland Built Up Areas Matrix TP S
  • 25.
    Overview of results 3 sub-landscapes 3Sample areas analyzed •matrix and patch make up •Land cover change S
  • 26.
    In summary Critical for involvement of a full spectrum of stakeholders Invest time to aligning with customary approaches Localization of decision support tools S

Editor's Notes

  • #6 Methods adopted in the study. we started with a review of existing data. However since it is poorly studied catchment there was very little characterization data available. CLUP and Geo hazards maps were reviewed. We then had the opportunity to conduct field study with 60 local and International participants. The study tour looked at downstream impacts on urban communities and impacts on the vegetation in the stream channels. After which we visited upstream area to gain perspectives of the state of land cover and to explore possible reasons for the devastating flood last June 28th.
  • #7 Location of the Matina River Basin. Noted its in Southern Philippines and within the boundaries of Davao City. It is a very small catchment of approx 81 sq km.
  • #9 Deforestation since 1930 Deforested by 80s. Now heavily degraded ecosystems – impacting on human health and wellbeing.Subsistence farming and agro forestry. Perception both internally and downtown believe that the practices are neither productive or sustainable. 84% of families on less than 4 dollars a day. Their resilience to shocks be it climate change or land conflicts is low.
  • #10 Opportunities for change: Market driven approaches must be considered where capacity to enforce laws is low.
  • #11 To Value or at least enumerate the cost of not effectively engaging the end users Resulting negative outcomes stem from poor attention procedure and lack of understanding of the target audience.
  • #16 Sometime we are happy with our small achievements, and we should, but we should also build on our achievements!We need partnerships that can monitor, report, absorb and respond to learning from the field. With a rigorous attention to results.
  • #19 Recognizing; Perceptions indicate that local knowledge is static- how through partnership KFI observes the local leader draft new policy to better guide their community in the face of economic and social changes
  • #24 In this and the next few slides we look at how I delineated the landscapes. I started with the 2002 city land cover map. This shoed only to landscape types in the matina river basin - urban built up areas and Tree Plantation.
  • #25 Riparian Landscape. Saw the large loses in open forest cover (-6.6%) and this was supplanted by built up areas. This sample are probably has the greatest Patch density, though this was not measured only observed.
  • #26 Results summary. I delineated 3 landscapes based on land cover reviews, hazards maps and socio, production and ecological uses. We then identified 3 sample area for more detailed assessment. Originally the sample no. 3 was targeted to be in the urban landscape but cloud cover in the Google earth image inhibited finding a good sample site. So we shift sample area number 3 back into the lower portion of the riparian landscape.