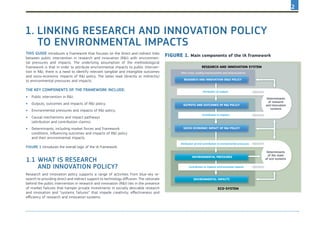
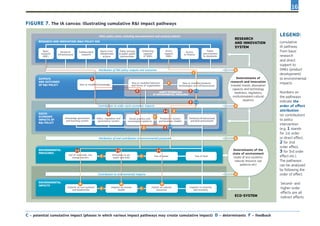
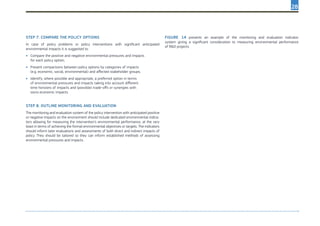
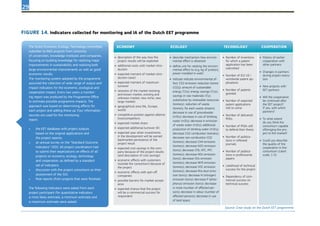
SlideShare a Scribd company logo
1 of 42
Download to read offline
Assessing
environmental
impacts
of Research
and Innovation
Policy
Research and
Innovation
Brussels, November 2013
Framework Service Contract Nr 150176-2005-F1SC-BE
Edited by:
Michal Miedzinski, Technopolis Group (TG)
Authors:
Rebecca Allinson, TG
Erik Arnold, TG
Jennifer Cassingena Harper, Malta Council for Science and Technology
Asel Doranova, TG
Stefan Giljum, Sustainable Europe Research Institute
Elina Griniece, TG
Klaus Kubeczko, Austrian Institute of Technology
Bea Mahieu, TG
Anil Markandya, Basque Centre for Climate Research
Michal Miedzinski, TG
Viola Peter, TG
Mathias Ploeg, TG
Agnieszka Stasiakowska, TG
Geert van der Veen, TG
Please cite this study as: Miedzinski et al (2013). Assessing Environmental Impacts of Research and Innovation Policy.
Study for the European Commission, Directorate-General for Research and Innovation, Brussels.
A short guide to assessing
environmental impacts
of research and innovation policy
Disclaimer:
The content of this publication does not reflect the official opinion of the European Union.
Responsibility for the information and views expressed in the public lies entirely with the authors.
Reproduction is authorised provided the source is acknowledged.
© European Union, 2013
I
Table of Contents
1.	 Linking research and innovation policy to environmental impacts........................................... 2
1.1	What is research and innovation policy?................................................................................................................................................................... 2
1.1.1	 Effects of R&I policy............................................................................................................................................................................................... 3
1.1.2	 Determinants of impacts of R&I policy......................................................................................................................................................... 4
1.2	What are environmental pressures and impacts?................................................................................................................................................5
1.2.1	 Introducing environmental pressures and impacts.................................................................................................................................5
1.2.2	 Measuring environmental pressures and impacts...................................................................................................................................8
1.3	How to connect R&I policy effects to environmental pressures and impacts?...................................................................................... 10
1.3.1	 Qualitative impact pathways.......................................................................................................................................................................... 10
1.3.2	 Constructing methodologies and selecting methods of IA................................................................................................................ 17
2.	ENvironmental dimension in the analytical steps of impact assessment..........................21
2.3.1	 Ex-ante impact assessments.......................................................................................................................................................................... 24
2.3.2	 Ex-post impact assessments.......................................................................................................................................................................... 30
General messages.....................................................................................................................................................................33
REFERENCES......................................................................................................................................................................................35
II
FIGURE 1. Main components of the IA framework.......................2
FIGURE 2. Main environmental impact categories.......................7
FIGURE 3. Main indicators of environmental pressures...............8
FIGURE 4. Main indicators of environmental impacts................9
FIGURE 5. The IA canvas: extended visualisation
of the IA framework.................................................................................12
FIGURE 6. The IA canvas: two examples
of instrument-level impact pathways...................................14 – 15
FIGURE 7. Using IA canvas for illustrating
cumulative R&I impact pathways......................................................16
FIGURE 8. Linking R&I policy effects and
environmental assessment methods........................................ 18-20
FIGURE 9. Impact asessment cycle.................................................... 21
FIGURE 10. Environmental dimension
of the impact assessment cycle...........................................................23
FIGURE 11. Policy intervention and levels of IA..........................24
FIGURE 12. Methodology of impact assessment
applied by the Green Investment Bank (GIB), UK..........................25
FIGURE 13. Assessment criteria used
in (ex-ante) IA using RIAM method......................................................27
FIGURE 14. Indicators collected for monitoring
and IA of the Dutch EET programme..................................................29
FIGURE 15. “Technology tracking” system of the AMO..............32
Table of FIGURES
III
1
Impact assessment (IA) is a routine practice at the European Commission. In its
Impact Assessment Guidelines (EC 2009), the Commission calls for an integrated ap-
proach taking into account various dimensions of impacts, notably economic, social and
environmental implications of planned public interventions. This publication responds to
the need to better account for environmental impacts in assessing research and inno-
vation policy. The guidebook complements the official EC guidelines by focusing on the
specific challenges and methodological issues of accounting for environmental impacts
in IA. The publication extends the scope of the guidelines by considering both ex-ante
and ex-post assessments.
The publication is addressed primarily to the EC officials and IA practitioners involved
in the EC impact assessments of research and innovation policy. The overall approach pro-
posed in the guidebook may be of interest also for national, regional or even local govern-
ments and practitioners conducting integrated IAs of R&I policies.
The guidebook tackles the difficult task of combining various traditions of research
and different approaches to IA. The framework connects methods known and used in so-
cial science research with evidence and approaches of the natural and concrete sciences.
This suggests that the IAs should be not only integrated but trans-disciplinary efforts
bringing diverse expertise around the table. This publication should be seen as a modest
step in establishing coherent IA framework making use of best available knowledge and
evidence from all relevant disciplines.
The guide provides an original framework and methodological advice on how to iden-
tify, scope and assess the environmental pressures and impacts of research and innova-
tion policy. The central assumption in the overall framework is that any integrated assess-
ment seeking to identify and measure environmental impacts of R&I need to be based on
a robust understanding of the socio-economic effects of public intervention. Without
evidence on how fast innovative products diffuse in society and how they are used, for
example, we cannot estimate their environmental impact. The central element of the
guide is the notion of impact pathways allowing for the scoping of challenging IA assign-
ments in which the link to the environment may seem remote at first sight. The publica-
tion features an innovative IA tool – the IA canvas – used to visualise impact pathways.
The publication offers guidance on the following questions:
•	 	How to identify, scope and assess impacts of R&I policy relevant
to the environment;
•	 	How to account for environmental impacts in the analytical steps of ex-ante
and ex-post IA;
•	 	How to identify and measure environmental pressures and impacts of R&I:
−	 	How to establish impact pathways between R&I policy and environmental
impacts;	
−	 How to identify and assess external determinants of impacts;
−	 How to classify and measure environmental pressures and impacts,
including examples of methodologies and methods, indicators and
sources of data.
The guidebook comprises two main sections:
•	 Section I “Linking research and innovation policy environmental impacts”
introduces an overall IA methodological approach to identify, scope and attribute
environmental impacts to research and innovation policy. It also presents a short
review of methodologies and metrics that can be used in IA practice to measure
the environment-related outcomes and impacts of R&I policy.
•	 Section II “Environmental dimension in the analytical steps of Impact Assess-
ment” introduces the step-wise approach to IA and highlights main environmental
questions in the analytical steps of ex-ante and ex-post IA.
The publication is a digest of a more extensive IA guidebook
featuring detailed methodological material, practical examples of IA methods and
further reading sections on various aspects of assessing environmental impacts of
research and innovation policy. The full version of the guidebook can be downloaded
from http://europa.eu/!Xm84ND.
About this guide
2
This guide introduces a framework that focuses on the direct and indirect links
between public intervention in research and innovation (R&I) with environmen-
tal pressures and impacts. The underlying assumption of the methodological
framework is that in order to attribute environmental impacts to public interven-
tion in R&I, there is a need to identify relevant tangible and intangible outcomes
and socio-economic impacts of R&I policy. The latter lead (directly or indirectly)
to environmental pressures and impacts.
The key components of the framework include:
•	 Public intervention in R&I;
•	 Outputs, outcomes and impacts of R&I policy;
•	 Environmental pressures and impacts of R&I policy;
•	 Causal mechanisms and impact pathways
(attribution and contribution claims);
•	 Determinants, including market forces and framework
conditions, influencing outcomes and impacts of R&I policy
and their environmental impacts.
Figure 1 introduces the overall logic of the IA framework.
1.1	What is research
and innovation policy?
Research and innovation policy supports a range of activities from blue-sky re-
search to providing direct and indirect support to technology diffusion. The rationale
behind the public intervention in research and innovation (R&I) lies in the presence
of market failures that hamper private investments in socially desirable research
and innovation and “systems failures” that impede creativity, effectiveness and
efficiency of research and innovation systems.
1.	Linking research and innovation policy
to environmental impacts
RESEARCH AND INNOVATION SYSTEM
ECO SYSTEM
Other areas, icluding macroeconomic and sectoral policies
ENVIRONMENTAL IMPACTS
OUTPUTS AND OUTCOMES OF R&I POLICY
SOCIO ECONOMIC IMPACT OF R&I POLICY
Contribution to impacts environmental impacts
Determinants
of the state
of eco-systems
Attribution of outputs
Contribution to impacts
Attribution of and contribution to environmental pressures
Determinants
of research
and innovation
systems
RESEARCH AND INNOVATION R&I POLICY
ENVIRONMENTAL PRESSURES
FIGURE 1. Main components of the IA framework
3
The limited consideration of the environment in R&I or the negative environmental
impacts of R&I are examples of both market and systems failures. The rationale
of a sustainable R&I policy incorporates the dimension of economic, social and
environmental impacts. In response to failures, the policy strives to ensure that its
outcomes and impacts contribute to or at the very least do not impede the long-
term sustainability. Environmental impacts are not considered “external” but are
either addressed as a problem or are purposefully avoided.
The need for public support of R&I also derives from the system nature of innova-
tion. The system model emphasises that the performance of the economy depends
also on the linkages and flows of information and knowledge between the differ-
ent actors in the innovation system. The different parts of the system are in many
respects interdependent, hence the poor performance of any one component puts
the performance of the system as a whole at risk. For instance, market take-up of
new mobility schemes, like car sharing, is of a systemic nature and will not happen
if they are not addressed in relation to availability public transport infrastructure
and city planning (e.g. changes in parking facilities and fees). The public sector
often has to take the lead in addressing such “bottlenecks” – continuously identi-
fying and rectifying structural imperfections by supporting coordination of effort,
promoting division of labour and agenda-setting, investing in human capital and
networks to ensure the absorption of knowledge.
1.1.1	 Effects of R&I policy
From inputs to impacts
Measuring impacts of policy intervention is performed in order to establish whether and
to what extent the intervention is contributing to the specific and overall objectives set
out by policy makers. In order to draw lessons for better policy design, evaluation and
impact, assessment should cover both intended and unintended outcomes and impacts
of policies.
In terms of effects of a policy intervention, IA studies differentiate between different ef-
fects that range from short-term outputs, being direct “products” of an intervention, to
wider impacts on societies, economies and environment. While outputs can be directly
attributed to policy intervention, impacts are longer-term and indirect effects of poli-
cies. Impacts are often studied at the level of entire economies and societies in which
policies are but one of driving forces. Any IA study has to introduce a dimension of in-
put: that is, of what has been invested or mobilised in order to achieve intended effects.
This guide is based on the following understanding of inputs and effects
of policy intervention:
•	 	Input: resources mobilised for the implementation of a policy intervention;
resources comprise e.g. funding, personnel, infrastructure as well
as natural resources;
•	 	Output: product or service produced as a direct output from policy
intervention; outputs are typically short-term and are intended
to lead to results and contribute to intended long-term impacts);
•	 	Outcome: results of policy intervention contributing to achieving overall
objectives of policy; as such they to lead to desired changes that
initially motivated policy intervention;
•	 	Impact: typically long-term changes a policy intervention contributes
to (impacts can be analysed in many dimensions including socio-economic,
technological, cultural, political or environmental). Depending on when
they occur, impacts can range from short- to long-term.
Classifying outcomes and socio-economic impacts of R&I
This guide proposes a simple classification of main types of outputs, outcomes and
socio-economic impacts of supported research and innovation activities. Under-
standing the nature of effects of R&I policy will allow to create a link between the
dimension of socio-economic impacts and environmental pressures and impacts.
Typical outputs and outcomes of R&I policy interventions can be grouped
in three broad types including new or modified:
•	 Knowledge;
•	 Individual and social practices;
•	 Products, technologies or infrastructures.
New or modified knowledge is an essential outcome of R&I policy. Knowledge comes
in many forms. It can be theoretical or applied. It can be explicit (codified and trans-
ferable) or tacit (informal and intuitive). Knowledge can be generated, modified and
diffused. Knowledge is created in a social process of interaction and learning between
many actors. It is the mix of old and new, implicit and explicit knowledge that is most
likely to influence new policies, practices or products.
4
New or modified social practices and new forms of organisation comprise the second
broad type of outcomes. Put simply, this type focuses on R&I outcomes that influ-
ence behaviour and forms of organisation of people. One can differentiate between
changes at the individual (i.e. consumer, household), organisational (i.e. company) or,
more broadly, societal level (e.g. social group).
New or modified products, technologies or infrastructures are most common tangible
effects of innovation policies. The types of related outcomes can range from devel-
oping and testing a product prototype, through introducing a new technology to the
market, to supporting a wide diffusion of existing technologies.
Outcomes of R&I policy are expected to contribute to wider socio-economic impacts.
This guide scopes the impact into five areas:
•	 Knowledge production and learning system;
•	 Policy, regulation and governance system;
•	 Social practice and consumption patterns;
•	 Production system and business models;
•	 Technical infrastructures and built environment.
Knowledge production and learning system refers to a system where individuals and
organisations engage in collective processes of learning and knowledge production. The
system includes both public and private actors and formal and informal exchanges be-
tween them. Wider changes in this area may occur in relation to new knowledge gener-
ated with support of R&I policy or with new practices. Influencing this system is one of
the key overall objectives of R&I policy, as exemplified by the EU support for the ERA
The second type of impacts of R&I policy are in the area of policies, regulation and
governance. Policies and strategies may be influenced by many factors. Outputs and
outcomes of R&I policy may influence public strategies and policies by pointing to new
evidence about social or economic processes (e.g. highlighted in a new study) as well as
by mobilising the emergence of new visions of economic and social development (e.g.
foresight exercises). Modified or new policies may in turn influence products and practic-
es of economic and social actors. Regulation and standards, for example, have a direct
impact on product design and research and innovation activites of the whole industries.
Social practice and consumption patterns relate to the dimension of individual and so-
cial practices and consumption patterns in societies. This includes relations between
individuals and organisations, but also between individuals and organisations and ar-
tefacts (e.g. products and infrastructures) and between individual and organisation and
nature. The latter is especially relevant for environmental impacts. Policy intervention
on waste, for example, may foster new processes in companies. High prices or bans on
certain waste streams may lead firms to introduce new processes and practices (e.g.
material substitution) and forms of organisation (e.g. new collaborations). R&I polices
may lead to widely-disseminated new practices in households. This can be linked with
dissemination of new knowledge (e.g. on daily hygiene) or specific technology (e.g. ICT).
Behavioural changes are rarely determined by policies alone. In general, we can observe
that over time, a bundle of policies and single events (e.g. outbreak of disease, natural
or manmade catastrophe) contribute to a behavioural change.
The area of production system and business models concentrates on how the produc-
tion system delivers value to users. This includes the production processes (e.g. design
and manufacturing of products and technologies) as well as service systems associated
with products. On the level of impacts, the focus is on how new or modified goods or
services supported by R&I policy diffuse and whether and to what extent they substitute
existing products, services or product-service systems (e.g. new mobility systems).
Technical infrastructures and built environment are closely related to the production
system, but the focus is on how new or modified products (notably new materials and
technologies) influence lasting infrastructures and the built environment. The area is
introduced to emphasise the relevance of infrastructures for generating or avoiding
environmental pressures and impacts.
1.1.2	 Determinants of impacts
of R&I policy
Implementation of R&I policy does not occur in isolation. There are many factors and
mechanisms that determine the outcomes and wider impacts of policy intervention.
These factors can both enable or hinder intended and unintended effects of policy. The
determinants of R&I policy and environmental impacts should be studied in a systemic
way taking into account various relevant dimensions and time-horizons.
Determinants can be grouped in several dimensions following an extended
STEEP* framework, including:
•	 Socio-cultural determinants
−	 	Knowledge and learning (capacity to learn and to generate knowledge)
*STEEP stands for Social, Technological, Economic, Environmental and Political and is typically used as an analytical structure for studying external factors that influence a studied phenomenon.
5
−	 	Networking (ability to collaborate and capacity to take collective action)
−	 	Organisational capacity (ability to create and manage organisations)
−	 	Cultural aspects (including value systems influencing consumer
behaviour, attitudes towards change and risk etc.)
•	 	Technical and technological determinants (e.g. quality of technical infrastructures);
•	 	Economic determinants (e.g. market position, demand, access to capital, resource prices);
•	 Environmentaldeterminants(accesstomaterialandnaturalresources,
thestateofeco-systems);
•	 	Policy and regulatory framework (including legal system, standards and norms,
intellectual property rights, fiscal policies, public procurement).
There are different internal and external factors playing out at different stages of the
intervention. Determinants play different role at micro- (e.g. a firm or a household),
meso- (e.g. a sector or value chain) or macro-level.
Outputs, outcomes and wider impacts of policies are all to different extents dependent on
internal and external determinants. The outputs are the most controllable effects of an
intervention as they depend to a large extent on internal capacity (e.g. the competence of
the research team, access to equipment or good management). Outcomes and wider im-
pacts of policy intervention depend on external determinants to a larger extent. In general,
the further away from immediate outputs, the stronger is the inter-dependence of what
is intended to be an outcome of an intervention with the external determinants. External,
by definition, is not fully controllable and, therefore, implies a degree of risk or uncertainty.
1.2	What are environmental
pressures and impacts?
1.2.1	 Introducing environmental
pressures and impacts
The relationships between environmental pressures resulting from changes in human
production and consumption activities and their impacts on the natural systems are
manifold and complex. Importantly, human activities can be both harmful and favour-
able for the natural environment (i.e. they can gener-
ate or alleviate the pressures).
Economic activities in terms of production and con-
sumption require inputs of natural resources (such
as materials, energy, water and land) to maintain
their functioning (input side). Extraction and process-
ing of these natural resources create environmental
pressures, such as material or water extraction or
land use change. As a result of socio-economic ac-
tivities, waste and emissions are released back to
nature, also causing environmental pressures on the
output side. Both resource extraction and generation
of waste and emissions lead to a variety of environ-
mental impacts, such as water scarcity or climate
change. These various environmental impacts then
have feedbacks to the economy and society, for ex-
ample, in the form of negative impacts on human
health or by necessitating investments into pollution
abatement. This framework considers both environ-
mental pressures and environmental impacts. Such a
framework also allows us to consider life cycle think-
ing in the environmental assessment approach.
Environmental pressures
Four categories of environmental pressures
are considered the most important:
•	 Materials as resource inputs and waste outputs;
•	 Water, including emissions to water;
•	 Land, including emissions to soils;
•	 Carbon and air emissions.
When evaluating the overall environmental con-
sequences, it is important to pay particular at-
tention to the inter-linkages between the cat-
egories. Only when all types of environmental
Environmental
pressures
Pressures refer to
developments in the use of
natural resources (materials,
energy, water, land) as inputs
to human activities, as well
as the release of substances
on the output side (waste,
GHG emissions, air and water
pollution). These pressures
exerted by society are
transported and transformed in
a variety of natural processes
and cause changes in
environmental conditions.
Environmental
impacts
The changes in environmental
conditions lead to impacts
on the social and economic
functions on the environment,
such as the provision of
adequate conditions for health,
resources availability and
biodiversity. Impacts often occur
in a sequence: for example,
GHG emissions cause global
warming (primary effect),
which causes an increase in
temperature (secondary effect),
leading to a rise of sea level
(tertiary effect), finally leading
to loss of biodiversity.
Adapted from: (EEA, 1999)
6
pressures are analysed in parallel within one framework can one avoid pursu-
ing partial solutions, which minimise pressures in one category through shift-
ing problems to another. This aspect is of particular importance when assess-
ing the overall environmental effects of R&I projects, programmes and policies.
The category of materials comprises all renewable (biotic) and non-renewable (abi-
otic) material resources. Renewable materials are divided into the harvested products
from agriculture, forestry and fishery. Non-renewable materials comprise fossil fu-
els, metal ores and industrial and construction minerals. A full material accounting
balance comprises both the inputs of materials for production and consumption ac-
tivities, as well as the production of waste on the output side. The unit of measure-
ment for materials are mass units, e.g. kilogrammes for assessments on the prod-
uct level and metric tonnes for assessments on the level of sectors and countries.
The pressure category “water” refers to the uptake (abstraction) and consump-
tion of water by human activities. Generally, two main types of water are distin-
guished: blue water resources, which refer to surface and ground water; and green
water resources, which is the rainwater consumed by plants in agricultural pro-
duction. In some concepts, grey water is also included as a third category, indi-
cating the pollution of freshwater (Hoekstra and Mekonnen, 2012). Water use is
measured in volume units, such as m³ for national studies or litres for product studies.
It is mostly expressed with regard to a certain time (e.g. water consumption per year)
or in relation to a certain product (e.g. water footprint to produce one cup of coffee).
Land cover and land use assessments illustrate the amount of land being appropriated
for various human purposes. The total land area is disaggregated into various catego-
ries, including arable land for agricultural production, forest areas for timber extraction,
pastures for grazing of animals, as well as various types of artificial surfaces used e.g.
for mining of materials, infrastructure, manufacturing or private housing (EEA, 2010).
It is also important to track the change of land cover, such as the spread of urban
areas to the detriment of agricultural areas. Land-related assessments are measured
in area units, such as km² or hectares for national studies or m² for product studies.
ENERGY
is not considered as a sepa-
rate environmental pressure
category. The reason is that
the various environmental
pressures generated by en-
ergy use are already covered
by the other four categories:
material aspects (e.g. fossil
fuels or biomass) are covered
as materials, aspects related
to GHG emissions (from fos-
sil fuel combustion or from
land use change related to
bio-energy production) are
included in the carbon/emis-
sions section, water and land
requirements for bio-energy
production are considered in
the water and land categories.
Activities that add greenhouse gases (GHGs, prin-
cipally CO2, Methane, nitrous oxides and HCFCs) to
the atmosphere induce climate change impact on
a number of ecosystems, as well as having an ef-
fect on economic activities, health and the demands
and supplies of energy. Overall emissions of GHGs
are reported nationally by all European countries
to the UNFCCC. In the context of R&I assessments,
more important are the emissions by activity, mea-
sured in carbon dioxide equivalent terms, based on
the current and proposed use of fossil fuels and
technologies. The aim is to estimate life cycle emis-
sions, i.e. from each stage of the production of the
fuel through its use, to its final disposal. In addition
to the emissions of greenhouse gases, activities
that generate carbon are also activities that pro-
duce a number of local pollutants that damage hu-
man health, crops and materials. Other local pollut-
ants that have a notable level of impacts through a
number of complex chemical reactions include SOx,
NOx and ozone. Estimates of life cycle emissions
from different fossil sources and technologies and
details of methodologies used are available (Mar-
kandya, 2010).
Environmental impacts
Environmental assessments include a number of different environmental impact
categories. In particular methodologies of Life Cycle Assessments (LCA) provide a
comprehensive consideration of the various environmental impacts of production
and consumption activities. Figure 5 provides a tentative clustering of the most
common environmental impact categories, including short descriptions of the nature
of each impact. Three areas can be identified, where impacts occur: they can negative-
ly affect human health, the natural environment (ecosystems) and natural resources
(Sala et al., 2012).
Land
Materials
Carbon and air emissions
Water
7
Source: Adapted from Sala et al. (2012)
Figure 2. Main environmental impact categories
Climate Change
The potential of environmental pressures exerted by GHG emissions (such as carbon dioxide from combustion of fossil fuels or methane from
agricultural production) to cause changes in the temperature of the atmosphere and thus to contribute to climate change.
Human health
Natural environment
Photochemical ozone
creation
Photochemical ozone is created by radiation from the sun and some chemical substances, which result from incomplete combustion of fossil
fuels (such as nitrogen oxides and hydrocarbons), leading to negative impacts on both human health and agricultural production.
Human health
Natural environment
Ozone depletion
While photochemical ozone is created on ground levels, other ozone-depleting substances (such as CFCs and halons used in refrigerators) lead
to stratospheric ozone depletion, which reduces the potential of the atmosphere to hold back harmful radiation, in particular ultra violet radia-
tion, from space.
Human health
Natural environment
PM, Respiratory
emissions
Emissions of particulate matter as well as secondary particles resulting from chemical reactions with nitrates and sulphates are harmful to
health. They are the by-product of combustion of fossil fuels
Human health
Ecotoxicity
Ecotoxicity is caused by persistent chemical substances, i.e. substances, which are not degradable by the natural systems and exert toxic effects.
They include, for example, dioxins from waste incineration, asbestos from insulation materials and heavy metals from various products.
Human health
Natural environment
Ionising Radiation
Ionising radiation can stem from both human sources, such as nuclear power plants, as well as natural sources, such as space radiation. The
impact of exposure to radiation depends on the accumulated dosage derived from inhalation, water and food.
Human health
Natural environment
Acidification
Acidification is caused by chemical substances (such as nitric acid or sulphuric acid, e.g. from electrolytes in lead-acid batteries and from clean-
ing agents) and can damage water bodies, fish stocks, soils and forests.
Natural environment
Eutrophication
Eutrophication occurs when excessive amounts of nutrients, such as nitrate or phosphate, reach ecosystems, e.g. through the application of
fertilisers or sewage. This leads e.g. to “algae blooms” in waters.
Natural environment
Human toxicity
This aggregated impact category illustrates the negative health impacts on humans stemming from the emission of toxic chemicals and sub-
stances.
Human health
Abiotic resource
depletion
Abiotic resource depletion refers to reductions in the available stocks of fossil fuels, metal ores and other minerals, potentially causing raw
material shortages on markets and related price increases.
Natural resources
Water scarcity
Water scarcity occurs in a situation, where the abstraction of fresh water is exceeding the rate of renewal in the respective water body, leading
to water shortages or droughts.
Natural resources
Land use competition
Land use competition is generally increasing and a result of multiple and growing demands, such as land for the production of food, feed, biofu-
els and biomaterials. This growing demand meets a limited stock of available productive land.
Natural resources
Loss of fertile land Loss of fertile land, e.g. due to soil erosion, is one commonly observed result of land being used too intensively Natural resources
Impact category Brief description of impact category Has Impact On:
8
The indicators that measure this pressure can
be considered at three levels:
•	 The micro level, which covers two areas:
−	 	products or services where R&I can change
environmental pressures per unit produced
−	 	individuals, households or organisations, where
R&I may involve changes that alter the impact
of households, consumers and other user
institutions on the environment;
•	 The meso level (industries, value chains), where
the R&I may change standards and practices;
•	 The macro level (countries, regions) where an
aggregation of effects at the micro and meso
-levels feed through to pressures that change
national indicators of environmental pressure.
Figure 3 presents main indicators of environmental
pressures currently being used for the three main levels
of economic activities. The indicators vary in their degree
of methodological refinement and standardisation. Indi-
cators at the product and the national level are gener-
ally more advanced and more frequently applied than
indicators at the level of households or industries. Note
that most of the indicators take a life cycle perspective
and thus are robust against dislocation of environmen-
tal burden, e.g. through outsourcing from one country to
another. Considering all levels of economic activities is of key impor-
tance, in order to evaluate the overall environmental effects of
R&I activities. R&I investments often lead to the development of
more resource efficient products and services, thus reducing the
material or energy costs for the producer and/or the consumer.
FIGURE 3. Main indicators of environmental pressures
Micro level Meso level Macro level
Products
/ Services
Consumers
/ Households
/ Organisations
Industries
/ Value chains
Countries
/ Regions
Materials1
(mass units:
kg or tonnes)
Material Input per Service
unit (MIPS)
Material use per
consumer, household or
organisation
Material use by industry Domestic/Raw/
Total Material Consumption
(DMC/RMC/TMC);
Physical Trade Balance
Water2
(volume: units:
litres and m³)
Use per unit of output
of good or service.
Product water footprint.
Use per household or
institution by type of
water
Use by industry by type
of water
National water abstraction
Water Exploitation Index
(withdrawal relative to supply
National water footprint
(incl. embodied water)
Land3
(area units:
m² or hectares)
Land requirement per unit
of good or service.
Product land footprint
Land demand per
households or
institution by type
of land (brownfield
vs. greenfield)
Demand by type of land
(brownfield versus
greenfield)
Degree of urban spread.
Land conversion from one type
of land to another. National
land footprint (incl. embodied
land)
Carbon
and Air4
(mass units:
kg or tonnes)
Embodied GHG emissions
per unit of good or service.
Embodied emissions of key
pollutants (small particles,
SOx, NOx, VOCs, ozone)
per unit of good or service
GHG emissions per
household.
Emissions key air
pollutants
per household.
GHG emissions per unit
of output and overall by
industry.
Emissions of key pollutants
per unit of output and
overall by industry
National emissions data
for GHGs and associated
pollutants.
National carbon footprint
(incl. embodied GHG
emissions)
1.2.2 Measuring
environmental
pressures
and impacts
1.	 Where possible estimates should be based
on a LCA of materials use.
2.	 Where possible estimates should be based on a LCA of wa-
ter requirements. Water use changes by time of year may
be important. Type of water refers to the use of green,
blue and grey water. Changes in emissions of harmful pol-
lutants to water may be relevant in some cases.
3.	 Land use change may be more environmentally damag-
ing in some locations than others. Some indicator of
importance of land affected in terms of biodiversity and
ecosystem services may be required.
4.	 Where possible estimates should be based on LCA of
GHG emissions and associated local pollutants.
9
FIGURE 4 provides a summary of the main indica-
tors of environmental impacts, classifying them un-
der the four headings of materials, water, land and
carbon/air. These areas are mapped into the impact
categories of human health, the natural environment
and natural resources. In addition a fourth category of
impacts has been added, which is the economy. This
is included to pick up the costs of different areas of
impact on economic agents
For companies this can help to increase production
and market share, as the products become more com-
petitive. For consumers, this may lead to a change in
behaviour, in which a product or service is used more
intensively (because it is cheaper to use) or other
products and services are consumed with the money
saved. These often unintended effects of technologi-
cal improvements are known as “rebound effects”.
Supporting R&I to improve the environmental perfor-
mance of products and services alone may not lead to
the desired improvement for society as a whole.
FIGURE 4. Main indicators of environmental impacts
In the FP5 project “MOSUS” (Modelling opportuni-
ties and limits for restructuring Europe towards
sustainability), the effects of expected increases
in material productivity of industrial sectors were
simulated with an economic-environment model.
Based on empirical evidence from environmental
consultants that up to 20% of material costs can
be saved without compromising profitability (Fis-
cher et al., 2004), the team modelled the economy-
wide impacts of a consultancy programme, which
supports companies to exploit this potential.
The overall economic effects of implementing such
a programme were positive, as material cost re-
ductions stimulated economic growth and employ-
ment. However, the measures did not lead to an
absolute reduction of material use due to rebound
effects. It was therefore concluded, that in order to
balance economic and environmental goals, strate-
gies to increase material efficiency in the produc-
tion sphere need to be complemented by macro-
economic measures such as material input taxes or
other fiscal measures (Giljum et al., 2008).
Area On the natural
environment
Consumers
/ Households
/ Organisations
On natural
resources
On amenity
and economy
Materials Concentration of heavy
metals
Concentrations of PAH,
PCB and mercury
Concentration
of heavy metals
Concentration of PAH, PCB
and mercury
Concentration
of dioxins, lead
Concentrations of
radioactive materials
Rates of extraction
relative to deposits
Costs of treatment
of wastes generated
Prices of extracted
materials
Water Salinity of aquifers
Index of eutrophication
Entry of invading species
SO2 and NOx deposition
Faecal concentrations in
recreational waters
Nitrate concentrations
Rates of abstraction
relative to rates
of recharge
Costs of treatment
of water as a function
of pollution loadings.
Land3 Wetland loss due to
drainage
Estimated loss of genetic
resources
SO2 and NOx deposition
Surface disposal of
mineral working deposits
Accidental fires
Deposition of radioactive
materials on soil
Deposition of heavy metals
on soil
Leaching of waste from
landfills
Loss of greenfield areas Erosion
Changes in fertility
Costs of treatment
of wastes to land
Carbon
and Air
emissions
Stratospheric ozone
concentration
Loss of land due
to sea level rise
Concentrations of local air
pollutants (PM, VOCs)
Concentration
of tropospheric ozone
Costs of insurance
against extreme
events
Source: adapted from (Markandya and Dale, 2001)
10
1.3.1 Qualitative impact pathways
This section introduces the overall logic of how to identify and analyse outcomes and
impacts of R&I that are likely to decrease or increase environmental pressures and im-
pacts. In general, the further “upstream” is supported research and innovation activity,
i.e. the further it is from its final application, the higher is the uncertainty related to as-
sessing its wider outcomes and impacts, including its environmental impacts. In other
words, the more assumptions one has to make about potential environmental impact
of the investment in R&I. This uncertainty is reduced in ex-post assessments, but the
complexity and practical difficulty of attributing environmental impacts to research
activities remain significant (e.g. considerable time lags, cumulative causation etc).
Direct pressures and impacts of R&I on environment
Direct pressures and impacts on environment are caused by these R&I policy effects
that directly contribute to a quantitative change of environmental pressure, notably
the use of material, land, water and of the level of emissions of C02 and other harm-
ful substances. Importantly, the effects of R&I policies can lead to either decreasing
or increasing pressure of human activity on the environment. The most evident types
of R&I outcomes causing measurable environmental pressures are new or modified
products and individual and collective practices. While products require resources and
cause emissions throughout their life cycle, individual or collective practices contribute
to environmental pressures through consumption processes. Attributing environmental
pressures to products and practices on the micro level is a relatively straightforward
exercise. A simplified impact pathway in this case is as follows: policy intervention –
new product or practice – environmental pressure – environmental impact. Any assess-
ment of environmental pressure should be performed taking into account the whole life
cycle of the product or service and associated material and energy use and emissions.
A more challenging scope of IA is to analyse wider socio-economic impacts at the
meso (e.g. value chain) or macro level (e.g. a country). Here the analysis needs to take
into account the scale and dynamics of diffusion as well as possible substitution and
rebound effects related to the diffusion of the new product or service. Environmental
pressures and impacts should be thus calculated not by a simple aggregation of micro-
level pressures and impacts of the analysed product, but need to take into account
how the diffusion of the product influences other existing products fulfilling similar
functions.
The assessment of environmental pressures of products should also take into account
how the use of artefacts influences individual or collective practices associated with
their use and, conversely, how existing practices influence the use of artefacts. Thus
the impact pathway comprises: policy intervention – new product or practice – associ-
ated practices and patterns of use or associated products – substitution and rebound
effects - environmental pressures – environmental impacts.
Indirect pressures and impacts of R&I on the environment
Indirect pressures and impacts on the environment are caused by these R&I policy ef-
fects that have a potential to influence tangible products, infrastructures and individual
or collective practices that cause measurable environmental pressures and impacts.
The R&I policy outcomes that can influence the development of products and practices
are new or modified knowledge and policies. Knowledge in its many forms plays a
fundamental role in development of all new products and practices as well as policies.
Tracing exact historical origins of any product back to its original idea and then follow-
ing its subsequent development is a difficult, perhaps impossible, exercise. Tracing the
knowledge origins of new products (and thus their environmental impacts) is, however,
possible in the case of ex-post IA. Consequently, an impact pathway that departs from
policy intervention with a potential indirect environmental pressure (e.g. support to
collaborative research) will be more complex than in the case of interventions with
tangible outcomes. This type of exercise, however, can bring novel insights on the role
of policy intervention.
Estimating actual environmental pressures of new knowledge can be based on as-
sumptions and projections. The robustness and significance of such ex-ante exercises
will depend on “distance” between knowledge and its application (distance to exploita-
tion or distance to market). The precision of IA will be higher when it is known how the
knowledge is actually exploited. For example, the estimates may prove more or less
accurate for applied knowledge (e.g. industrial design) in terms of material require-
ment and C02 emissions of a resulting product prototype (micro level). The actual
1.3 How to connect R&I policy
effects toenvironmental
pressures and impacts?
11
environmental pressures may be, however, different when the product goes into ex-
tensive production. They will further change depending on how the product is diffused
and used. Until knowledge ‘materialises’ in the form of artefact or practice, any IA has
to be based on assumptions of what environmental pressures will be caused.
Ex-ante estimates of environmental impacts of basic research face even longer dis-
tance to exploitation and thus are even more challenging, if meaningful, to perform.
This does not mean that ex-ante IA is not a valuable exercise. Ex-ante IA should not
be about precision when precise estimations are unfeasible or speculative. It should
be robust enough to indicate an overall direction of intended outcomes and impacts of
the intervention. More precise IA in terms of knowledge-oriented interventions may be
required when distance to exploitation is very short (e.g. research projects resulting in
industrial designs, product prototypes etc).
New findings resulting from research projects may result in new or modified policies.
New policies based on these findings can significantly influence both product design as
well as individual and collective practices of companies and households. The overall
logic of indirect impact of policy is that it may “empower” knowledge by translating
it into policy instruments and regulatory framework, including norms and standards.
Cumulative impacts of R&I policy
intervention on the environment
Cumulative impacts result from the combined effects of multiple processes. The im-
pact of a single policy intervention, for example, may not be significant on its own.
When combined with other policy interventions or other processes, however, the com-
bined effect may become more significant and better understood. Cumulative impact
can be defined as an impact resulting from accumulated effects of various policy
interventions and order determinants that affect the process or target group under
consideration.
In assessing the cumulative impact of R&I on the environment
one needs to consider:
•	 Policy mix of relevant policy interventions that can influence the impact;
•	 Determinants of impact in the R&I system and the environmental system which
can enable or impede effects of the intervention;
•	 Temporal perspective (or temporal coherence) in order to capture relevant effects
that take place over time and influence the measured environmental impact.
Introducing the IA canvas
This guide offers a practical tool for illustrating and analysing impact pathways.
Figure 5 introduces an extended IA canvas that allows to (literally and figuratively)
draw the lines between, on the one hand, outcomes and socio-economic impacts of
R&I policy and, on the other hand, the main areas of environmental pressures and
impacts. The framework can be used as a drawing board to identify direct or indirect
pressures and impacts on environment and to qualitatively analyse complex impact
pathways. The speed and scale of effects spreading along impact pathways need to be
analysed taking into account internal and external determinants of R&I.
The canvas helps to visualise the distance between the intervention and possible envi-
ronmental pressures and impacts. It makes it clear that environmental pressures and
impact can be only assessed following the analysis of intended and unintended socio-
economic outcomes and impacts of the intervention under focus. The tool can be used
to illustrate complex impact pathways with feedback loops and iterations between dif-
ferent types of effects and external determinants. Importantly, it allows for identifying
second- and higher-order effects and for iterating the impact pathway “up and down”
the picture that is between micro, meso and macro level effects.
12
ECO SYSTEM
Other policy areas, including macroeconomic and sectoral policies
RESEARCH AND INNOVATION R&I POLICY MIX
DIRECT ATTRIBUTION
OF ENVIRONMENTAL PRESSURES
RESEARCH
AND INNOVATION
SYSTEM
New or modified knowledge
New or modified behavior
and forms of organisation
Determinants of
research and innovation
(market trends, absorption
capacity and technology
readiness, regulatory,
institutionaland cultural
aspects)
Determinants of the
state of environment
(state of eco-systems,
natural resource use
patterns etc)
Impacts on eco-systems
and biodiversity
Impacts on human
health
Impact on natural
resources
Use of waterEmissions to air,
water and soils
Use of materials, incl.
energy carriers
Contribution to wider socio-economic impacts
Attribution of and contribution to environmental pressures
Attribution of R&I policy outputs and outcomes
Research
infrastructure
Collaborative
research
Marie Curie
-Skłodowska
actions
Public-private
& public-public
partnerships
Enhancing
capacity
of SMEs
Direct
support
SMEs
Access
to finance
Public
procurement
& standards
New or modified products
technologies and infrastructures
Production system
and business models
Knowledge generation
and learning system
Policy, regulation and
governance system
Social practice and
consumption patterns
Contribution to environmental impacts
Technical infrastructures
and built environment
Use of land
Impacts on amenity
and economy
Basic
research
(ERC)
ENVIRONMENTAL
PRESSURES
OUTPUTS
AND OUTCOMES
OF R&I POLICY
SOCIO
ECONOMIC
IMPACTS OF
R&I POLICY
ENVIRONMENTAL
IMPACTS
FIGURE 5. The IA canvas: extended visualisation of the IA framework
13
There are numerous possible impact pathways between policy intervention in R&I and
environmental impacts. The IA canvas allows to visualise diverse impact pathways
from outputs to impacts of R&I policy intervention. The tool can be equally useful in
supporting the counterfactual analysis and, for example, comparing possible impact
pathways of the planned intervention with what would happen in absence of the policy
measure.
The visualisations point to where evidence supporting causality assumptions on ef-
fects of policy intervention needs to be collected and analysed. One of the useful ap-
proaches to describe and analyse impacts pathways can be narratives (or story lines)
of impact pathways. Narratives make it easier to indicate where causality assumptions
about impact of policy intervention on wider socio-economic and environmental im-
pacts are made.
Figure 6 shows illustrative impact pathways of two R&I instruments: funding basic
research and direct support for SMEs. These two instruments have very different im-
pact narratives. On the one hand, R&I policy funds curiosity-driven basic research by
providing grants to researchers.
Illustrating impact pathways of such an instrument, especially ex-ante, is challenging
and often speculative due to an explorative nature of basic research and the long dis-
tance and time lag between the supported activity and its wider impacts. The environ-
mental impacts of basic research will depend, inter alia, on whether, how and when the
new knowledge generated by research activity influences products, practices or policies
(see the top IA canvas in Figure 6).
On the other hand, R&I policy may choose to directly support a wider diffusion of ex-
isting technological innovation by providing subsidies to SMEs for purchasing environ-
mental technologies. This example demonstrates a more straightforward impact path-
way and a shorter impact narrative based on relatively simple causal assumptions.
In this case, the environmental impacts will depend, inter alia, on the attributes of
the technology supported (e.g. how much material and water it saves compared with
existing alternatives) and the projected or achieved ratem of diffusion of technology
(e.g. how many companies adopt the technology and how large are their production
volumes; see the bottom IA canvas in Figure 6).
Clearly, even such a “simple” narrative may suffer from unexpected developments
(e.g. the emergence of alternative more cost-effective solution or market downturn)
that can make the public support for the technology obsolete. The complementary use
of prospective studies and foresight could help in anticipating unexpected barriers,
especially in case of impact pathways of public interventions that deliberately aim at
disruption and more radical innovation.
The IA canvas can also be used to visualise cumulative impact pathways.
Figure 7 provides an illustration of how to demonstrate potential cumulative effects
of two selected instruments: support for basic research and direct support to SMEs.
The canvas allows first, to overlay two pathways and, second, to identify phases in
which impact pathways may “connect” and create cumulative impact. In the example
explored, cumulative effects occur between measures following different timeframes
of expected outcomes and impacts. By identifying direct and indirect effects of two in-
struments, ranging from second- to fifth-order effects, the canvas allows for including
a temporal dimension to the analysis (i.e. how long it may take before certain cumula-
tive effects may occur).
The impact pathways need to be supported with qualitative and quantitative evidence
to substantiate claims about the relationship between public intervention and an
expected or observed effect.
14
ECO-SYSTEM
Other policy areas, including macroeconomic and sectoral policies
RESEARCH AND INNOVATION (R&I) POLICY MIX
DIRECT ATTRIBUTION
OF ENVIRONMENTAL PRESSURES
RESEARCH
AND INNOVATION
SYSTEM
New or modified behavior
and forms of organisation
Determinants of
research and innovation
(market trends, absorption
capacity and technology
readiness, regulatory,
institutionaland cultural
aspects)
Determinants of the
state of environment
(state of eco-systems,
natural resource use
patterns etc)
Impacts on eco-systems
and biodiversity
Impacts on human
health
Impact on natural
resources
Use of water
Contribution to wider socio-economic impacts
Attribution of R&I policy outputs and outcomes
Research
infrastructure
Collaborative
research
Public-private
& public-public
partnerships
Enhancing
capacity
of SMEs
Direct
support
SMEs
Access
to finance
Public
procurement
& standards
New or modified products
technologies and infrastructures
Knowledge generation
and learning system
Contribution to environmental impacts
Technical infrastructures
and built environment
Use of land
Impacts on amenity
and economy
Basic
research
(ERC)
A
A
A
A A A
A A A
A
FF
F
D
D
D
D
F
F
Attribution of and contribution to environmental pressures
ENVIRONMENTAL
PRESSURES
OUTPUTS
AND OUTCOMES
OF R&I POLICY
SOCIO-
ECONOMIC
IMPACTS OF
R&I POLICY
ENVIRONMENTAL
IMPACTS
Production system
and business models
Social practice and
consumption patterns
Emissions to air,
water and soils
Use of materials, incl.
energy carriers
New or modified knowledge
Marie Curie
-Skłodowska
actions
Policy, regulation and
governance system
FIGURE 6. The IA canvas: two examples of instrument-level impact pathways
Legend:
indicative IA
pathway from
basic research
(ERC) to
environmental
impacts
A - attribution decision/causality mechanism D – determinants F – feedback
15
ENVIRONMENTAL
PRESSURES
ECO-SYSTEM
Other policy areas, including macroeconomic and sectoral policies
RESEARCH AND INNOVATION (R&I) POLICY MIX
OUTPUTS
AND OUTCOMES
OF R&I POLICY
SOCIO-
ECONOMIC
IMPACTS OF
R&I POLICY
ENVIRONMENTAL
IMPACTS
DIRECT ATTRIBUTION
OF ENVIRONMENTAL PRESSURES
RESEARCH
AND INNOVATION
SYSTEM
New or modified knowledge
New or modified behavior
and forms of organisation
Determinants of
research and innovation
(market trends, absorption
capacity and technology
readiness, regulatory,
institutionaland cultural
aspects)
Determinants of the
state of environment
(state of eco-systems,
natural resource use
patterns etc)
Impacts on eco-systems
and biodiversity
Impacts on human
health
Impact on natural
resources
Use of waterUse of materials, incl.
energy carriers
Contribution to wider socio-economic impacts
Attribution of R&I policy outputs and outcomes
Research
infrastructure
Collaborative
research
Public-private
& public-public
partnerships
Enhancing
capacity
of SMEs
Direct
support
SMEs
Access
to finance
Knowledge generation
and learning system
Policy, regulation and
governance system
Social practice and
consumption patterns
Contribution to environmental impacts
Technical infrastructures
and built environment
Use of land
Impacts on amenity
and economy
Basic
research
(ERC)
A A A
A A A
A
A
FF
F
D
D
D
D
F
F
Attribution of and contribution to environmental pressures
Public
procurement
& standards
New or modified products
technologies and infrastructures
Production system
and business models
Marie Curie
-Skłodowska
actions
Emissions to air,
water and soils
FIGURE 6. The IA canvas: two examples of instrument-level impact pathways (continued)
Legend:
indicative IA
pathway from
from direct
support to
SMEs (product
development)
to environmental
impacts
A - attribution decision/causality mechanism D – determinants F – feedback
16
ECO SYSTEM
Other policy areas, including macroeconomic and sectoral policies
RESEARCH AND INNOVATION R&I POLICY MIX
DIRECT ATTRIBUTION
OF ENVIRONMENTAL PRESSURES
RESEARCH
AND INNOVATION
SYSTEM
New or modified knowledge
New or modified behavior
and forms of organisation
Determinants of
research and innovation
(market trends, absorption
capacity and technology
readiness, regulatory,
institutionaland cultural
aspects)
Determinants of the
state of environment
(state of eco-systems,
natural resource use
patterns etc)
Impacts on eco-systems
and biodiversity
Impacts on human
health
Impact on natural
resources
Use of waterEmissions to air,
water and soils
Use of materials, incl.
energy carriers
Attribution of R&I policy outputs and outcomes
Research
infrastructure
Collaborative
research
Public-private
& public-public
partnerships
Enhancing
capacity
of SMEs
Direct
support
SMEs
Access
to finance
Public
procurement
& standards
New or modified products
technologies and infrastructures
Production system
and business models
Knowledge generation
and learning system
Policy, regulation and
governance system
Social practice and
consumption patterns
Contribution to environmental impacts
Technical infrastructures
and built environment
Use of land
Impacts on amenity
and economy
Basic
research
(ERC)
Other policy areas, including macroeconomic and sectoral policies
DIRECT ATTRIBUTION
OF ENVIRONMENTAL PRESSURES
DIRECT ATTRIBUTION
OF ENVIRONMENTAL PRESSURES
1
2 2
3
F
F
A A
FF
F
D
D
D
D
F
2
3
C1
C2
C3
2
1
3 4
3 4
2 5 2 5 2 5
A
Contribution to wider socio-economic impacts
Attribution of and contribution to environmental pressures
ENVIRONMENTAL
PRESSURES
OUTPUTS
AND OUTCOMES
OF R&I POLICY
SOCIO
ECONOMIC
IMPACTS OF
R&I POLICY
ENVIRONMENTAL
IMPACTS
Marie Curie
-Skłodowska
actions
FIGURE 7. The IA canvas: illustrating cumulative R&I impact pathways
Legend:
cumulative
IA pathway
from basic
research
and direct
support to
SMEs (product
development)
to environmental
impacts
Numbers on
the pathways
indicate the
order of effect
attribution
(or contribution)
to policy
intervention
(e.g. 1 stands
for 1st order
or direct effect,
2 for 2nd
order effect,
3 for 3rd order
effect etc.).
The pathways
can be analysed
by following the
order of effect.
Second- and
higher-order
effects are all
indirect effects.
C – potential cumulative impact (phases in which various impact pathways may create cumulative impact) D – determinants F – feedback
17
1.3.2 Constructing methodologies
and selecting methods of IA
Constructing IA methodologies to analyse and measure effects of R&I policy is chal-
lenging as it requires connecting approaches used by social sciences with environmen-
tal assessment methods rooted in natural and physical sciences. The central question
is how to make the link between, on the one hand, quantitative and qualitative evi-
dence on effects of R&I and, on the other hand, methodological frameworks focused
on environmental pressures and impacts. Creating these connections in practice may
require a dedicated research and modelling effort.
In general terms, there are two ways to connect evidence on R&I policy effects and
environmental pressures and impacts:
•	 Direct relationship: evidence on changes in products and behaviours due to R&I
policy that can be measured using parameters that are also used by environ-
mental assessment methods (e.g. changing in material requirements of prod-
ucts measured in kilos, water use measured in litres or volumes, emissions
measured in kilos etc);
•	 Indirect relationships: evidence on changes in knowledge (e.g. technical knowl-
edge, social awareness etc) due to R&I policy that may influence products and
behaviours which may influence environment. This can be referred to as sec-
ond- and higher-order effects. This evidence is often qualitative (e.g. changed
attitudes towards nature or towards technology in society).
FIGURE 8 illustrates how evidence on outcomes in the areas of knowledge, practic-
es and processes and products and technologies can inform environmental assess-
ment methods and methodological frameworks. The table differentiates between
evidence gathered at micro (e.g. product, individual, organisation) and meso-macro
(e.g. sector, socio-technical system) levels.
The table can accompany the IA canvas suggesting type of evidence and meth-
ods underlying different the IA pathways. Evaluations and IA of research and in-
novation policy use a wide range of social science methods to capture effects
of policies. The table suggests methods, types and nature of evidence relevant
for assessing environmental pressures and impacts along with data selection and
analytical methods.
The availability of relevant evidence in practice
will depend on whether the intervention explicitly
aims at reducing environmental impacts.
Programmes or instruments with environmental objectives are more likely to include
relevant indictors in their monitoring and evaluation systems whereas interventions without
an evident environmental dimension will focus on gathering evidence of a different nature.
The availability and quality of programme data is therefore one of the fundamental factors
assuring robustness of IA.
18
New or
modified
knowledge
Is the new
or modified
knowledge
relevant?
Was / is new
or modified
knowledge
leading
to changes
in behaviour
or products
and services?
 
Micro Quantitative and qualitative evidence
on new knowledge relevant for environment
resulting from policy support
Qualitative and quantitative evidence on
new knowledge contributing to innovative
practices and new products
Data collection:
Internal programme data
Bibliometrics and patent data
Survey-based enquiries on R&I structural
data (e.g. funding, innovation collaboration)
Interviews
Data analysis:
Counterfactual analysis
Case studies
Historical tracing
Expert-based methods
(e.g. expert panels)
Foresight (e.g. scenarios)
Mixed methods:
Experimental methods
(e.g. Living Labs)
Input to analysis in the framework
of sustainability impact assessments
(SIA) or strategic environmental
assessments (SEA)
Meso-macro Quantitative and qualitative evidence
on diffusion of new knowledge and social
learning generated with policy support
Qualitative and quantitative evidence on
new knowledge contributing to diffusion
of (new or existing) practices and (mew
or existing) products
Qualitative and quantitative evidence
on new knowledge contributing to new
or reviewed policies and regulatory
decisions relevant for environment
Data collection:
Internal programme data (aggregated)
Bibliometrics and patent data
Survey-based enquiries on R&I
structural data (e.g. funding, innovation
collaboration) Interviews
Data analysis:
Contribution analysis
Counterfactual approaches
Historical tracing
Expert methods (expert panels)
Foresight methods (e.g. scenarios)
Input to analysis in the
framework of sustainability
impact assessments (SIA)
or strategic environmental
assessments (SEA)
FIGURE 8. Linking R&I policy effects and environmental assessment methods
Areas of
R&I policy
outcomes
Relevance
of R&I for
environmental
pressures
and impacts
Level of
enquiry
Evidence relevant
for assessing
environmental
pressures
and impacts
Possible data
selection
and analytical
methods
Possible input
to environmental
assessment methods
and frameworks
19
New or
modified
behaviour,
processes
and forms
of organisa-
tion
What are / will be
the changes in en-
vironmental pres-
sures and impacts
resulting from
innovative prac-
tices, processes
and organisa-
tional changes
supported by the
research and in-
novation policy?
Micro Quantitative evidence on changes in
resource use and emissions resulting
from innovative processes, organisational
changes or individual or collective prac-
tices (compared to existing alternatives)
Qualitative and quantitative evidence on
causal mechanisms leading to new prac-
tices or processes (e.g. resulting from new
knowledge, products or policies)
Data collection:
Internal programme data
Survey-based enquiries
Interviews, focus groups
Data analysis:
Expert methods (expert panels)
Case studies
Foresight methods (e.g. scenarios)
Mixed methods:
Experimental methods (e.g. Living Labs)
Ecological Footprint
Material Input per Service Unit (MIPS)
CBA/CE
Multi Criteria Analysis
Meso-
macro
Quantitative evidence on changes
in material, water, land use and emissions
due to innovative processes, organisation-
al changes or individual or collective
practices (aggregated)
Qualitative and quantitative evidence
on causal mechanisms leading
to diffusion of new practices or processes
(including links with products and
systemic determinants e.g. institutional
lock-ins, social acceptance,
regulatory framework etc)
Data collection:
Internal programme data (aggregated)
Survey-based enquiries on R&I structural
data (e.g. funding, innovation collaboration)
Interviews
Data analysis:
Contribution analysis (meso-macro)
System dynamics
Case studies (e.g. value chains)
Foresight methods (e.g. scenarios)
Ecological Footprint
Physical accounting (indirect input
based on the importance of new prac-
tices for changing the material flow)
Input-output analysis (indirect)
Supply chain analysis
CBA/CE
Multi Criteria Analysis
Adjusting GDP (monetary)
FIGURE 8. Linking R&I policy effects and environmental assessment methods (continued)
Areas of
R&I policy
outcomes
Relevance
of R&I for
environmental
pressures
and impacts
Level of
enquiry
Evidence relevant
for assessing
environmental
pressures
and impacts
Possible data
selection
and analytical
methods
Possible input
to environmental
assessment methods
and frameworks
20
New or
modified
products,
technolo-
gies
What are / will
be the changes
(decrease or
increase) in
environmental
pressures and
impacts due
to innovative
products
or technologies
supported by
research and
innovation policy?
Micro Quantitative evidence on changes
in material, water, land use and
emissions resulting from new or
modified products (pressures and
impacts across the life cycle of
products compared with
alternatives)
Qualitative and quantitative
evidence on causal mechanisms
leading to new products (e.g.
resulting from new knowledge,
processes or policies)
Data collection:
Internal programme data
Survey-based enquiries on R&I
structural data (e.g. funding,
innovation collaboration)
Interviews
Data analysis:
CBA/CE (micro-meso)
Case studies
Expert-based methods (e.g. expert
panels)
Foresight methods (e.g. scenarios)
Mixed methods:
Experimental methods (e.g. Living
Labs)
Life Cycle Assessment (direct)
Ecological Footprint
Material Input per Service Unit
(MIPS)
CBA/CE
Multi Criteria Analysis
Meso-
macro
Quantitative evidence on changes
in material, water, land use and emissions
due to diffusion of innovative projects and
substitution (aggregated information on
resource use and emissions)
Qualitative and quantitative evidence on
causal mechanisms leading to diffusion of
new products (including links with practices
and systemic determinants e.g. institution-
al lock-ins, social acceptance, regulatory
framework etc)
Data collection:
Internal programme data
(aggregated)
Survey-based enquiries on R&I
structural data (e.g. funding,
innovation collaboration)
Interviews
Data analysis:
Contribution analysis
CBA/CE (meso)
Econometric modelling
System dynamics
Case studies
Foresight (e.g. prospective
scenarios)
Physical accounting
Input-output analysis
Ecological Footprint
Supply chain analysis
CBA/CE
Macro LCA
Multi Criteria Analysis
Adjusting GDP (monetary)
FIGURE 8. Linking R&I policy effects and environmental assessment methods (continued)
Areas of
R&I policy
outcomes
Relevance
of R&I for
environmental
pressures
and impacts
Level of
enquiry
Evidence relevant
for assessing
environmental
pressures
and impacts
Possible data
selection
and analytical
methods
Possible input
to environmental
assessment methods
and frameworks
21
* This guide complements and extends the European
Commission’s Impact Assessment Guidelines (EC 2009)
by including ex-post IA and focussing on the
environmental dimension.
2.	Environmental
dimension
in the analytical
steps of impact
assessment
Figure 9. Impact assessment cycle
This guidebook explores how to address environ-
mental pressures and impacts in both ex-ante and
ex-post assessments*. Including both ex-ante and ex-
post perspectives allows for an integrated approach
to IA that considers the IA as a cyclical process.
Figure 9 presents the main analytical steps covered
in the guidebook emphasising the connections be-
tween ex-ante and ex-post assessments. In this ap-
proach, the IA is not a one-off exercise, but is part of
an ongoing process of policy learning.
STEP 8
Outline
monitoring and
evaluation
system
STEP 1
Indicate the
objectives of the
policy
intervention
STEP 1
Identify and
scope the
problem
STEP 8
Draw lessons
from IA and
evaluation
STEP 2
Revisit the
intervention
logic of the
intervention
STEP 7
Assess the
impact of policy
intervention
STEP 2
Develop
baseline
scenarios
STEP 6
Measure
probable
impacts of the
options
STEP 5
Map probable
impact
pathways of the
options
STEP 4
Develop policy
options
STEP 3
objectives of the
define the
policy
intervention
STEP 6
Measure
impacts of the
intervention
STEP 5
Map impact
pathways of the
intervention
STEP 4
Compare actual
developments
to the baseline
scenario
STEP 3
Re-sssess the
problem and
related
challenges
POSSIBLE
INTERACTIONS
BETWEEN
IA STEPS
FEEDBACK
LOOPS BETWEEN
EX ANTE AND
EX POST IA
STEP 7
Compare and
select the
preferred option
Ex-post
impact
assessment
Ex-ANTE
impact
assessment
22
Ex-ante and ex-post IA differ in many respects. They have different purpose, scope
and methodology. Whereas ex-ante IA supports the selection and prioritisation of
relevant instruments and projects in line with set objectives, ex-post IA assesses
the extent to which the selected instruments and projects have achieved the de-
sired impacts. In terms of methodology, ex-ante impact assessments will likely
have more qualitative components than ex-post ones. Clearly, explorative or nor-
mative prospective methods may include the use of models and data extrapola-
tion as well as narratives, but uncertainty about future developments means that
outputs of such quantitative methods are more open to interpretation than the
results of most ex-post assessments or evaluations
Ex-ante IA by definition involves more risk and uncertainty. It deals with future that
cannot be “known”. This is particularly true for ex-ante IA of “blue sky” research
and support to radical innovation. This means that IA has to rely on a range of as-
sumptions about probable applications of research, its distance to market, scale
and time of diffusion as well as substitution effects of the innovation. In the de-
sign phase of an intervention or projects of explorative nature, policy makers and
stakeholders have a limited view on possible impacts over time. Expected effects,
especially long-term impacts, are therefore likely to be inaccurate or to lack detail.
Ex-ante IAs tend to overestimate positive impacts of policy intervention, hence the
need to involve a range of experts and stakeholders in the IA process in order to
ensure “future-proofing”.
A degree of uncertainty influences also ex-post assessments and evaluations. Ex-
post IA does not have full information and knowledge on impact mechanisms, es-
pecially in relation to complex processes on the level of societies and economics.
Ex-post IA may suffer from difficulties
Despite evident differences, both ex-ante and ex-
post assessments are based on a similar concep-
tual understanding of causality, attribution and
contribution, and impact pathways. What differs is
the amount of information and knowledge avail-
able for determining causalities and tracing, often
complex, impact pathways. Establishing a learning
loop between two perspectives could improve qual-
ity of public intervention at all levels by offering a
reality check for “cost optimism” in policy and proj-
ect assumptions alike.
The following sections provide guidance on
how to address the environmental dimen-
sion when tackling analytical steps of IA. The
sections provide key questions and recom-
mendations on the scope of the assessments.	
	
Figure 10 presents examples of questions to be
asked when pondering the environmental pressures
and impacts of the assessed intervention.
In both ex-ante and ex-post
exercises consulting external
experts as well as other
stakeholders can contribute
to the robustness and
transparency of assessments.
Depending on the needs and
the nature of the problem
addressed by the policy
intervention, stakeholders can
be consulted about any step
of the IA.
For more detailed material,
including descriptions of
methods, concrete examples
of IA and reflections on how to
conduct IA on different levels
(programme, instrument,
project), the readers are invited
to consult an extended version
of this publication.
23
FIGURE 10. Environmental
dimension of the impact
assessment cycle
STEP 8
Outline
monitoring and
evaluation
system
STEP 1
Indicate the
objectives of the
policy
intervention
STEP 1
Identify and
scope the
problem
STEP 8
Draw lessons
from IA and
evaluation
STEP 7
Compare and
select the
preferred option
STEP 2
Revisit the
intervention
logic of the
intervention
STEP 7
Assess the
impact of policy
intervention
STEP 2
Develop
baseline
scenarios
STEP 6
Measure
probable
impacts of the
options
STEP 5
Map probable
impact
pathways of the
options
STEP 4
Develop policy
options
STEP 3
objectives of the
define the
policy
intervention
STEP 6
Measure
impacts of the
intervention
STEP 5
Map impact
pathways of the
intervention
STEP 4
Compare actual
developments
to the baseline
scenario
STEP 3
Re-sssess the
problem and
related
challenges
POSSIBLE
INTERACTIONS
BETWEEN
IA STEPS
What were the objectives
of the intervention directly
orindirectly (and explicitly
orimplicitly) related
to the environment?
How were the environmental aspects
included into the intervention logic of the
assessed measure (e.g. explicit or implicit
objective, selection criteria of projects,
part of the wider strategy etc)?
Have the originally considered
environmental aspects of the
problem evolved during the
implementation of the intervention?
How have the actual
developments (e.g. level
of pollutions) compared
to the baseline scenario
considered in the design stage?
What have been the
pathways and determinants
of the environmental
pressures and impacts?
What have been the scale
and types of environmental
pressures and impacts
directly or indirectly
caused by the intervention?
What is the overall assessment
of the environmental pressures and
impacts caused by the intervention?
Should further impacts be expected
in an longer time horizon?
What are the lessons learned
about assessing environmental
impacts for the related and
future monitoring systems?
What are the key
environmental aspects of
the problem? Is the
relation to the environment
direct or indirect?
Are the environmental
aspects of the problem
likely to vary in different
baseline scenarios?
Do the objectives explicitly
address the environment?
Is the environment
primary or secondary
focus?
Does the role and
scope o he environ-
mental objectives
differ between the
policy options?
How direct, strong and likely
the impact of the interven-
tion on the environment may
be? What are the main
causal assumptions about
the impacts?
What are the scale
and types of environ-
mental pressures and
impacts likely to be
caused by the options?
How do policy options
compare in terms of their
environmental impact and
the possible trade-offs
and social impacts?
Is there a need
for dedicated environ-
mental indicators to
monitor and evaluate
the intervention?
FEEDBACK
LOOPS BETWEEN
EX ANTE AND
EX POST IA
Ex-post
impact
assessment
Ex-ANTE
impact
assessment
24
Step 1. Identify and scope the problem
The ex-ante IA starts by describing the problem and related challenges that are to be
subject to policy intervention. In order to include an environmental dimension the first
step of any IA should aim to:
•	 Identify and describe key environmental aspects of the problem (note that envi-
ronmental aspects may be directly or indirectly linked to the problem and related
challenges);
•	 Establish main drivers and underlying causes of possible environmental pressures
and impacts related to the problem and the future intervention;
•	 Identify any “wild cards” which could disrupt the expected impacts (positively or
negatively) (this could include cross-impacts with other measures being imple-
mented or discontinued as well as “surprise factors”);
•	 Based on the available studies, data and expertise, verify whether (positive or
negative) environmental pressures and impacts are likely to be significant or
whether they are uncertain;
•	 Decide if IA requires a dedicated IA component focused on environment;
•	 Add environmental indicators to the baseline of the intervention (depending on the
nature of the problem these may be core or secondary baseline indicators).
In case of significant evidence and knowledge gaps it is recommended that the decision
whether to include a stronger emphasis on environmental dimension is taken based on
expert consultations.
2.1.1 Ex-ante impact assessments In order to find a meaningful approach to assessing environmental impacts (and, in
fact, any other impacts), any systemic IA framework has to consider that policy is
intervening in an open dynamic system, where many factors are at play and influence
the outcome of the intervention.
Finding a meaningful level and scope of impact assessment is one of the key decisions
determining the robustness of the overall exercise.
FIGURE 11. Policy intervention and levels of IA
R&I policy
(i.e. policy mix
of different types
of measures)
R&I
instruments
(e.g. R&D funding,
colaborative research,
equity funding,
business advisory
services
Meso-level
impacts
(e.g. sector value
chain)
Micro-level
impacts
(e.g. firm
household)
IA of R&I policy
IA of specific
R&I instruments
IA of specific
R&I projects
Macro level
impacts
R&I
projects
25
FIGURE 12. Methodology of impact assessment applied
by the Green Investment Bank (GIB), UK
The IA considers the following different policy options:
1. Do nothing;
2. Create a fund or consolidate existing ones;
3. Increasing the application of existing Government policies;
4. Create the Green Investment Bank, addressing the market failures
and barriers present in the financial markets (recommended option).
Key assumptions in this IA had to be made in order to estimate a range of portfolios for the
bank. The net present value (NPV) was used to assess the value for money of the different
options, describing the difference between the present value of a stream of costs and a
stream of benefits over time.
The monetised costs considered the different NPVs of different technologies that were to be
included in the portfolio of the GIB and included monetised capital and operating expendi-
ture costs. For the benefits the savings from CO2 emissions avoided and the financial re-
turns of the investments were taken into account. The different NPVs for different technolo-
gies had been estimated by prior work from BIS and Vivid Economics.
The bank is an independent institution that tries to maximise green
impact and profitability, depending on market conditions and the available investments. As
a result, its portfolio of projects cannot be determined beforehand, as it is not a matter of
policy. The results of this IA are usually given considering a range of illustrative portfolios or
through a Monte Carlo analysis considering 90% of the funds committed.
Finally, the results of the IA take into account a level of variation
in certain parameters, such as the level of additionality, the default
rate and the mobilisation rate of private capital.
The Department of Business Innovation and Skills prepared the ex-ante
Impact Assessment (IA) of the GIB in May 2012, to be reviewed around
April 2015. This IA applies to the £3bn committed by the Government
to fund the GIB over the period to 2015, not addressing the potential
costs and benefits thereafter.
Source: Case study of the UK Green Investment Bank
Step 2. Develop baseline scenarios
The fuller account of possible future developments requires explicit consideration of
alternative scenarios of how a baseline will develop. The IA exercises including a stronger
emphasis on a prospective dimension should:
•	 Take into account the baseline, develop a prospective scenario or several
scenarios of possible;
•	 Take into account the baseline and develop a prospective scenario or several
scenarios of possible developments and trends related to the problem, explicitly
concidering relevant environmental trends;
•	 Include sensitivity analysis and risk assessment in the scenario development
taking into account the dimension of natural environment;
•	 Select the most plausible scenario to be a main basis for the design of the policy
options.
Developing scenarios makes the baseline more robust and allows for a better view on
resilience of proposed policy options.
Step 3. Define the objectives of policy intervention
Depending on the problem definition and the wider policy context, environmental aspects
may be a primary or secondary focus of policy intervention:
•	 If the problem and its root causes are linked to the natural environment, make
sure to explicitly include it in the objectives of policy intervention;
•	 If the problem is indirectly linked to the environment, ensure that the objectives
of policy intervention are coherent with existing and upcoming EU regulations,
policies and strategies targeting the natural environment.
Note that the full realisation of possible (negative or positive) impacts on the environ-
ment may be revealed in steps 5 and 6. The IA process should be flexible enough to
allow for iteration between the steps. If new significant insights are gained from the
qualitative and quantitative analysis of the impact pathways, the objectives and op-
tions should be revisited and adjusted accordingly.
26
Step 4. Develop policy options
Explicit inclusion of environmental aspects in policy options will depend on the problem
and on the objectives of the policy intervention. In the case of interventions with high
impact on environment, the criteria should explicitly include environmental pressures
and impacts and reflection on possible synergies and trade-offs between them and other
impacts, notably social and economic impacts.
Policy options should be developed taking into account baseline scenarios and their
differences in terms of environment trends.
Step 5. Analyse the impacts: Qualitative
mapping of probable impact pathways
Qualitative mapping of impact pathways allows for better realisation of possible direct
and indirect impacts of policy intervention on the economy, society and environment.
The mapping aims to:
•	 Identify (direct and indirect, positive and negative) environmental pressures
and impacts of policy options and how they relate to economic and social
impacts of the intervention (causal mechanisms);
•	 Use narratives and visualisations to describe the possible direct and indirect
causal pathways leading to environmental pressures and impacts;
•	 Assess the environmental impacts against the baseline in qualitative terms
(check the proportionality principle);
•	 Consider the risks and uncertainties of the option in relation
to environmental impacts;
•	 Decide if IA requires a dedicated quantitative IA component focused
on the environment.
The IA canvas introduced in this guidebook can serve as a “drawing board” support-
ing thediscussion on the pathways. Qualitative mapping should be supported by readily
available quantitative data. The mapping will allow for a better understanding of the
scale and time when public intervention may contribute to environmental pressures.
Along with the problem definition and baseline it is a sufficient basis for taking a decision
on whether a dedicated quantitative estimate is need for IA. The decision should take
into account the proportionality principle.
Step 6. Analyse the impacts: quantitative estimates
of environmental impacts
Estimating possible impacts should be based on both qualitative and quantitative
evidence. Quantitative IA of R&I should be performed when previous steps suggest
a possibly high impact of policy on the environment. The quantitative assessment
of tangible pressures and impacts should focus on collecting data on R&I effects that
may influence parameters of environmental assessment methods (e.g. physical account-
ing, CBA).
The step aims to:
•	 Analyse available data to verify causality claims and assess
possible environmental impacts of policy options;
•	 If possible and feasible (e.g. depending on the budget, timing as well as type
of data needed), collect primary data to complement existing evidence; focus
on R&I effects that can directly or indirectly influence parameters that can be
linked to environmental assessment methods (e.g. tonnes of CO2 emissions
or materials, etc.);
•	 Assess the impacts against the baseline in quantitative and monetary terms.
The step can also focus on indirect effects of R&I on the environment (e.g. new knowl-
edge to be generated by a research activity). The assumptions on future causalities
should be based on both quantitative and qualitative evidence; the causal claims of
future impacts are subject to many caveats and uncertainties. The latter should be made
transparent in IA reports.
27
FIGURE 13. Assessment criteria used in (ex-ante) IA using RIAM method
Source: overview of criteria from Ijäs et al (2010); more information on RIAM method can be also found on the website of DHI Group
(http://www.dhigroup.com/MIKECUSTOMISEDbyDHI/RIAM.aspx)
Criteria Description Scale
Importance
of the impact
Important to national interest
Important regionaly
Importent to areas outside the lokal context: areas of coverege can be defined as a part of
region
Important only in the local context
No geografical or other recognised importance
4
3
2
1
0
Magnitude
of change
Major positive benefit
Sagnificant improvement in status quo
Improvement in status quo
No change in status quo
Negative change to status quo
Sagnificant negative disadventage or change
Major disadventage or change
+3
+2
+1
0
-1
-2
-3
Permanence
of the impact
causing activity
Permanent or long-term
Temporary and medium-term
Temporary and short-term
No change/ not applicable
4
3
2
1
Reversibility
of impact
Irreversible impact
Slowly reversible impact
Reversible impact
No change/ not applicable
4
3
2
1
Cumulative
synergizm
Obviouse cumulative/ synergic effects with other projects and activities
Cumulative/ synergic impact exists, but not uncertain
Non-cumulative/ single impact
No change/ not applicable
4
3
2
1
The sucestibiity
of the target
environment
The target area is extremly sensitive to environmental changes
The target area is sensitive to environmental changes
The area is stable for the environmental changes caused by the project
No change/ not applicable
4
3
2
1
The Environmental Impact
Assessment methodology
offers the tool “rapid impact assessment matrix”
(RIAM) that allows scoring based on multiple crite-
ria. RIAM is quite flexible, transparent and leaves
a permanent record, which can be independently
checked, validated or updated. The simple, struc-
tured form of RIAM allows re-analysis and in-depth
analysis of selected components in a rapid and
accurate manner. This flexibility makes the method
a powerful tool for both executing and evaluating
IAs. The scales in RIAM allow both quantitative and
qualitative data to be assessed. Being an EIA tool
RIAM is applied to infrastructure projects and can be
adopted with some adjustments in the ex-ante (but
also in ex-post) environmental impact assessment
of research infrastructure support projects
and programmes. The matrix can be extended
by including several dimensions.
The figure presents an overview of the assessment
criteria used by RIAM
28
Step 7. Compare the policy options
In case of policy problems or policy interventions with significant anticipated
environmental impacts it is suggested to:
•	 Compare the positive and negative environmental pressures and impacts
for each policy option;
•	 Present comparisons between policy options by categories of impacts
(e.g. economic, social, environmental) and affected stakeholder groups;
•	 Identify, where possible and appropriate, a preferred option in terms
of environmental pressures and impacts taking into account different
time horizons of impacts and (possible) trade-offs or synergies with
socio-economic impacts.
Step 8. Outline monitoring and evaluation
The monitoring and evaluation system of the policy intervention with anticipated positive
or negative impacts on the environment should include dedicated environmental indica-
tors allowing for measuring the intervention’s environmental performance, at the very
least in terms of achieving the formal environmental objectives or targets. The indicators
should inform later evaluations and assessments of both direct and indirect impacts of
policy. They should be tailored so they can inform established methods of assessing
environmental pressures and impacts.
Figure 14 presents an example of the monitoring and evaluation indicator
system giving a significant consideration to measuring environmental performance
of R&D projects.
29
•• description of the way how the
project results will be exploited
•• additional costs until market intro-
duction
•• expected moment of market intro-
duction (year)
•• expected moment of maximum
turnover
•• newness of the market (existing
and known market, existing and
unknown market, new niche, new
large market)
•• geographical area (NL, Europe,
world)
•• competitive position against alterna-
tives/competitors
•• expected market share
•• expected additional turnover (€)
•• expected year when investments
in the development will be earned
backmarket persistence of the
project result
•• expected cost savings in the com-
pany because of the project results
(and description of cost savings)
•• economic effects with customers
(outside the consortium) because of
the project
•• economic effects with spin-off
companies
•• possible barriers for market accept-
ance
•• expected chance that the project
will be a commercial success for
respondent
•• describe mechanism how environ-
mental effect is obtained
•• define unit for relating the environ-
mental effect to (e.g. kg of product,
power installed in watt)
•• indicate indicate environmental ef-
fect: CO2 emission reduction (tonne
CO2/j); amount of sustainable
energy (TJ/y); energy savings (TJ/y);
savings in raw materials (T/y);
substitution by renewable resources
(tonne/y); reduction of waste
(tonne/y; for each waste stream);
decrease in use of groundwater
(m3/y); decrease in use of drinking
water (m3/y); decrease in emission
of waste water (m3/y); additional
production of drinking water (m3/y);
decrease CO2 combustion (tonne/y);
decrease non-combustion CO2
(tonne/y); decrease CH4 emission
(tonne/y); decrease N2O emission
(ton/y); decrease CF6, HFC, PFC
(tonne/y); decrease NOx emission
(ton/y); decrease SOx emission
(tonne/y); decrease NH3 emission
(tonne/y); decrease VOC emission
(tonne/y); decrease fine dust emis-
sion (ton/y); decrease N (nitrogen)
emission (ton/y); decrease P (phos-
phorus) emission (ton/y); decrease
in noise (number of affected per-
sons); decrease in odour (number of
affected persons); decrease in use
of land space
•• Number of inventions
for which a patent
application has been
submitted
•• Number of EU/ US /
worldwide patent ap-
plications
•• Number of patents
granted
•• Number of expected
patent applications
still to come
•• Number of delivered
PhDs
•• Number of PhDs still
to defend their thesis
•• Number of publica-
tions in refereed
journals
•• Number of publica-
tions in professional
papers
•• Likelihood of technical
success for the project
•• Dependency of com-
mercial success on
technical success
•• History of earlier
cooperation with
other partners
•• Changes in partners
during project execu-
tion
•• New projects with
EET partners
•• Will the cooperation
be continued after
the EET project?
If yes, with which
partners?
•• To what extent
do you think the
consortium capable
ofbringing the pro-
ject to the market?
•• Could you describe
the quality of the
cooperation in the-
consortium (Likert
scale, 1-5)
FIGURE 14. Indicators collected for monitoring and IA of the Dutch EET programme
Source: Case study on the Dutch EET programme
economy ecology Technology CooperationThe Dutch Economy, Ecology, Technology committed
subsidies to R&D projects from consortia
of universities, knowledge institutes and companies,
focusing on building knowledge for realising major
improvements in sustainability and realising both
large environmental improvements as well as good
economic results.
The monitoring system adopted by the programme
assumed the collection of wide range of output and
impact indicators for the economic, ecological and
cooperation impact. Every two years a monitor-
ing report was produced by the Programme Office
to estimate possible programme impacts. The
approach was based on determining effects for
each project and adding these up. Four information
sources are used for the monitoring
report:
•	 the EET database with project outputs
based on the original applications and
the project reports;
•	 an annual survey on the “Standard Outcome
Indicators” (SOI). All project coordinators had
to submit their expectations on effects of all
projects on economy, ecology, technology
and cooperation, as defined by a standard
set of indicators;
•	 discussion with the project consortium on their
assessment of the SOI;
•	 final reports (from projects that were finished).
The following indicators were asked from each
project participant (for quantitative indicators
a most likely estimate, a minimum estimate and
a maximum estimate were asked)
Assessing environmental impacts of R&I-short guide

More Related Content

Viewers also liked

SOCIO-CULTURAL IMPACTS OF TOURISM
SOCIO-CULTURAL IMPACTS OF TOURISMSOCIO-CULTURAL IMPACTS OF TOURISM
SOCIO-CULTURAL IMPACTS OF TOURISMEjay Samson
 
Measuring policy impacts in Africa: Lessons from MAFAP
Measuring policy impacts in Africa: Lessons from MAFAPMeasuring policy impacts in Africa: Lessons from MAFAP
Measuring policy impacts in Africa: Lessons from MAFAPriatenorio
 
Policy Impacts in Davao Watersheds
Policy Impacts in Davao WatershedsPolicy Impacts in Davao Watersheds
Policy Impacts in Davao WatershedsDeclan Hearne
 
GIS For Land Administration
GIS For Land AdministrationGIS For Land Administration
GIS For Land Administrationkylesouza
 
Social, Environmental and Economic Impacts of Bus Rapid Transit Systems
Social, Environmental and Economic Impacts of Bus Rapid Transit SystemsSocial, Environmental and Economic Impacts of Bus Rapid Transit Systems
Social, Environmental and Economic Impacts of Bus Rapid Transit SystemsWRI Ross Center for Sustainable Cities
 
Policy Impact,Evaluation and Change (CoOL J)
Policy Impact,Evaluation and Change (CoOL J)Policy Impact,Evaluation and Change (CoOL J)
Policy Impact,Evaluation and Change (CoOL J)nida19
 
Eia basic concepts_15_dec05
Eia basic concepts_15_dec05Eia basic concepts_15_dec05
Eia basic concepts_15_dec05Shimalsh
 
Concepts Of Land Information Systems Rua 2006
Concepts Of Land Information Systems Rua 2006Concepts Of Land Information Systems Rua 2006
Concepts Of Land Information Systems Rua 2006Jan-Peter Mund
 
Cadastre Information System - GWF 2012, Amsterdam
Cadastre Information System - GWF 2012, AmsterdamCadastre Information System - GWF 2012, Amsterdam
Cadastre Information System - GWF 2012, AmsterdamFernando Gil
 
Sec 2 Geography Impacts of Floods
Sec 2 Geography Impacts of FloodsSec 2 Geography Impacts of Floods
Sec 2 Geography Impacts of FloodsKaren Kang-Lim
 
Land information system in Nepal
Land information system in NepalLand information system in Nepal
Land information system in NepalQust04
 
Environmental Impact Assessment
Environmental Impact AssessmentEnvironmental Impact Assessment
Environmental Impact AssessmentBahadur Prasad
 
Socio-economic and Environmental Impacts of Industries
Socio-economic and Environmental Impacts of IndustriesSocio-economic and Environmental Impacts of Industries
Socio-economic and Environmental Impacts of IndustriesTanmay Srivastava
 
Unit 7 eia and sd
Unit 7 eia and sd Unit 7 eia and sd
Unit 7 eia and sd Kumar
 
Environmental impact assessment m5
Environmental impact assessment m5Environmental impact assessment m5
Environmental impact assessment m5Bibhabasu Mohanty
 
Methods of eia(environmental impact assessment)
Methods of eia(environmental impact assessment)Methods of eia(environmental impact assessment)
Methods of eia(environmental impact assessment)Akhil Chibber
 
Measuring Environmental Policies and Their Economic Impacts
Measuring Environmental Policies and Their Economic ImpactsMeasuring Environmental Policies and Their Economic Impacts
Measuring Environmental Policies and Their Economic ImpactsOECD Environment
 
Environmental Impact Assessment
Environmental Impact AssessmentEnvironmental Impact Assessment
Environmental Impact AssessmentPrithvi Ghag
 
Environmental Impact Assessment and Environmental Audit- Unit III
Environmental Impact Assessment and Environmental Audit- Unit IIIEnvironmental Impact Assessment and Environmental Audit- Unit III
Environmental Impact Assessment and Environmental Audit- Unit IIIGAURAV. H .TANDON
 

Viewers also liked (20)

SOCIO-CULTURAL IMPACTS OF TOURISM
SOCIO-CULTURAL IMPACTS OF TOURISMSOCIO-CULTURAL IMPACTS OF TOURISM
SOCIO-CULTURAL IMPACTS OF TOURISM
 
Measuring policy impacts in Africa: Lessons from MAFAP
Measuring policy impacts in Africa: Lessons from MAFAPMeasuring policy impacts in Africa: Lessons from MAFAP
Measuring policy impacts in Africa: Lessons from MAFAP
 
Policy Impacts in Davao Watersheds
Policy Impacts in Davao WatershedsPolicy Impacts in Davao Watersheds
Policy Impacts in Davao Watersheds
 
GIS For Land Administration
GIS For Land AdministrationGIS For Land Administration
GIS For Land Administration
 
Social, Environmental and Economic Impacts of Bus Rapid Transit Systems
Social, Environmental and Economic Impacts of Bus Rapid Transit SystemsSocial, Environmental and Economic Impacts of Bus Rapid Transit Systems
Social, Environmental and Economic Impacts of Bus Rapid Transit Systems
 
Policy Impact,Evaluation and Change (CoOL J)
Policy Impact,Evaluation and Change (CoOL J)Policy Impact,Evaluation and Change (CoOL J)
Policy Impact,Evaluation and Change (CoOL J)
 
Eia basic concepts_15_dec05
Eia basic concepts_15_dec05Eia basic concepts_15_dec05
Eia basic concepts_15_dec05
 
Concepts Of Land Information Systems Rua 2006
Concepts Of Land Information Systems Rua 2006Concepts Of Land Information Systems Rua 2006
Concepts Of Land Information Systems Rua 2006
 
Cadastre Information System - GWF 2012, Amsterdam
Cadastre Information System - GWF 2012, AmsterdamCadastre Information System - GWF 2012, Amsterdam
Cadastre Information System - GWF 2012, Amsterdam
 
Sec 2 Geography Impacts of Floods
Sec 2 Geography Impacts of FloodsSec 2 Geography Impacts of Floods
Sec 2 Geography Impacts of Floods
 
Land information system in Nepal
Land information system in NepalLand information system in Nepal
Land information system in Nepal
 
Environmental Impact Assessment
Environmental Impact AssessmentEnvironmental Impact Assessment
Environmental Impact Assessment
 
Socio-economic and Environmental Impacts of Industries
Socio-economic and Environmental Impacts of IndustriesSocio-economic and Environmental Impacts of Industries
Socio-economic and Environmental Impacts of Industries
 
Unit 7 eia and sd
Unit 7 eia and sd Unit 7 eia and sd
Unit 7 eia and sd
 
Environmental impact assessment m5
Environmental impact assessment m5Environmental impact assessment m5
Environmental impact assessment m5
 
Methods of eia(environmental impact assessment)
Methods of eia(environmental impact assessment)Methods of eia(environmental impact assessment)
Methods of eia(environmental impact assessment)
 
Measuring Environmental Policies and Their Economic Impacts
Measuring Environmental Policies and Their Economic ImpactsMeasuring Environmental Policies and Their Economic Impacts
Measuring Environmental Policies and Their Economic Impacts
 
EIA Methods
EIA MethodsEIA Methods
EIA Methods
 
Environmental Impact Assessment
Environmental Impact AssessmentEnvironmental Impact Assessment
Environmental Impact Assessment
 
Environmental Impact Assessment and Environmental Audit- Unit III
Environmental Impact Assessment and Environmental Audit- Unit IIIEnvironmental Impact Assessment and Environmental Audit- Unit III
Environmental Impact Assessment and Environmental Audit- Unit III
 

Similar to Assessing environmental impacts of R&I-short guide

Green Building and Technology Unit 3
Green Building and Technology Unit 3Green Building and Technology Unit 3
Green Building and Technology Unit 3Chaitanya Nagare
 
Successes, Failures, and the Road to 2030 - A Study of Emissions from the Nor...
Successes, Failures, and the Road to 2030 - A Study of Emissions from the Nor...Successes, Failures, and the Road to 2030 - A Study of Emissions from the Nor...
Successes, Failures, and the Road to 2030 - A Study of Emissions from the Nor...Rebecca L. H. Briedis
 
Misleading packaging studies: open letter from LCA experts
Misleading packaging studies: open letter from LCA expertsMisleading packaging studies: open letter from LCA experts
Misleading packaging studies: open letter from LCA expertsDario Cottafava
 
Issue-20report-20No-206.pdf
Issue-20report-20No-206.pdfIssue-20report-20No-206.pdf
Issue-20report-20No-206.pdfSnunkhaemEcharoj
 
Data4Impact expert workshop. The Conceptual Framework of Societal Impact of R&I
Data4Impact expert workshop. The Conceptual Framework of Societal Impact of R&IData4Impact expert workshop. The Conceptual Framework of Societal Impact of R&I
Data4Impact expert workshop. The Conceptual Framework of Societal Impact of R&IData4Impact
 
Data4Impact Expert Workshop Report
Data4Impact Expert Workshop ReportData4Impact Expert Workshop Report
Data4Impact Expert Workshop ReportData4Impact
 
Presentación SocietalImpact Daniel Torres
Presentación SocietalImpact Daniel Torres Presentación SocietalImpact Daniel Torres
Presentación SocietalImpact Daniel Torres EC3metrics Spin-Off
 
Environmental Impact assessment
Environmental Impact assessmentEnvironmental Impact assessment
Environmental Impact assessmentDavis Ciprikis
 
EJOLT overview of work
EJOLT overview of workEJOLT overview of work
EJOLT overview of workEnvJustice
 
UNIT – I ptpg final (2).ppt
UNIT – I ptpg final (2).pptUNIT – I ptpg final (2).ppt
UNIT – I ptpg final (2).pptkrpnath1
 
The impact of Science Literacy delivery methods - what works?
The impact of Science Literacy delivery methods - what works?The impact of Science Literacy delivery methods - what works?
The impact of Science Literacy delivery methods - what works?NIDA-Net
 
15020243019_NiharicaOgale_Final_Report
15020243019_NiharicaOgale_Final_Report15020243019_NiharicaOgale_Final_Report
15020243019_NiharicaOgale_Final_ReportNiharica Ogale
 
Environmental_impact_assessment_EIA.pptx
Environmental_impact_assessment_EIA.pptxEnvironmental_impact_assessment_EIA.pptx
Environmental_impact_assessment_EIA.pptxMohamedSherbiny7
 
Auditing implementation of_me_as
Auditing implementation of_me_asAuditing implementation of_me_as
Auditing implementation of_me_asDr Lendy Spires
 
From Niche to Norm _ SEI
From Niche to Norm _ SEIFrom Niche to Norm _ SEI
From Niche to Norm _ SEIHanane Taidi
 

Similar to Assessing environmental impacts of R&I-short guide (20)

Green Building and Technology Unit 3
Green Building and Technology Unit 3Green Building and Technology Unit 3
Green Building and Technology Unit 3
 
Successes, Failures, and the Road to 2030 - A Study of Emissions from the Nor...
Successes, Failures, and the Road to 2030 - A Study of Emissions from the Nor...Successes, Failures, and the Road to 2030 - A Study of Emissions from the Nor...
Successes, Failures, and the Road to 2030 - A Study of Emissions from the Nor...
 
Misleading packaging studies: open letter from LCA experts
Misleading packaging studies: open letter from LCA expertsMisleading packaging studies: open letter from LCA experts
Misleading packaging studies: open letter from LCA experts
 
Issue-20report-20No-206.pdf
Issue-20report-20No-206.pdfIssue-20report-20No-206.pdf
Issue-20report-20No-206.pdf
 
Data4Impact expert workshop. The Conceptual Framework of Societal Impact of R&I
Data4Impact expert workshop. The Conceptual Framework of Societal Impact of R&IData4Impact expert workshop. The Conceptual Framework of Societal Impact of R&I
Data4Impact expert workshop. The Conceptual Framework of Societal Impact of R&I
 
Data4Impact Expert Workshop Report
Data4Impact Expert Workshop ReportData4Impact Expert Workshop Report
Data4Impact Expert Workshop Report
 
State of scientific research in Finland_2016_eng_150317
State of scientific research in Finland_2016_eng_150317State of scientific research in Finland_2016_eng_150317
State of scientific research in Finland_2016_eng_150317
 
Societal Impact
Societal Impact Societal Impact
Societal Impact
 
Presentación SocietalImpact Daniel Torres
Presentación SocietalImpact Daniel Torres Presentación SocietalImpact Daniel Torres
Presentación SocietalImpact Daniel Torres
 
Environmental Impact assessment
Environmental Impact assessmentEnvironmental Impact assessment
Environmental Impact assessment
 
Workshop report
Workshop reportWorkshop report
Workshop report
 
EJOLT overview of work
EJOLT overview of workEJOLT overview of work
EJOLT overview of work
 
UNIT – I ptpg final (2).ppt
UNIT – I ptpg final (2).pptUNIT – I ptpg final (2).ppt
UNIT – I ptpg final (2).ppt
 
The impact of Science Literacy delivery methods - what works?
The impact of Science Literacy delivery methods - what works?The impact of Science Literacy delivery methods - what works?
The impact of Science Literacy delivery methods - what works?
 
15020243019_NiharicaOgale_Final_Report
15020243019_NiharicaOgale_Final_Report15020243019_NiharicaOgale_Final_Report
15020243019_NiharicaOgale_Final_Report
 
Environmental_impact_assessment_EIA.pptx
Environmental_impact_assessment_EIA.pptxEnvironmental_impact_assessment_EIA.pptx
Environmental_impact_assessment_EIA.pptx
 
Societal Impact
Societal ImpactSocietal Impact
Societal Impact
 
Auditing implementation of_me_as
Auditing implementation of_me_asAuditing implementation of_me_as
Auditing implementation of_me_as
 
o-rafferty_phd
o-rafferty_phdo-rafferty_phd
o-rafferty_phd
 
From Niche to Norm _ SEI
From Niche to Norm _ SEIFrom Niche to Norm _ SEI
From Niche to Norm _ SEI
 

Assessing environmental impacts of R&I-short guide

  • 2. Brussels, November 2013 Framework Service Contract Nr 150176-2005-F1SC-BE Edited by: Michal Miedzinski, Technopolis Group (TG) Authors: Rebecca Allinson, TG Erik Arnold, TG Jennifer Cassingena Harper, Malta Council for Science and Technology Asel Doranova, TG Stefan Giljum, Sustainable Europe Research Institute Elina Griniece, TG Klaus Kubeczko, Austrian Institute of Technology Bea Mahieu, TG Anil Markandya, Basque Centre for Climate Research Michal Miedzinski, TG Viola Peter, TG Mathias Ploeg, TG Agnieszka Stasiakowska, TG Geert van der Veen, TG Please cite this study as: Miedzinski et al (2013). Assessing Environmental Impacts of Research and Innovation Policy. Study for the European Commission, Directorate-General for Research and Innovation, Brussels.
  • 3. A short guide to assessing environmental impacts of research and innovation policy Disclaimer: The content of this publication does not reflect the official opinion of the European Union. Responsibility for the information and views expressed in the public lies entirely with the authors. Reproduction is authorised provided the source is acknowledged. © European Union, 2013 I
  • 4. Table of Contents 1. Linking research and innovation policy to environmental impacts........................................... 2 1.1 What is research and innovation policy?................................................................................................................................................................... 2 1.1.1 Effects of R&I policy............................................................................................................................................................................................... 3 1.1.2 Determinants of impacts of R&I policy......................................................................................................................................................... 4 1.2 What are environmental pressures and impacts?................................................................................................................................................5 1.2.1 Introducing environmental pressures and impacts.................................................................................................................................5 1.2.2 Measuring environmental pressures and impacts...................................................................................................................................8 1.3 How to connect R&I policy effects to environmental pressures and impacts?...................................................................................... 10 1.3.1 Qualitative impact pathways.......................................................................................................................................................................... 10 1.3.2 Constructing methodologies and selecting methods of IA................................................................................................................ 17 2. ENvironmental dimension in the analytical steps of impact assessment..........................21 2.3.1 Ex-ante impact assessments.......................................................................................................................................................................... 24 2.3.2 Ex-post impact assessments.......................................................................................................................................................................... 30 General messages.....................................................................................................................................................................33 REFERENCES......................................................................................................................................................................................35 II
  • 5. FIGURE 1. Main components of the IA framework.......................2 FIGURE 2. Main environmental impact categories.......................7 FIGURE 3. Main indicators of environmental pressures...............8 FIGURE 4. Main indicators of environmental impacts................9 FIGURE 5. The IA canvas: extended visualisation of the IA framework.................................................................................12 FIGURE 6. The IA canvas: two examples of instrument-level impact pathways...................................14 – 15 FIGURE 7. Using IA canvas for illustrating cumulative R&I impact pathways......................................................16 FIGURE 8. Linking R&I policy effects and environmental assessment methods........................................ 18-20 FIGURE 9. Impact asessment cycle.................................................... 21 FIGURE 10. Environmental dimension of the impact assessment cycle...........................................................23 FIGURE 11. Policy intervention and levels of IA..........................24 FIGURE 12. Methodology of impact assessment applied by the Green Investment Bank (GIB), UK..........................25 FIGURE 13. Assessment criteria used in (ex-ante) IA using RIAM method......................................................27 FIGURE 14. Indicators collected for monitoring and IA of the Dutch EET programme..................................................29 FIGURE 15. “Technology tracking” system of the AMO..............32 Table of FIGURES III
  • 6. 1 Impact assessment (IA) is a routine practice at the European Commission. In its Impact Assessment Guidelines (EC 2009), the Commission calls for an integrated ap- proach taking into account various dimensions of impacts, notably economic, social and environmental implications of planned public interventions. This publication responds to the need to better account for environmental impacts in assessing research and inno- vation policy. The guidebook complements the official EC guidelines by focusing on the specific challenges and methodological issues of accounting for environmental impacts in IA. The publication extends the scope of the guidelines by considering both ex-ante and ex-post assessments. The publication is addressed primarily to the EC officials and IA practitioners involved in the EC impact assessments of research and innovation policy. The overall approach pro- posed in the guidebook may be of interest also for national, regional or even local govern- ments and practitioners conducting integrated IAs of R&I policies. The guidebook tackles the difficult task of combining various traditions of research and different approaches to IA. The framework connects methods known and used in so- cial science research with evidence and approaches of the natural and concrete sciences. This suggests that the IAs should be not only integrated but trans-disciplinary efforts bringing diverse expertise around the table. This publication should be seen as a modest step in establishing coherent IA framework making use of best available knowledge and evidence from all relevant disciplines. The guide provides an original framework and methodological advice on how to iden- tify, scope and assess the environmental pressures and impacts of research and innova- tion policy. The central assumption in the overall framework is that any integrated assess- ment seeking to identify and measure environmental impacts of R&I need to be based on a robust understanding of the socio-economic effects of public intervention. Without evidence on how fast innovative products diffuse in society and how they are used, for example, we cannot estimate their environmental impact. The central element of the guide is the notion of impact pathways allowing for the scoping of challenging IA assign- ments in which the link to the environment may seem remote at first sight. The publica- tion features an innovative IA tool – the IA canvas – used to visualise impact pathways. The publication offers guidance on the following questions: • How to identify, scope and assess impacts of R&I policy relevant to the environment; • How to account for environmental impacts in the analytical steps of ex-ante and ex-post IA; • How to identify and measure environmental pressures and impacts of R&I: − How to establish impact pathways between R&I policy and environmental impacts; − How to identify and assess external determinants of impacts; − How to classify and measure environmental pressures and impacts, including examples of methodologies and methods, indicators and sources of data. The guidebook comprises two main sections: • Section I “Linking research and innovation policy environmental impacts” introduces an overall IA methodological approach to identify, scope and attribute environmental impacts to research and innovation policy. It also presents a short review of methodologies and metrics that can be used in IA practice to measure the environment-related outcomes and impacts of R&I policy. • Section II “Environmental dimension in the analytical steps of Impact Assess- ment” introduces the step-wise approach to IA and highlights main environmental questions in the analytical steps of ex-ante and ex-post IA. The publication is a digest of a more extensive IA guidebook featuring detailed methodological material, practical examples of IA methods and further reading sections on various aspects of assessing environmental impacts of research and innovation policy. The full version of the guidebook can be downloaded from http://europa.eu/!Xm84ND. About this guide
  • 7. 2 This guide introduces a framework that focuses on the direct and indirect links between public intervention in research and innovation (R&I) with environmen- tal pressures and impacts. The underlying assumption of the methodological framework is that in order to attribute environmental impacts to public interven- tion in R&I, there is a need to identify relevant tangible and intangible outcomes and socio-economic impacts of R&I policy. The latter lead (directly or indirectly) to environmental pressures and impacts. The key components of the framework include: • Public intervention in R&I; • Outputs, outcomes and impacts of R&I policy; • Environmental pressures and impacts of R&I policy; • Causal mechanisms and impact pathways (attribution and contribution claims); • Determinants, including market forces and framework conditions, influencing outcomes and impacts of R&I policy and their environmental impacts. Figure 1 introduces the overall logic of the IA framework. 1.1 What is research and innovation policy? Research and innovation policy supports a range of activities from blue-sky re- search to providing direct and indirect support to technology diffusion. The rationale behind the public intervention in research and innovation (R&I) lies in the presence of market failures that hamper private investments in socially desirable research and innovation and “systems failures” that impede creativity, effectiveness and efficiency of research and innovation systems. 1. Linking research and innovation policy to environmental impacts RESEARCH AND INNOVATION SYSTEM ECO SYSTEM Other areas, icluding macroeconomic and sectoral policies ENVIRONMENTAL IMPACTS OUTPUTS AND OUTCOMES OF R&I POLICY SOCIO ECONOMIC IMPACT OF R&I POLICY Contribution to impacts environmental impacts Determinants of the state of eco-systems Attribution of outputs Contribution to impacts Attribution of and contribution to environmental pressures Determinants of research and innovation systems RESEARCH AND INNOVATION R&I POLICY ENVIRONMENTAL PRESSURES FIGURE 1. Main components of the IA framework
  • 8. 3 The limited consideration of the environment in R&I or the negative environmental impacts of R&I are examples of both market and systems failures. The rationale of a sustainable R&I policy incorporates the dimension of economic, social and environmental impacts. In response to failures, the policy strives to ensure that its outcomes and impacts contribute to or at the very least do not impede the long- term sustainability. Environmental impacts are not considered “external” but are either addressed as a problem or are purposefully avoided. The need for public support of R&I also derives from the system nature of innova- tion. The system model emphasises that the performance of the economy depends also on the linkages and flows of information and knowledge between the differ- ent actors in the innovation system. The different parts of the system are in many respects interdependent, hence the poor performance of any one component puts the performance of the system as a whole at risk. For instance, market take-up of new mobility schemes, like car sharing, is of a systemic nature and will not happen if they are not addressed in relation to availability public transport infrastructure and city planning (e.g. changes in parking facilities and fees). The public sector often has to take the lead in addressing such “bottlenecks” – continuously identi- fying and rectifying structural imperfections by supporting coordination of effort, promoting division of labour and agenda-setting, investing in human capital and networks to ensure the absorption of knowledge. 1.1.1 Effects of R&I policy From inputs to impacts Measuring impacts of policy intervention is performed in order to establish whether and to what extent the intervention is contributing to the specific and overall objectives set out by policy makers. In order to draw lessons for better policy design, evaluation and impact, assessment should cover both intended and unintended outcomes and impacts of policies. In terms of effects of a policy intervention, IA studies differentiate between different ef- fects that range from short-term outputs, being direct “products” of an intervention, to wider impacts on societies, economies and environment. While outputs can be directly attributed to policy intervention, impacts are longer-term and indirect effects of poli- cies. Impacts are often studied at the level of entire economies and societies in which policies are but one of driving forces. Any IA study has to introduce a dimension of in- put: that is, of what has been invested or mobilised in order to achieve intended effects. This guide is based on the following understanding of inputs and effects of policy intervention: • Input: resources mobilised for the implementation of a policy intervention; resources comprise e.g. funding, personnel, infrastructure as well as natural resources; • Output: product or service produced as a direct output from policy intervention; outputs are typically short-term and are intended to lead to results and contribute to intended long-term impacts); • Outcome: results of policy intervention contributing to achieving overall objectives of policy; as such they to lead to desired changes that initially motivated policy intervention; • Impact: typically long-term changes a policy intervention contributes to (impacts can be analysed in many dimensions including socio-economic, technological, cultural, political or environmental). Depending on when they occur, impacts can range from short- to long-term. Classifying outcomes and socio-economic impacts of R&I This guide proposes a simple classification of main types of outputs, outcomes and socio-economic impacts of supported research and innovation activities. Under- standing the nature of effects of R&I policy will allow to create a link between the dimension of socio-economic impacts and environmental pressures and impacts. Typical outputs and outcomes of R&I policy interventions can be grouped in three broad types including new or modified: • Knowledge; • Individual and social practices; • Products, technologies or infrastructures. New or modified knowledge is an essential outcome of R&I policy. Knowledge comes in many forms. It can be theoretical or applied. It can be explicit (codified and trans- ferable) or tacit (informal and intuitive). Knowledge can be generated, modified and diffused. Knowledge is created in a social process of interaction and learning between many actors. It is the mix of old and new, implicit and explicit knowledge that is most likely to influence new policies, practices or products.
  • 9. 4 New or modified social practices and new forms of organisation comprise the second broad type of outcomes. Put simply, this type focuses on R&I outcomes that influ- ence behaviour and forms of organisation of people. One can differentiate between changes at the individual (i.e. consumer, household), organisational (i.e. company) or, more broadly, societal level (e.g. social group). New or modified products, technologies or infrastructures are most common tangible effects of innovation policies. The types of related outcomes can range from devel- oping and testing a product prototype, through introducing a new technology to the market, to supporting a wide diffusion of existing technologies. Outcomes of R&I policy are expected to contribute to wider socio-economic impacts. This guide scopes the impact into five areas: • Knowledge production and learning system; • Policy, regulation and governance system; • Social practice and consumption patterns; • Production system and business models; • Technical infrastructures and built environment. Knowledge production and learning system refers to a system where individuals and organisations engage in collective processes of learning and knowledge production. The system includes both public and private actors and formal and informal exchanges be- tween them. Wider changes in this area may occur in relation to new knowledge gener- ated with support of R&I policy or with new practices. Influencing this system is one of the key overall objectives of R&I policy, as exemplified by the EU support for the ERA The second type of impacts of R&I policy are in the area of policies, regulation and governance. Policies and strategies may be influenced by many factors. Outputs and outcomes of R&I policy may influence public strategies and policies by pointing to new evidence about social or economic processes (e.g. highlighted in a new study) as well as by mobilising the emergence of new visions of economic and social development (e.g. foresight exercises). Modified or new policies may in turn influence products and practic- es of economic and social actors. Regulation and standards, for example, have a direct impact on product design and research and innovation activites of the whole industries. Social practice and consumption patterns relate to the dimension of individual and so- cial practices and consumption patterns in societies. This includes relations between individuals and organisations, but also between individuals and organisations and ar- tefacts (e.g. products and infrastructures) and between individual and organisation and nature. The latter is especially relevant for environmental impacts. Policy intervention on waste, for example, may foster new processes in companies. High prices or bans on certain waste streams may lead firms to introduce new processes and practices (e.g. material substitution) and forms of organisation (e.g. new collaborations). R&I polices may lead to widely-disseminated new practices in households. This can be linked with dissemination of new knowledge (e.g. on daily hygiene) or specific technology (e.g. ICT). Behavioural changes are rarely determined by policies alone. In general, we can observe that over time, a bundle of policies and single events (e.g. outbreak of disease, natural or manmade catastrophe) contribute to a behavioural change. The area of production system and business models concentrates on how the produc- tion system delivers value to users. This includes the production processes (e.g. design and manufacturing of products and technologies) as well as service systems associated with products. On the level of impacts, the focus is on how new or modified goods or services supported by R&I policy diffuse and whether and to what extent they substitute existing products, services or product-service systems (e.g. new mobility systems). Technical infrastructures and built environment are closely related to the production system, but the focus is on how new or modified products (notably new materials and technologies) influence lasting infrastructures and the built environment. The area is introduced to emphasise the relevance of infrastructures for generating or avoiding environmental pressures and impacts. 1.1.2 Determinants of impacts of R&I policy Implementation of R&I policy does not occur in isolation. There are many factors and mechanisms that determine the outcomes and wider impacts of policy intervention. These factors can both enable or hinder intended and unintended effects of policy. The determinants of R&I policy and environmental impacts should be studied in a systemic way taking into account various relevant dimensions and time-horizons. Determinants can be grouped in several dimensions following an extended STEEP* framework, including: • Socio-cultural determinants − Knowledge and learning (capacity to learn and to generate knowledge) *STEEP stands for Social, Technological, Economic, Environmental and Political and is typically used as an analytical structure for studying external factors that influence a studied phenomenon.
  • 10. 5 − Networking (ability to collaborate and capacity to take collective action) − Organisational capacity (ability to create and manage organisations) − Cultural aspects (including value systems influencing consumer behaviour, attitudes towards change and risk etc.) • Technical and technological determinants (e.g. quality of technical infrastructures); • Economic determinants (e.g. market position, demand, access to capital, resource prices); • Environmentaldeterminants(accesstomaterialandnaturalresources, thestateofeco-systems); • Policy and regulatory framework (including legal system, standards and norms, intellectual property rights, fiscal policies, public procurement). There are different internal and external factors playing out at different stages of the intervention. Determinants play different role at micro- (e.g. a firm or a household), meso- (e.g. a sector or value chain) or macro-level. Outputs, outcomes and wider impacts of policies are all to different extents dependent on internal and external determinants. The outputs are the most controllable effects of an intervention as they depend to a large extent on internal capacity (e.g. the competence of the research team, access to equipment or good management). Outcomes and wider im- pacts of policy intervention depend on external determinants to a larger extent. In general, the further away from immediate outputs, the stronger is the inter-dependence of what is intended to be an outcome of an intervention with the external determinants. External, by definition, is not fully controllable and, therefore, implies a degree of risk or uncertainty. 1.2 What are environmental pressures and impacts? 1.2.1 Introducing environmental pressures and impacts The relationships between environmental pressures resulting from changes in human production and consumption activities and their impacts on the natural systems are manifold and complex. Importantly, human activities can be both harmful and favour- able for the natural environment (i.e. they can gener- ate or alleviate the pressures). Economic activities in terms of production and con- sumption require inputs of natural resources (such as materials, energy, water and land) to maintain their functioning (input side). Extraction and process- ing of these natural resources create environmental pressures, such as material or water extraction or land use change. As a result of socio-economic ac- tivities, waste and emissions are released back to nature, also causing environmental pressures on the output side. Both resource extraction and generation of waste and emissions lead to a variety of environ- mental impacts, such as water scarcity or climate change. These various environmental impacts then have feedbacks to the economy and society, for ex- ample, in the form of negative impacts on human health or by necessitating investments into pollution abatement. This framework considers both environ- mental pressures and environmental impacts. Such a framework also allows us to consider life cycle think- ing in the environmental assessment approach. Environmental pressures Four categories of environmental pressures are considered the most important: • Materials as resource inputs and waste outputs; • Water, including emissions to water; • Land, including emissions to soils; • Carbon and air emissions. When evaluating the overall environmental con- sequences, it is important to pay particular at- tention to the inter-linkages between the cat- egories. Only when all types of environmental Environmental pressures Pressures refer to developments in the use of natural resources (materials, energy, water, land) as inputs to human activities, as well as the release of substances on the output side (waste, GHG emissions, air and water pollution). These pressures exerted by society are transported and transformed in a variety of natural processes and cause changes in environmental conditions. Environmental impacts The changes in environmental conditions lead to impacts on the social and economic functions on the environment, such as the provision of adequate conditions for health, resources availability and biodiversity. Impacts often occur in a sequence: for example, GHG emissions cause global warming (primary effect), which causes an increase in temperature (secondary effect), leading to a rise of sea level (tertiary effect), finally leading to loss of biodiversity. Adapted from: (EEA, 1999)
  • 11. 6 pressures are analysed in parallel within one framework can one avoid pursu- ing partial solutions, which minimise pressures in one category through shift- ing problems to another. This aspect is of particular importance when assess- ing the overall environmental effects of R&I projects, programmes and policies. The category of materials comprises all renewable (biotic) and non-renewable (abi- otic) material resources. Renewable materials are divided into the harvested products from agriculture, forestry and fishery. Non-renewable materials comprise fossil fu- els, metal ores and industrial and construction minerals. A full material accounting balance comprises both the inputs of materials for production and consumption ac- tivities, as well as the production of waste on the output side. The unit of measure- ment for materials are mass units, e.g. kilogrammes for assessments on the prod- uct level and metric tonnes for assessments on the level of sectors and countries. The pressure category “water” refers to the uptake (abstraction) and consump- tion of water by human activities. Generally, two main types of water are distin- guished: blue water resources, which refer to surface and ground water; and green water resources, which is the rainwater consumed by plants in agricultural pro- duction. In some concepts, grey water is also included as a third category, indi- cating the pollution of freshwater (Hoekstra and Mekonnen, 2012). Water use is measured in volume units, such as m³ for national studies or litres for product studies. It is mostly expressed with regard to a certain time (e.g. water consumption per year) or in relation to a certain product (e.g. water footprint to produce one cup of coffee). Land cover and land use assessments illustrate the amount of land being appropriated for various human purposes. The total land area is disaggregated into various catego- ries, including arable land for agricultural production, forest areas for timber extraction, pastures for grazing of animals, as well as various types of artificial surfaces used e.g. for mining of materials, infrastructure, manufacturing or private housing (EEA, 2010). It is also important to track the change of land cover, such as the spread of urban areas to the detriment of agricultural areas. Land-related assessments are measured in area units, such as km² or hectares for national studies or m² for product studies. ENERGY is not considered as a sepa- rate environmental pressure category. The reason is that the various environmental pressures generated by en- ergy use are already covered by the other four categories: material aspects (e.g. fossil fuels or biomass) are covered as materials, aspects related to GHG emissions (from fos- sil fuel combustion or from land use change related to bio-energy production) are included in the carbon/emis- sions section, water and land requirements for bio-energy production are considered in the water and land categories. Activities that add greenhouse gases (GHGs, prin- cipally CO2, Methane, nitrous oxides and HCFCs) to the atmosphere induce climate change impact on a number of ecosystems, as well as having an ef- fect on economic activities, health and the demands and supplies of energy. Overall emissions of GHGs are reported nationally by all European countries to the UNFCCC. In the context of R&I assessments, more important are the emissions by activity, mea- sured in carbon dioxide equivalent terms, based on the current and proposed use of fossil fuels and technologies. The aim is to estimate life cycle emis- sions, i.e. from each stage of the production of the fuel through its use, to its final disposal. In addition to the emissions of greenhouse gases, activities that generate carbon are also activities that pro- duce a number of local pollutants that damage hu- man health, crops and materials. Other local pollut- ants that have a notable level of impacts through a number of complex chemical reactions include SOx, NOx and ozone. Estimates of life cycle emissions from different fossil sources and technologies and details of methodologies used are available (Mar- kandya, 2010). Environmental impacts Environmental assessments include a number of different environmental impact categories. In particular methodologies of Life Cycle Assessments (LCA) provide a comprehensive consideration of the various environmental impacts of production and consumption activities. Figure 5 provides a tentative clustering of the most common environmental impact categories, including short descriptions of the nature of each impact. Three areas can be identified, where impacts occur: they can negative- ly affect human health, the natural environment (ecosystems) and natural resources (Sala et al., 2012). Land Materials Carbon and air emissions Water
  • 12. 7 Source: Adapted from Sala et al. (2012) Figure 2. Main environmental impact categories Climate Change The potential of environmental pressures exerted by GHG emissions (such as carbon dioxide from combustion of fossil fuels or methane from agricultural production) to cause changes in the temperature of the atmosphere and thus to contribute to climate change. Human health Natural environment Photochemical ozone creation Photochemical ozone is created by radiation from the sun and some chemical substances, which result from incomplete combustion of fossil fuels (such as nitrogen oxides and hydrocarbons), leading to negative impacts on both human health and agricultural production. Human health Natural environment Ozone depletion While photochemical ozone is created on ground levels, other ozone-depleting substances (such as CFCs and halons used in refrigerators) lead to stratospheric ozone depletion, which reduces the potential of the atmosphere to hold back harmful radiation, in particular ultra violet radia- tion, from space. Human health Natural environment PM, Respiratory emissions Emissions of particulate matter as well as secondary particles resulting from chemical reactions with nitrates and sulphates are harmful to health. They are the by-product of combustion of fossil fuels Human health Ecotoxicity Ecotoxicity is caused by persistent chemical substances, i.e. substances, which are not degradable by the natural systems and exert toxic effects. They include, for example, dioxins from waste incineration, asbestos from insulation materials and heavy metals from various products. Human health Natural environment Ionising Radiation Ionising radiation can stem from both human sources, such as nuclear power plants, as well as natural sources, such as space radiation. The impact of exposure to radiation depends on the accumulated dosage derived from inhalation, water and food. Human health Natural environment Acidification Acidification is caused by chemical substances (such as nitric acid or sulphuric acid, e.g. from electrolytes in lead-acid batteries and from clean- ing agents) and can damage water bodies, fish stocks, soils and forests. Natural environment Eutrophication Eutrophication occurs when excessive amounts of nutrients, such as nitrate or phosphate, reach ecosystems, e.g. through the application of fertilisers or sewage. This leads e.g. to “algae blooms” in waters. Natural environment Human toxicity This aggregated impact category illustrates the negative health impacts on humans stemming from the emission of toxic chemicals and sub- stances. Human health Abiotic resource depletion Abiotic resource depletion refers to reductions in the available stocks of fossil fuels, metal ores and other minerals, potentially causing raw material shortages on markets and related price increases. Natural resources Water scarcity Water scarcity occurs in a situation, where the abstraction of fresh water is exceeding the rate of renewal in the respective water body, leading to water shortages or droughts. Natural resources Land use competition Land use competition is generally increasing and a result of multiple and growing demands, such as land for the production of food, feed, biofu- els and biomaterials. This growing demand meets a limited stock of available productive land. Natural resources Loss of fertile land Loss of fertile land, e.g. due to soil erosion, is one commonly observed result of land being used too intensively Natural resources Impact category Brief description of impact category Has Impact On:
  • 13. 8 The indicators that measure this pressure can be considered at three levels: • The micro level, which covers two areas: − products or services where R&I can change environmental pressures per unit produced − individuals, households or organisations, where R&I may involve changes that alter the impact of households, consumers and other user institutions on the environment; • The meso level (industries, value chains), where the R&I may change standards and practices; • The macro level (countries, regions) where an aggregation of effects at the micro and meso -levels feed through to pressures that change national indicators of environmental pressure. Figure 3 presents main indicators of environmental pressures currently being used for the three main levels of economic activities. The indicators vary in their degree of methodological refinement and standardisation. Indi- cators at the product and the national level are gener- ally more advanced and more frequently applied than indicators at the level of households or industries. Note that most of the indicators take a life cycle perspective and thus are robust against dislocation of environmen- tal burden, e.g. through outsourcing from one country to another. Considering all levels of economic activities is of key impor- tance, in order to evaluate the overall environmental effects of R&I activities. R&I investments often lead to the development of more resource efficient products and services, thus reducing the material or energy costs for the producer and/or the consumer. FIGURE 3. Main indicators of environmental pressures Micro level Meso level Macro level Products / Services Consumers / Households / Organisations Industries / Value chains Countries / Regions Materials1 (mass units: kg or tonnes) Material Input per Service unit (MIPS) Material use per consumer, household or organisation Material use by industry Domestic/Raw/ Total Material Consumption (DMC/RMC/TMC); Physical Trade Balance Water2 (volume: units: litres and m³) Use per unit of output of good or service. Product water footprint. Use per household or institution by type of water Use by industry by type of water National water abstraction Water Exploitation Index (withdrawal relative to supply National water footprint (incl. embodied water) Land3 (area units: m² or hectares) Land requirement per unit of good or service. Product land footprint Land demand per households or institution by type of land (brownfield vs. greenfield) Demand by type of land (brownfield versus greenfield) Degree of urban spread. Land conversion from one type of land to another. National land footprint (incl. embodied land) Carbon and Air4 (mass units: kg or tonnes) Embodied GHG emissions per unit of good or service. Embodied emissions of key pollutants (small particles, SOx, NOx, VOCs, ozone) per unit of good or service GHG emissions per household. Emissions key air pollutants per household. GHG emissions per unit of output and overall by industry. Emissions of key pollutants per unit of output and overall by industry National emissions data for GHGs and associated pollutants. National carbon footprint (incl. embodied GHG emissions) 1.2.2 Measuring environmental pressures and impacts 1. Where possible estimates should be based on a LCA of materials use. 2. Where possible estimates should be based on a LCA of wa- ter requirements. Water use changes by time of year may be important. Type of water refers to the use of green, blue and grey water. Changes in emissions of harmful pol- lutants to water may be relevant in some cases. 3. Land use change may be more environmentally damag- ing in some locations than others. Some indicator of importance of land affected in terms of biodiversity and ecosystem services may be required. 4. Where possible estimates should be based on LCA of GHG emissions and associated local pollutants.
  • 14. 9 FIGURE 4 provides a summary of the main indica- tors of environmental impacts, classifying them un- der the four headings of materials, water, land and carbon/air. These areas are mapped into the impact categories of human health, the natural environment and natural resources. In addition a fourth category of impacts has been added, which is the economy. This is included to pick up the costs of different areas of impact on economic agents For companies this can help to increase production and market share, as the products become more com- petitive. For consumers, this may lead to a change in behaviour, in which a product or service is used more intensively (because it is cheaper to use) or other products and services are consumed with the money saved. These often unintended effects of technologi- cal improvements are known as “rebound effects”. Supporting R&I to improve the environmental perfor- mance of products and services alone may not lead to the desired improvement for society as a whole. FIGURE 4. Main indicators of environmental impacts In the FP5 project “MOSUS” (Modelling opportuni- ties and limits for restructuring Europe towards sustainability), the effects of expected increases in material productivity of industrial sectors were simulated with an economic-environment model. Based on empirical evidence from environmental consultants that up to 20% of material costs can be saved without compromising profitability (Fis- cher et al., 2004), the team modelled the economy- wide impacts of a consultancy programme, which supports companies to exploit this potential. The overall economic effects of implementing such a programme were positive, as material cost re- ductions stimulated economic growth and employ- ment. However, the measures did not lead to an absolute reduction of material use due to rebound effects. It was therefore concluded, that in order to balance economic and environmental goals, strate- gies to increase material efficiency in the produc- tion sphere need to be complemented by macro- economic measures such as material input taxes or other fiscal measures (Giljum et al., 2008). Area On the natural environment Consumers / Households / Organisations On natural resources On amenity and economy Materials Concentration of heavy metals Concentrations of PAH, PCB and mercury Concentration of heavy metals Concentration of PAH, PCB and mercury Concentration of dioxins, lead Concentrations of radioactive materials Rates of extraction relative to deposits Costs of treatment of wastes generated Prices of extracted materials Water Salinity of aquifers Index of eutrophication Entry of invading species SO2 and NOx deposition Faecal concentrations in recreational waters Nitrate concentrations Rates of abstraction relative to rates of recharge Costs of treatment of water as a function of pollution loadings. Land3 Wetland loss due to drainage Estimated loss of genetic resources SO2 and NOx deposition Surface disposal of mineral working deposits Accidental fires Deposition of radioactive materials on soil Deposition of heavy metals on soil Leaching of waste from landfills Loss of greenfield areas Erosion Changes in fertility Costs of treatment of wastes to land Carbon and Air emissions Stratospheric ozone concentration Loss of land due to sea level rise Concentrations of local air pollutants (PM, VOCs) Concentration of tropospheric ozone Costs of insurance against extreme events Source: adapted from (Markandya and Dale, 2001)
  • 15. 10 1.3.1 Qualitative impact pathways This section introduces the overall logic of how to identify and analyse outcomes and impacts of R&I that are likely to decrease or increase environmental pressures and im- pacts. In general, the further “upstream” is supported research and innovation activity, i.e. the further it is from its final application, the higher is the uncertainty related to as- sessing its wider outcomes and impacts, including its environmental impacts. In other words, the more assumptions one has to make about potential environmental impact of the investment in R&I. This uncertainty is reduced in ex-post assessments, but the complexity and practical difficulty of attributing environmental impacts to research activities remain significant (e.g. considerable time lags, cumulative causation etc). Direct pressures and impacts of R&I on environment Direct pressures and impacts on environment are caused by these R&I policy effects that directly contribute to a quantitative change of environmental pressure, notably the use of material, land, water and of the level of emissions of C02 and other harm- ful substances. Importantly, the effects of R&I policies can lead to either decreasing or increasing pressure of human activity on the environment. The most evident types of R&I outcomes causing measurable environmental pressures are new or modified products and individual and collective practices. While products require resources and cause emissions throughout their life cycle, individual or collective practices contribute to environmental pressures through consumption processes. Attributing environmental pressures to products and practices on the micro level is a relatively straightforward exercise. A simplified impact pathway in this case is as follows: policy intervention – new product or practice – environmental pressure – environmental impact. Any assess- ment of environmental pressure should be performed taking into account the whole life cycle of the product or service and associated material and energy use and emissions. A more challenging scope of IA is to analyse wider socio-economic impacts at the meso (e.g. value chain) or macro level (e.g. a country). Here the analysis needs to take into account the scale and dynamics of diffusion as well as possible substitution and rebound effects related to the diffusion of the new product or service. Environmental pressures and impacts should be thus calculated not by a simple aggregation of micro- level pressures and impacts of the analysed product, but need to take into account how the diffusion of the product influences other existing products fulfilling similar functions. The assessment of environmental pressures of products should also take into account how the use of artefacts influences individual or collective practices associated with their use and, conversely, how existing practices influence the use of artefacts. Thus the impact pathway comprises: policy intervention – new product or practice – associ- ated practices and patterns of use or associated products – substitution and rebound effects - environmental pressures – environmental impacts. Indirect pressures and impacts of R&I on the environment Indirect pressures and impacts on the environment are caused by these R&I policy ef- fects that have a potential to influence tangible products, infrastructures and individual or collective practices that cause measurable environmental pressures and impacts. The R&I policy outcomes that can influence the development of products and practices are new or modified knowledge and policies. Knowledge in its many forms plays a fundamental role in development of all new products and practices as well as policies. Tracing exact historical origins of any product back to its original idea and then follow- ing its subsequent development is a difficult, perhaps impossible, exercise. Tracing the knowledge origins of new products (and thus their environmental impacts) is, however, possible in the case of ex-post IA. Consequently, an impact pathway that departs from policy intervention with a potential indirect environmental pressure (e.g. support to collaborative research) will be more complex than in the case of interventions with tangible outcomes. This type of exercise, however, can bring novel insights on the role of policy intervention. Estimating actual environmental pressures of new knowledge can be based on as- sumptions and projections. The robustness and significance of such ex-ante exercises will depend on “distance” between knowledge and its application (distance to exploita- tion or distance to market). The precision of IA will be higher when it is known how the knowledge is actually exploited. For example, the estimates may prove more or less accurate for applied knowledge (e.g. industrial design) in terms of material require- ment and C02 emissions of a resulting product prototype (micro level). The actual 1.3 How to connect R&I policy effects toenvironmental pressures and impacts?
  • 16. 11 environmental pressures may be, however, different when the product goes into ex- tensive production. They will further change depending on how the product is diffused and used. Until knowledge ‘materialises’ in the form of artefact or practice, any IA has to be based on assumptions of what environmental pressures will be caused. Ex-ante estimates of environmental impacts of basic research face even longer dis- tance to exploitation and thus are even more challenging, if meaningful, to perform. This does not mean that ex-ante IA is not a valuable exercise. Ex-ante IA should not be about precision when precise estimations are unfeasible or speculative. It should be robust enough to indicate an overall direction of intended outcomes and impacts of the intervention. More precise IA in terms of knowledge-oriented interventions may be required when distance to exploitation is very short (e.g. research projects resulting in industrial designs, product prototypes etc). New findings resulting from research projects may result in new or modified policies. New policies based on these findings can significantly influence both product design as well as individual and collective practices of companies and households. The overall logic of indirect impact of policy is that it may “empower” knowledge by translating it into policy instruments and regulatory framework, including norms and standards. Cumulative impacts of R&I policy intervention on the environment Cumulative impacts result from the combined effects of multiple processes. The im- pact of a single policy intervention, for example, may not be significant on its own. When combined with other policy interventions or other processes, however, the com- bined effect may become more significant and better understood. Cumulative impact can be defined as an impact resulting from accumulated effects of various policy interventions and order determinants that affect the process or target group under consideration. In assessing the cumulative impact of R&I on the environment one needs to consider: • Policy mix of relevant policy interventions that can influence the impact; • Determinants of impact in the R&I system and the environmental system which can enable or impede effects of the intervention; • Temporal perspective (or temporal coherence) in order to capture relevant effects that take place over time and influence the measured environmental impact. Introducing the IA canvas This guide offers a practical tool for illustrating and analysing impact pathways. Figure 5 introduces an extended IA canvas that allows to (literally and figuratively) draw the lines between, on the one hand, outcomes and socio-economic impacts of R&I policy and, on the other hand, the main areas of environmental pressures and impacts. The framework can be used as a drawing board to identify direct or indirect pressures and impacts on environment and to qualitatively analyse complex impact pathways. The speed and scale of effects spreading along impact pathways need to be analysed taking into account internal and external determinants of R&I. The canvas helps to visualise the distance between the intervention and possible envi- ronmental pressures and impacts. It makes it clear that environmental pressures and impact can be only assessed following the analysis of intended and unintended socio- economic outcomes and impacts of the intervention under focus. The tool can be used to illustrate complex impact pathways with feedback loops and iterations between dif- ferent types of effects and external determinants. Importantly, it allows for identifying second- and higher-order effects and for iterating the impact pathway “up and down” the picture that is between micro, meso and macro level effects.
  • 17. 12 ECO SYSTEM Other policy areas, including macroeconomic and sectoral policies RESEARCH AND INNOVATION R&I POLICY MIX DIRECT ATTRIBUTION OF ENVIRONMENTAL PRESSURES RESEARCH AND INNOVATION SYSTEM New or modified knowledge New or modified behavior and forms of organisation Determinants of research and innovation (market trends, absorption capacity and technology readiness, regulatory, institutionaland cultural aspects) Determinants of the state of environment (state of eco-systems, natural resource use patterns etc) Impacts on eco-systems and biodiversity Impacts on human health Impact on natural resources Use of waterEmissions to air, water and soils Use of materials, incl. energy carriers Contribution to wider socio-economic impacts Attribution of and contribution to environmental pressures Attribution of R&I policy outputs and outcomes Research infrastructure Collaborative research Marie Curie -Skłodowska actions Public-private & public-public partnerships Enhancing capacity of SMEs Direct support SMEs Access to finance Public procurement & standards New or modified products technologies and infrastructures Production system and business models Knowledge generation and learning system Policy, regulation and governance system Social practice and consumption patterns Contribution to environmental impacts Technical infrastructures and built environment Use of land Impacts on amenity and economy Basic research (ERC) ENVIRONMENTAL PRESSURES OUTPUTS AND OUTCOMES OF R&I POLICY SOCIO ECONOMIC IMPACTS OF R&I POLICY ENVIRONMENTAL IMPACTS FIGURE 5. The IA canvas: extended visualisation of the IA framework
  • 18. 13 There are numerous possible impact pathways between policy intervention in R&I and environmental impacts. The IA canvas allows to visualise diverse impact pathways from outputs to impacts of R&I policy intervention. The tool can be equally useful in supporting the counterfactual analysis and, for example, comparing possible impact pathways of the planned intervention with what would happen in absence of the policy measure. The visualisations point to where evidence supporting causality assumptions on ef- fects of policy intervention needs to be collected and analysed. One of the useful ap- proaches to describe and analyse impacts pathways can be narratives (or story lines) of impact pathways. Narratives make it easier to indicate where causality assumptions about impact of policy intervention on wider socio-economic and environmental im- pacts are made. Figure 6 shows illustrative impact pathways of two R&I instruments: funding basic research and direct support for SMEs. These two instruments have very different im- pact narratives. On the one hand, R&I policy funds curiosity-driven basic research by providing grants to researchers. Illustrating impact pathways of such an instrument, especially ex-ante, is challenging and often speculative due to an explorative nature of basic research and the long dis- tance and time lag between the supported activity and its wider impacts. The environ- mental impacts of basic research will depend, inter alia, on whether, how and when the new knowledge generated by research activity influences products, practices or policies (see the top IA canvas in Figure 6). On the other hand, R&I policy may choose to directly support a wider diffusion of ex- isting technological innovation by providing subsidies to SMEs for purchasing environ- mental technologies. This example demonstrates a more straightforward impact path- way and a shorter impact narrative based on relatively simple causal assumptions. In this case, the environmental impacts will depend, inter alia, on the attributes of the technology supported (e.g. how much material and water it saves compared with existing alternatives) and the projected or achieved ratem of diffusion of technology (e.g. how many companies adopt the technology and how large are their production volumes; see the bottom IA canvas in Figure 6). Clearly, even such a “simple” narrative may suffer from unexpected developments (e.g. the emergence of alternative more cost-effective solution or market downturn) that can make the public support for the technology obsolete. The complementary use of prospective studies and foresight could help in anticipating unexpected barriers, especially in case of impact pathways of public interventions that deliberately aim at disruption and more radical innovation. The IA canvas can also be used to visualise cumulative impact pathways. Figure 7 provides an illustration of how to demonstrate potential cumulative effects of two selected instruments: support for basic research and direct support to SMEs. The canvas allows first, to overlay two pathways and, second, to identify phases in which impact pathways may “connect” and create cumulative impact. In the example explored, cumulative effects occur between measures following different timeframes of expected outcomes and impacts. By identifying direct and indirect effects of two in- struments, ranging from second- to fifth-order effects, the canvas allows for including a temporal dimension to the analysis (i.e. how long it may take before certain cumula- tive effects may occur). The impact pathways need to be supported with qualitative and quantitative evidence to substantiate claims about the relationship between public intervention and an expected or observed effect.
  • 19. 14 ECO-SYSTEM Other policy areas, including macroeconomic and sectoral policies RESEARCH AND INNOVATION (R&I) POLICY MIX DIRECT ATTRIBUTION OF ENVIRONMENTAL PRESSURES RESEARCH AND INNOVATION SYSTEM New or modified behavior and forms of organisation Determinants of research and innovation (market trends, absorption capacity and technology readiness, regulatory, institutionaland cultural aspects) Determinants of the state of environment (state of eco-systems, natural resource use patterns etc) Impacts on eco-systems and biodiversity Impacts on human health Impact on natural resources Use of water Contribution to wider socio-economic impacts Attribution of R&I policy outputs and outcomes Research infrastructure Collaborative research Public-private & public-public partnerships Enhancing capacity of SMEs Direct support SMEs Access to finance Public procurement & standards New or modified products technologies and infrastructures Knowledge generation and learning system Contribution to environmental impacts Technical infrastructures and built environment Use of land Impacts on amenity and economy Basic research (ERC) A A A A A A A A A A FF F D D D D F F Attribution of and contribution to environmental pressures ENVIRONMENTAL PRESSURES OUTPUTS AND OUTCOMES OF R&I POLICY SOCIO- ECONOMIC IMPACTS OF R&I POLICY ENVIRONMENTAL IMPACTS Production system and business models Social practice and consumption patterns Emissions to air, water and soils Use of materials, incl. energy carriers New or modified knowledge Marie Curie -Skłodowska actions Policy, regulation and governance system FIGURE 6. The IA canvas: two examples of instrument-level impact pathways Legend: indicative IA pathway from basic research (ERC) to environmental impacts A - attribution decision/causality mechanism D – determinants F – feedback
  • 20. 15 ENVIRONMENTAL PRESSURES ECO-SYSTEM Other policy areas, including macroeconomic and sectoral policies RESEARCH AND INNOVATION (R&I) POLICY MIX OUTPUTS AND OUTCOMES OF R&I POLICY SOCIO- ECONOMIC IMPACTS OF R&I POLICY ENVIRONMENTAL IMPACTS DIRECT ATTRIBUTION OF ENVIRONMENTAL PRESSURES RESEARCH AND INNOVATION SYSTEM New or modified knowledge New or modified behavior and forms of organisation Determinants of research and innovation (market trends, absorption capacity and technology readiness, regulatory, institutionaland cultural aspects) Determinants of the state of environment (state of eco-systems, natural resource use patterns etc) Impacts on eco-systems and biodiversity Impacts on human health Impact on natural resources Use of waterUse of materials, incl. energy carriers Contribution to wider socio-economic impacts Attribution of R&I policy outputs and outcomes Research infrastructure Collaborative research Public-private & public-public partnerships Enhancing capacity of SMEs Direct support SMEs Access to finance Knowledge generation and learning system Policy, regulation and governance system Social practice and consumption patterns Contribution to environmental impacts Technical infrastructures and built environment Use of land Impacts on amenity and economy Basic research (ERC) A A A A A A A A FF F D D D D F F Attribution of and contribution to environmental pressures Public procurement & standards New or modified products technologies and infrastructures Production system and business models Marie Curie -Skłodowska actions Emissions to air, water and soils FIGURE 6. The IA canvas: two examples of instrument-level impact pathways (continued) Legend: indicative IA pathway from from direct support to SMEs (product development) to environmental impacts A - attribution decision/causality mechanism D – determinants F – feedback
  • 21. 16 ECO SYSTEM Other policy areas, including macroeconomic and sectoral policies RESEARCH AND INNOVATION R&I POLICY MIX DIRECT ATTRIBUTION OF ENVIRONMENTAL PRESSURES RESEARCH AND INNOVATION SYSTEM New or modified knowledge New or modified behavior and forms of organisation Determinants of research and innovation (market trends, absorption capacity and technology readiness, regulatory, institutionaland cultural aspects) Determinants of the state of environment (state of eco-systems, natural resource use patterns etc) Impacts on eco-systems and biodiversity Impacts on human health Impact on natural resources Use of waterEmissions to air, water and soils Use of materials, incl. energy carriers Attribution of R&I policy outputs and outcomes Research infrastructure Collaborative research Public-private & public-public partnerships Enhancing capacity of SMEs Direct support SMEs Access to finance Public procurement & standards New or modified products technologies and infrastructures Production system and business models Knowledge generation and learning system Policy, regulation and governance system Social practice and consumption patterns Contribution to environmental impacts Technical infrastructures and built environment Use of land Impacts on amenity and economy Basic research (ERC) Other policy areas, including macroeconomic and sectoral policies DIRECT ATTRIBUTION OF ENVIRONMENTAL PRESSURES DIRECT ATTRIBUTION OF ENVIRONMENTAL PRESSURES 1 2 2 3 F F A A FF F D D D D F 2 3 C1 C2 C3 2 1 3 4 3 4 2 5 2 5 2 5 A Contribution to wider socio-economic impacts Attribution of and contribution to environmental pressures ENVIRONMENTAL PRESSURES OUTPUTS AND OUTCOMES OF R&I POLICY SOCIO ECONOMIC IMPACTS OF R&I POLICY ENVIRONMENTAL IMPACTS Marie Curie -Skłodowska actions FIGURE 7. The IA canvas: illustrating cumulative R&I impact pathways Legend: cumulative IA pathway from basic research and direct support to SMEs (product development) to environmental impacts Numbers on the pathways indicate the order of effect attribution (or contribution) to policy intervention (e.g. 1 stands for 1st order or direct effect, 2 for 2nd order effect, 3 for 3rd order effect etc.). The pathways can be analysed by following the order of effect. Second- and higher-order effects are all indirect effects. C – potential cumulative impact (phases in which various impact pathways may create cumulative impact) D – determinants F – feedback
  • 22. 17 1.3.2 Constructing methodologies and selecting methods of IA Constructing IA methodologies to analyse and measure effects of R&I policy is chal- lenging as it requires connecting approaches used by social sciences with environmen- tal assessment methods rooted in natural and physical sciences. The central question is how to make the link between, on the one hand, quantitative and qualitative evi- dence on effects of R&I and, on the other hand, methodological frameworks focused on environmental pressures and impacts. Creating these connections in practice may require a dedicated research and modelling effort. In general terms, there are two ways to connect evidence on R&I policy effects and environmental pressures and impacts: • Direct relationship: evidence on changes in products and behaviours due to R&I policy that can be measured using parameters that are also used by environ- mental assessment methods (e.g. changing in material requirements of prod- ucts measured in kilos, water use measured in litres or volumes, emissions measured in kilos etc); • Indirect relationships: evidence on changes in knowledge (e.g. technical knowl- edge, social awareness etc) due to R&I policy that may influence products and behaviours which may influence environment. This can be referred to as sec- ond- and higher-order effects. This evidence is often qualitative (e.g. changed attitudes towards nature or towards technology in society). FIGURE 8 illustrates how evidence on outcomes in the areas of knowledge, practic- es and processes and products and technologies can inform environmental assess- ment methods and methodological frameworks. The table differentiates between evidence gathered at micro (e.g. product, individual, organisation) and meso-macro (e.g. sector, socio-technical system) levels. The table can accompany the IA canvas suggesting type of evidence and meth- ods underlying different the IA pathways. Evaluations and IA of research and in- novation policy use a wide range of social science methods to capture effects of policies. The table suggests methods, types and nature of evidence relevant for assessing environmental pressures and impacts along with data selection and analytical methods. The availability of relevant evidence in practice will depend on whether the intervention explicitly aims at reducing environmental impacts. Programmes or instruments with environmental objectives are more likely to include relevant indictors in their monitoring and evaluation systems whereas interventions without an evident environmental dimension will focus on gathering evidence of a different nature. The availability and quality of programme data is therefore one of the fundamental factors assuring robustness of IA.
  • 23. 18 New or modified knowledge Is the new or modified knowledge relevant? Was / is new or modified knowledge leading to changes in behaviour or products and services?   Micro Quantitative and qualitative evidence on new knowledge relevant for environment resulting from policy support Qualitative and quantitative evidence on new knowledge contributing to innovative practices and new products Data collection: Internal programme data Bibliometrics and patent data Survey-based enquiries on R&I structural data (e.g. funding, innovation collaboration) Interviews Data analysis: Counterfactual analysis Case studies Historical tracing Expert-based methods (e.g. expert panels) Foresight (e.g. scenarios) Mixed methods: Experimental methods (e.g. Living Labs) Input to analysis in the framework of sustainability impact assessments (SIA) or strategic environmental assessments (SEA) Meso-macro Quantitative and qualitative evidence on diffusion of new knowledge and social learning generated with policy support Qualitative and quantitative evidence on new knowledge contributing to diffusion of (new or existing) practices and (mew or existing) products Qualitative and quantitative evidence on new knowledge contributing to new or reviewed policies and regulatory decisions relevant for environment Data collection: Internal programme data (aggregated) Bibliometrics and patent data Survey-based enquiries on R&I structural data (e.g. funding, innovation collaboration) Interviews Data analysis: Contribution analysis Counterfactual approaches Historical tracing Expert methods (expert panels) Foresight methods (e.g. scenarios) Input to analysis in the framework of sustainability impact assessments (SIA) or strategic environmental assessments (SEA) FIGURE 8. Linking R&I policy effects and environmental assessment methods Areas of R&I policy outcomes Relevance of R&I for environmental pressures and impacts Level of enquiry Evidence relevant for assessing environmental pressures and impacts Possible data selection and analytical methods Possible input to environmental assessment methods and frameworks
  • 24. 19 New or modified behaviour, processes and forms of organisa- tion What are / will be the changes in en- vironmental pres- sures and impacts resulting from innovative prac- tices, processes and organisa- tional changes supported by the research and in- novation policy? Micro Quantitative evidence on changes in resource use and emissions resulting from innovative processes, organisational changes or individual or collective prac- tices (compared to existing alternatives) Qualitative and quantitative evidence on causal mechanisms leading to new prac- tices or processes (e.g. resulting from new knowledge, products or policies) Data collection: Internal programme data Survey-based enquiries Interviews, focus groups Data analysis: Expert methods (expert panels) Case studies Foresight methods (e.g. scenarios) Mixed methods: Experimental methods (e.g. Living Labs) Ecological Footprint Material Input per Service Unit (MIPS) CBA/CE Multi Criteria Analysis Meso- macro Quantitative evidence on changes in material, water, land use and emissions due to innovative processes, organisation- al changes or individual or collective practices (aggregated) Qualitative and quantitative evidence on causal mechanisms leading to diffusion of new practices or processes (including links with products and systemic determinants e.g. institutional lock-ins, social acceptance, regulatory framework etc) Data collection: Internal programme data (aggregated) Survey-based enquiries on R&I structural data (e.g. funding, innovation collaboration) Interviews Data analysis: Contribution analysis (meso-macro) System dynamics Case studies (e.g. value chains) Foresight methods (e.g. scenarios) Ecological Footprint Physical accounting (indirect input based on the importance of new prac- tices for changing the material flow) Input-output analysis (indirect) Supply chain analysis CBA/CE Multi Criteria Analysis Adjusting GDP (monetary) FIGURE 8. Linking R&I policy effects and environmental assessment methods (continued) Areas of R&I policy outcomes Relevance of R&I for environmental pressures and impacts Level of enquiry Evidence relevant for assessing environmental pressures and impacts Possible data selection and analytical methods Possible input to environmental assessment methods and frameworks
  • 25. 20 New or modified products, technolo- gies What are / will be the changes (decrease or increase) in environmental pressures and impacts due to innovative products or technologies supported by research and innovation policy? Micro Quantitative evidence on changes in material, water, land use and emissions resulting from new or modified products (pressures and impacts across the life cycle of products compared with alternatives) Qualitative and quantitative evidence on causal mechanisms leading to new products (e.g. resulting from new knowledge, processes or policies) Data collection: Internal programme data Survey-based enquiries on R&I structural data (e.g. funding, innovation collaboration) Interviews Data analysis: CBA/CE (micro-meso) Case studies Expert-based methods (e.g. expert panels) Foresight methods (e.g. scenarios) Mixed methods: Experimental methods (e.g. Living Labs) Life Cycle Assessment (direct) Ecological Footprint Material Input per Service Unit (MIPS) CBA/CE Multi Criteria Analysis Meso- macro Quantitative evidence on changes in material, water, land use and emissions due to diffusion of innovative projects and substitution (aggregated information on resource use and emissions) Qualitative and quantitative evidence on causal mechanisms leading to diffusion of new products (including links with practices and systemic determinants e.g. institution- al lock-ins, social acceptance, regulatory framework etc) Data collection: Internal programme data (aggregated) Survey-based enquiries on R&I structural data (e.g. funding, innovation collaboration) Interviews Data analysis: Contribution analysis CBA/CE (meso) Econometric modelling System dynamics Case studies Foresight (e.g. prospective scenarios) Physical accounting Input-output analysis Ecological Footprint Supply chain analysis CBA/CE Macro LCA Multi Criteria Analysis Adjusting GDP (monetary) FIGURE 8. Linking R&I policy effects and environmental assessment methods (continued) Areas of R&I policy outcomes Relevance of R&I for environmental pressures and impacts Level of enquiry Evidence relevant for assessing environmental pressures and impacts Possible data selection and analytical methods Possible input to environmental assessment methods and frameworks
  • 26. 21 * This guide complements and extends the European Commission’s Impact Assessment Guidelines (EC 2009) by including ex-post IA and focussing on the environmental dimension. 2. Environmental dimension in the analytical steps of impact assessment Figure 9. Impact assessment cycle This guidebook explores how to address environ- mental pressures and impacts in both ex-ante and ex-post assessments*. Including both ex-ante and ex- post perspectives allows for an integrated approach to IA that considers the IA as a cyclical process. Figure 9 presents the main analytical steps covered in the guidebook emphasising the connections be- tween ex-ante and ex-post assessments. In this ap- proach, the IA is not a one-off exercise, but is part of an ongoing process of policy learning. STEP 8 Outline monitoring and evaluation system STEP 1 Indicate the objectives of the policy intervention STEP 1 Identify and scope the problem STEP 8 Draw lessons from IA and evaluation STEP 2 Revisit the intervention logic of the intervention STEP 7 Assess the impact of policy intervention STEP 2 Develop baseline scenarios STEP 6 Measure probable impacts of the options STEP 5 Map probable impact pathways of the options STEP 4 Develop policy options STEP 3 objectives of the define the policy intervention STEP 6 Measure impacts of the intervention STEP 5 Map impact pathways of the intervention STEP 4 Compare actual developments to the baseline scenario STEP 3 Re-sssess the problem and related challenges POSSIBLE INTERACTIONS BETWEEN IA STEPS FEEDBACK LOOPS BETWEEN EX ANTE AND EX POST IA STEP 7 Compare and select the preferred option Ex-post impact assessment Ex-ANTE impact assessment
  • 27. 22 Ex-ante and ex-post IA differ in many respects. They have different purpose, scope and methodology. Whereas ex-ante IA supports the selection and prioritisation of relevant instruments and projects in line with set objectives, ex-post IA assesses the extent to which the selected instruments and projects have achieved the de- sired impacts. In terms of methodology, ex-ante impact assessments will likely have more qualitative components than ex-post ones. Clearly, explorative or nor- mative prospective methods may include the use of models and data extrapola- tion as well as narratives, but uncertainty about future developments means that outputs of such quantitative methods are more open to interpretation than the results of most ex-post assessments or evaluations Ex-ante IA by definition involves more risk and uncertainty. It deals with future that cannot be “known”. This is particularly true for ex-ante IA of “blue sky” research and support to radical innovation. This means that IA has to rely on a range of as- sumptions about probable applications of research, its distance to market, scale and time of diffusion as well as substitution effects of the innovation. In the de- sign phase of an intervention or projects of explorative nature, policy makers and stakeholders have a limited view on possible impacts over time. Expected effects, especially long-term impacts, are therefore likely to be inaccurate or to lack detail. Ex-ante IAs tend to overestimate positive impacts of policy intervention, hence the need to involve a range of experts and stakeholders in the IA process in order to ensure “future-proofing”. A degree of uncertainty influences also ex-post assessments and evaluations. Ex- post IA does not have full information and knowledge on impact mechanisms, es- pecially in relation to complex processes on the level of societies and economics. Ex-post IA may suffer from difficulties Despite evident differences, both ex-ante and ex- post assessments are based on a similar concep- tual understanding of causality, attribution and contribution, and impact pathways. What differs is the amount of information and knowledge avail- able for determining causalities and tracing, often complex, impact pathways. Establishing a learning loop between two perspectives could improve qual- ity of public intervention at all levels by offering a reality check for “cost optimism” in policy and proj- ect assumptions alike. The following sections provide guidance on how to address the environmental dimen- sion when tackling analytical steps of IA. The sections provide key questions and recom- mendations on the scope of the assessments. Figure 10 presents examples of questions to be asked when pondering the environmental pressures and impacts of the assessed intervention. In both ex-ante and ex-post exercises consulting external experts as well as other stakeholders can contribute to the robustness and transparency of assessments. Depending on the needs and the nature of the problem addressed by the policy intervention, stakeholders can be consulted about any step of the IA. For more detailed material, including descriptions of methods, concrete examples of IA and reflections on how to conduct IA on different levels (programme, instrument, project), the readers are invited to consult an extended version of this publication.
  • 28. 23 FIGURE 10. Environmental dimension of the impact assessment cycle STEP 8 Outline monitoring and evaluation system STEP 1 Indicate the objectives of the policy intervention STEP 1 Identify and scope the problem STEP 8 Draw lessons from IA and evaluation STEP 7 Compare and select the preferred option STEP 2 Revisit the intervention logic of the intervention STEP 7 Assess the impact of policy intervention STEP 2 Develop baseline scenarios STEP 6 Measure probable impacts of the options STEP 5 Map probable impact pathways of the options STEP 4 Develop policy options STEP 3 objectives of the define the policy intervention STEP 6 Measure impacts of the intervention STEP 5 Map impact pathways of the intervention STEP 4 Compare actual developments to the baseline scenario STEP 3 Re-sssess the problem and related challenges POSSIBLE INTERACTIONS BETWEEN IA STEPS What were the objectives of the intervention directly orindirectly (and explicitly orimplicitly) related to the environment? How were the environmental aspects included into the intervention logic of the assessed measure (e.g. explicit or implicit objective, selection criteria of projects, part of the wider strategy etc)? Have the originally considered environmental aspects of the problem evolved during the problem evolved during the implementation of the intervention? How have the actual developments (e.g. level of pollutions) compared to the baseline scenario considered in the design stage? What have been the pathways and determinants of the environmental pressures and impacts? What have been the scale and types of environmental pressures and impacts directly or indirectly caused by the intervention? What is the overall assessment of the environmental pressures and impacts caused by the intervention? Should further impacts be expected in an longer time horizon? What are the lessons learned about assessing environmental impacts for the related and future monitoring systems? What are the key environmental aspects of the problem? Is the relation to the environment direct or indirect? Are the environmental aspects of the problem likely to vary in different baseline scenarios? Do the objectives explicitly address the environment? Is the environment primary or secondary focus? Does the role and scope o he environ- mental objectives differ between the policy options? How direct, strong and likely the impact of the interven- tion on the environment may be? What are the main causal assumptions about the impacts? What are the scale and types of environ- mental pressures and impacts likely to be caused by the options? How do policy options compare in terms of their environmental impact and the possible trade-offs and social impacts? Is there a need for dedicated environ- mental indicators to monitor and evaluate the intervention? FEEDBACK LOOPS BETWEEN EX ANTE AND EX POST IA Ex-post impact assessment Ex-ANTE impact assessment
  • 29. 24 Step 1. Identify and scope the problem The ex-ante IA starts by describing the problem and related challenges that are to be subject to policy intervention. In order to include an environmental dimension the first step of any IA should aim to: • Identify and describe key environmental aspects of the problem (note that envi- ronmental aspects may be directly or indirectly linked to the problem and related challenges); • Establish main drivers and underlying causes of possible environmental pressures and impacts related to the problem and the future intervention; • Identify any “wild cards” which could disrupt the expected impacts (positively or negatively) (this could include cross-impacts with other measures being imple- mented or discontinued as well as “surprise factors”); • Based on the available studies, data and expertise, verify whether (positive or negative) environmental pressures and impacts are likely to be significant or whether they are uncertain; • Decide if IA requires a dedicated IA component focused on environment; • Add environmental indicators to the baseline of the intervention (depending on the nature of the problem these may be core or secondary baseline indicators). In case of significant evidence and knowledge gaps it is recommended that the decision whether to include a stronger emphasis on environmental dimension is taken based on expert consultations. 2.1.1 Ex-ante impact assessments In order to find a meaningful approach to assessing environmental impacts (and, in fact, any other impacts), any systemic IA framework has to consider that policy is intervening in an open dynamic system, where many factors are at play and influence the outcome of the intervention. Finding a meaningful level and scope of impact assessment is one of the key decisions determining the robustness of the overall exercise. FIGURE 11. Policy intervention and levels of IA R&I policy (i.e. policy mix of different types of measures) R&I instruments (e.g. R&D funding, colaborative research, equity funding, business advisory services Meso-level impacts (e.g. sector value chain) Micro-level impacts (e.g. firm household) IA of R&I policy IA of specific R&I instruments IA of specific R&I projects Macro level impacts R&I projects
  • 30. 25 FIGURE 12. Methodology of impact assessment applied by the Green Investment Bank (GIB), UK The IA considers the following different policy options: 1. Do nothing; 2. Create a fund or consolidate existing ones; 3. Increasing the application of existing Government policies; 4. Create the Green Investment Bank, addressing the market failures and barriers present in the financial markets (recommended option). Key assumptions in this IA had to be made in order to estimate a range of portfolios for the bank. The net present value (NPV) was used to assess the value for money of the different options, describing the difference between the present value of a stream of costs and a stream of benefits over time. The monetised costs considered the different NPVs of different technologies that were to be included in the portfolio of the GIB and included monetised capital and operating expendi- ture costs. For the benefits the savings from CO2 emissions avoided and the financial re- turns of the investments were taken into account. The different NPVs for different technolo- gies had been estimated by prior work from BIS and Vivid Economics. The bank is an independent institution that tries to maximise green impact and profitability, depending on market conditions and the available investments. As a result, its portfolio of projects cannot be determined beforehand, as it is not a matter of policy. The results of this IA are usually given considering a range of illustrative portfolios or through a Monte Carlo analysis considering 90% of the funds committed. Finally, the results of the IA take into account a level of variation in certain parameters, such as the level of additionality, the default rate and the mobilisation rate of private capital. The Department of Business Innovation and Skills prepared the ex-ante Impact Assessment (IA) of the GIB in May 2012, to be reviewed around April 2015. This IA applies to the £3bn committed by the Government to fund the GIB over the period to 2015, not addressing the potential costs and benefits thereafter. Source: Case study of the UK Green Investment Bank Step 2. Develop baseline scenarios The fuller account of possible future developments requires explicit consideration of alternative scenarios of how a baseline will develop. The IA exercises including a stronger emphasis on a prospective dimension should: • Take into account the baseline, develop a prospective scenario or several scenarios of possible; • Take into account the baseline and develop a prospective scenario or several scenarios of possible developments and trends related to the problem, explicitly concidering relevant environmental trends; • Include sensitivity analysis and risk assessment in the scenario development taking into account the dimension of natural environment; • Select the most plausible scenario to be a main basis for the design of the policy options. Developing scenarios makes the baseline more robust and allows for a better view on resilience of proposed policy options. Step 3. Define the objectives of policy intervention Depending on the problem definition and the wider policy context, environmental aspects may be a primary or secondary focus of policy intervention: • If the problem and its root causes are linked to the natural environment, make sure to explicitly include it in the objectives of policy intervention; • If the problem is indirectly linked to the environment, ensure that the objectives of policy intervention are coherent with existing and upcoming EU regulations, policies and strategies targeting the natural environment. Note that the full realisation of possible (negative or positive) impacts on the environ- ment may be revealed in steps 5 and 6. The IA process should be flexible enough to allow for iteration between the steps. If new significant insights are gained from the qualitative and quantitative analysis of the impact pathways, the objectives and op- tions should be revisited and adjusted accordingly.
  • 31. 26 Step 4. Develop policy options Explicit inclusion of environmental aspects in policy options will depend on the problem and on the objectives of the policy intervention. In the case of interventions with high impact on environment, the criteria should explicitly include environmental pressures and impacts and reflection on possible synergies and trade-offs between them and other impacts, notably social and economic impacts. Policy options should be developed taking into account baseline scenarios and their differences in terms of environment trends. Step 5. Analyse the impacts: Qualitative mapping of probable impact pathways Qualitative mapping of impact pathways allows for better realisation of possible direct and indirect impacts of policy intervention on the economy, society and environment. The mapping aims to: • Identify (direct and indirect, positive and negative) environmental pressures and impacts of policy options and how they relate to economic and social impacts of the intervention (causal mechanisms); • Use narratives and visualisations to describe the possible direct and indirect causal pathways leading to environmental pressures and impacts; • Assess the environmental impacts against the baseline in qualitative terms (check the proportionality principle); • Consider the risks and uncertainties of the option in relation to environmental impacts; • Decide if IA requires a dedicated quantitative IA component focused on the environment. The IA canvas introduced in this guidebook can serve as a “drawing board” support- ing thediscussion on the pathways. Qualitative mapping should be supported by readily available quantitative data. The mapping will allow for a better understanding of the scale and time when public intervention may contribute to environmental pressures. Along with the problem definition and baseline it is a sufficient basis for taking a decision on whether a dedicated quantitative estimate is need for IA. The decision should take into account the proportionality principle. Step 6. Analyse the impacts: quantitative estimates of environmental impacts Estimating possible impacts should be based on both qualitative and quantitative evidence. Quantitative IA of R&I should be performed when previous steps suggest a possibly high impact of policy on the environment. The quantitative assessment of tangible pressures and impacts should focus on collecting data on R&I effects that may influence parameters of environmental assessment methods (e.g. physical account- ing, CBA). The step aims to: • Analyse available data to verify causality claims and assess possible environmental impacts of policy options; • If possible and feasible (e.g. depending on the budget, timing as well as type of data needed), collect primary data to complement existing evidence; focus on R&I effects that can directly or indirectly influence parameters that can be linked to environmental assessment methods (e.g. tonnes of CO2 emissions or materials, etc.); • Assess the impacts against the baseline in quantitative and monetary terms. The step can also focus on indirect effects of R&I on the environment (e.g. new knowl- edge to be generated by a research activity). The assumptions on future causalities should be based on both quantitative and qualitative evidence; the causal claims of future impacts are subject to many caveats and uncertainties. The latter should be made transparent in IA reports.
  • 32. 27 FIGURE 13. Assessment criteria used in (ex-ante) IA using RIAM method Source: overview of criteria from Ijäs et al (2010); more information on RIAM method can be also found on the website of DHI Group (http://www.dhigroup.com/MIKECUSTOMISEDbyDHI/RIAM.aspx) Criteria Description Scale Importance of the impact Important to national interest Important regionaly Importent to areas outside the lokal context: areas of coverege can be defined as a part of region Important only in the local context No geografical or other recognised importance 4 3 2 1 0 Magnitude of change Major positive benefit Sagnificant improvement in status quo Improvement in status quo No change in status quo Negative change to status quo Sagnificant negative disadventage or change Major disadventage or change +3 +2 +1 0 -1 -2 -3 Permanence of the impact causing activity Permanent or long-term Temporary and medium-term Temporary and short-term No change/ not applicable 4 3 2 1 Reversibility of impact Irreversible impact Slowly reversible impact Reversible impact No change/ not applicable 4 3 2 1 Cumulative synergizm Obviouse cumulative/ synergic effects with other projects and activities Cumulative/ synergic impact exists, but not uncertain Non-cumulative/ single impact No change/ not applicable 4 3 2 1 The sucestibiity of the target environment The target area is extremly sensitive to environmental changes The target area is sensitive to environmental changes The area is stable for the environmental changes caused by the project No change/ not applicable 4 3 2 1 The Environmental Impact Assessment methodology offers the tool “rapid impact assessment matrix” (RIAM) that allows scoring based on multiple crite- ria. RIAM is quite flexible, transparent and leaves a permanent record, which can be independently checked, validated or updated. The simple, struc- tured form of RIAM allows re-analysis and in-depth analysis of selected components in a rapid and accurate manner. This flexibility makes the method a powerful tool for both executing and evaluating IAs. The scales in RIAM allow both quantitative and qualitative data to be assessed. Being an EIA tool RIAM is applied to infrastructure projects and can be adopted with some adjustments in the ex-ante (but also in ex-post) environmental impact assessment of research infrastructure support projects and programmes. The matrix can be extended by including several dimensions. The figure presents an overview of the assessment criteria used by RIAM
  • 33. 28 Step 7. Compare the policy options In case of policy problems or policy interventions with significant anticipated environmental impacts it is suggested to: • Compare the positive and negative environmental pressures and impacts for each policy option; • Present comparisons between policy options by categories of impacts (e.g. economic, social, environmental) and affected stakeholder groups; • Identify, where possible and appropriate, a preferred option in terms of environmental pressures and impacts taking into account different time horizons of impacts and (possible) trade-offs or synergies with socio-economic impacts. Step 8. Outline monitoring and evaluation The monitoring and evaluation system of the policy intervention with anticipated positive or negative impacts on the environment should include dedicated environmental indica- tors allowing for measuring the intervention’s environmental performance, at the very least in terms of achieving the formal environmental objectives or targets. The indicators should inform later evaluations and assessments of both direct and indirect impacts of policy. They should be tailored so they can inform established methods of assessing environmental pressures and impacts. Figure 14 presents an example of the monitoring and evaluation indicator system giving a significant consideration to measuring environmental performance of R&D projects.
  • 34. 29 •• description of the way how the project results will be exploited •• additional costs until market intro- duction •• expected moment of market intro- duction (year) •• expected moment of maximum turnover •• newness of the market (existing and known market, existing and unknown market, new niche, new large market) •• geographical area (NL, Europe, world) •• competitive position against alterna- tives/competitors •• expected market share •• expected additional turnover (€) •• expected year when investments in the development will be earned backmarket persistence of the project result •• expected cost savings in the com- pany because of the project results (and description of cost savings) •• economic effects with customers (outside the consortium) because of the project •• economic effects with spin-off companies •• possible barriers for market accept- ance •• expected chance that the project will be a commercial success for respondent •• describe mechanism how environ- mental effect is obtained •• define unit for relating the environ- mental effect to (e.g. kg of product, power installed in watt) •• indicate indicate environmental ef- fect: CO2 emission reduction (tonne CO2/j); amount of sustainable energy (TJ/y); energy savings (TJ/y); savings in raw materials (T/y); substitution by renewable resources (tonne/y); reduction of waste (tonne/y; for each waste stream); decrease in use of groundwater (m3/y); decrease in use of drinking water (m3/y); decrease in emission of waste water (m3/y); additional production of drinking water (m3/y); decrease CO2 combustion (tonne/y); decrease non-combustion CO2 (tonne/y); decrease CH4 emission (tonne/y); decrease N2O emission (ton/y); decrease CF6, HFC, PFC (tonne/y); decrease NOx emission (ton/y); decrease SOx emission (tonne/y); decrease NH3 emission (tonne/y); decrease VOC emission (tonne/y); decrease fine dust emis- sion (ton/y); decrease N (nitrogen) emission (ton/y); decrease P (phos- phorus) emission (ton/y); decrease in noise (number of affected per- sons); decrease in odour (number of affected persons); decrease in use of land space •• Number of inventions for which a patent application has been submitted •• Number of EU/ US / worldwide patent ap- plications •• Number of patents granted •• Number of expected patent applications still to come •• Number of delivered PhDs •• Number of PhDs still to defend their thesis •• Number of publica- tions in refereed journals •• Number of publica- tions in professional papers •• Likelihood of technical success for the project •• Dependency of com- mercial success on technical success •• History of earlier cooperation with other partners •• Changes in partners during project execu- tion •• New projects with EET partners •• Will the cooperation be continued after the EET project? If yes, with which partners? •• To what extent do you think the consortium capable ofbringing the pro- ject to the market? •• Could you describe the quality of the cooperation in the- consortium (Likert scale, 1-5) FIGURE 14. Indicators collected for monitoring and IA of the Dutch EET programme Source: Case study on the Dutch EET programme economy ecology Technology CooperationThe Dutch Economy, Ecology, Technology committed subsidies to R&D projects from consortia of universities, knowledge institutes and companies, focusing on building knowledge for realising major improvements in sustainability and realising both large environmental improvements as well as good economic results. The monitoring system adopted by the programme assumed the collection of wide range of output and impact indicators for the economic, ecological and cooperation impact. Every two years a monitor- ing report was produced by the Programme Office to estimate possible programme impacts. The approach was based on determining effects for each project and adding these up. Four information sources are used for the monitoring report: • the EET database with project outputs based on the original applications and the project reports; • an annual survey on the “Standard Outcome Indicators” (SOI). All project coordinators had to submit their expectations on effects of all projects on economy, ecology, technology and cooperation, as defined by a standard set of indicators; • discussion with the project consortium on their assessment of the SOI; • final reports (from projects that were finished). The following indicators were asked from each project participant (for quantitative indicators a most likely estimate, a minimum estimate and a maximum estimate were asked)