Pie charts revision card solved
•Download as PPTX, PDF•
0 likes•324 views

Lesson notes for students for students preparing for WASSCE, NECO & JAMB Exams

Recommended
More Related Content
What's hot
What's hot (20)
Similar to Pie charts revision card solved
Similar to Pie charts revision card solved (20)
More from Puna Ripiye
More from Puna Ripiye (20)
Recently uploaded
Recently uploaded (20)
Pie charts revision card solved
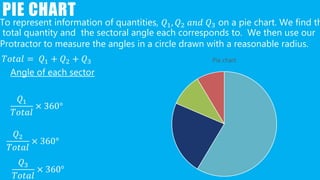
- 1. PIE CHART Pie chart 𝑄1 𝑇𝑜𝑡𝑎𝑙 × 360° 𝑇𝑜𝑡𝑎𝑙 = 𝑄1 + 𝑄2 + 𝑄3 𝑄2 𝑇𝑜𝑡𝑎𝑙 × 360° 𝑄3 𝑇𝑜𝑡𝑎𝑙 × 360° To represent information of quantities, 𝑄1, 𝑄2 𝑎𝑛𝑑 𝑄3 on a pie chart. We find th total quantity and the sectoral angle each corresponds to. We then use our Protractor to measure the angles in a circle drawn with a reasonable radius. Angle of each sector
- 2. The pie chart below show Ghana’s exports in a particular year. The total value of exports amounted to ℂ301,500.00 Solution Q31. 𝐴𝑛𝑔𝑙𝑒 𝑜𝑓 𝑠𝑒𝑐𝑡𝑜𝑟 𝑜𝑓 𝑐𝑜𝑐𝑜𝑎 = 3600 − 600 + 400 + 200 = 2400 ⇒ 𝑉𝑎𝑙𝑢𝑒 𝑜𝑓 𝑐𝑜𝑎𝑐𝑜 𝑒𝑥𝑝𝑜𝑟𝑡𝑒𝑑 = 2400 3600 × 301,500 = ℂ201,000.00 Q32. 𝑃𝑒𝑟𝑐𝑒𝑛𝑡𝑎𝑔𝑒 𝑜𝑓 𝑡𝑖𝑚𝑏𝑒𝑟 𝑒𝑥𝑝𝑜𝑟𝑡𝑒𝑑 = 200 3600 × 100% = 5.56% correct to 2 d. p
- 3. WASSCE 2004 Solution Q31. 𝐴𝑛𝑔𝑙𝑒 𝑜𝑓 𝑠𝑒𝑐𝑡𝑜𝑟 𝑜𝑓 𝑐𝑜𝑐𝑜𝑎 = 3600 − 600 + 400 + 200 = 2400 ⇒ 𝑉𝑎𝑙𝑢𝑒 𝑜𝑓 𝑐𝑜𝑎𝑐𝑜 𝑒𝑥𝑝𝑜𝑟𝑡𝑒𝑑 = 2400 3600 × 301,500 = ℂ201,000.00 Q32. 𝑃𝑒𝑟𝑐𝑒𝑛𝑡𝑎𝑔𝑒 𝑜𝑓 𝑡𝑖𝑚𝑏𝑒𝑟 𝑒𝑥𝑝𝑜𝑟𝑡𝑒𝑑 = 200 3600 × 100% = 5.56% correct to 2 d. p
- 4. JAMB 2004 Solution 𝑇ℎ𝑒 𝑠𝑒𝑐𝑡𝑜𝑟 𝑜𝑓𝑚𝑖𝑙𝑙𝑒𝑡 = 1500 𝑇ℎ𝑒 𝑠𝑒𝑐𝑡𝑜𝑟 𝑜𝑓 𝑏𝑒𝑎𝑛𝑠 = 3600 − 150 + 90 + 60 0 = 600 𝐵𝑦 𝑢𝑠𝑖𝑛𝑔 𝑟𝑎𝑡𝑖𝑜 𝑎𝑛𝑑 𝑝𝑟𝑜𝑝𝑜𝑟𝑡𝑖𝑜𝑛, ⇒ 𝑇ℎ𝑒 𝑎𝑚𝑜𝑢𝑛𝑡 𝑜𝑓 𝑏𝑒𝑎𝑛𝑠 = 600 1500 × 3000 = 1200 𝑡𝑜𝑛𝑛𝑒𝑠
- 5. 1. The pie chart represents the minerals of a certain mining company. What is the value of 𝑥°. A. 45° B. 46° C. 55° D. 40° E. 20° The correct answer is 40° Gold 𝑥° Diamon d 𝑥° Bauxite 2𝑥° Manganes e 5𝑥°
- 6. 1. The pie chart represents the minerals of a certain mining company. What is the value of 𝑥°. A. 45° B. 46° C. 55° D. 40° E. 20° The correct answer is 40° Gold 𝑥° Diamon d 𝑥° Bauxite 2𝑥° Manganes e 5𝑥° Solution 5𝑥 + 𝑥 + 𝑥 + 2𝑥 = 360 9𝑥 = 360 𝑥 = 360 9 𝑥 = 40°
- 7. 2. The pie chart represents the minerals of a certain mining company. What is the percentage of the sector occupied by manganese? A. 45.55% B. 46.66% C. 55.55% D. 55.56% E. 20.56% The correct answer is 55.56% Gold 𝑥° Diamon d 𝑥° Bauxite 2𝑥° Manganes e 5𝑥°
- 8. 2. The pie chart represents the minerals of a certain mining company. What is the percentage of the sector occupied by manganese? A. 45.55% B. 46.66% C. 55.55% D. 55.56% E. 20.56% The correct answer is 55.56% Gold 𝑥° Diamon d 𝑥° Bauxite 2𝑥° Manganes e 5𝑥° Solution 𝑝𝑒𝑟𝑐𝑒𝑛𝑡𝑎𝑔𝑒 𝑜𝑓 𝑀𝑎𝑛𝑔𝑎𝑛𝑒𝑠𝑒 = 5𝑥 9𝑥 × 100% = 55.56%
- 9. 3. The following data represents the prices of gasoline in the United States from 2001 to 2006. Calculate the sectoral angle that correspond to gasoline price in 2001. A. 46.64° B. 47.64° C. 48.64° D. 49.64° E. 50.64° The correct answer is 46.64° 𝑌𝑒𝑎𝑟 𝑮𝒂𝒔 𝑷𝒓𝒊𝒄𝒆 2001 $1.46 2002 $1.39 2003 $1.60 2004 $1.90 2005 $2.31 2006 $2.61
- 10. 3. The following data represents the prices of gasoline in the United States from 2001 to 2006. Calculate the sectoral angle that correspond to gasoline price in 2001. A. 46.64° B. 47.64° C. 48.64° D. 49.64° E. 50.64° The correct answer is 46.64° 𝑌𝑒𝑎𝑟 𝑮𝒂𝒔 𝑷𝒓𝒊𝒄𝒆 2001 $1.46 2002 $1.39 2003 $1.60 2004 $1.90 2005 $2.31 2006 $2.61 Solution 𝑆𝑒𝑐𝑡𝑜𝑟𝑎𝑙 𝑎𝑛𝑔𝑙𝑒 𝑜𝑓 𝑔𝑎𝑠 𝑝𝑟𝑖𝑐𝑒 𝑖𝑛 2001 = $1.46 $11.27 × 360° = 46.64°
- 11. 4. The following data represents the prices of gasoline in the United States from 2001 to 2006. Calculate the largest sectoral angle of gasoline price. A. 83.37° B. 84.37° C. 85.37° D. 86.37° E. 87.37° The correct answer is 83.37° 𝑌𝑒𝑎𝑟 𝑮𝒂𝒔 𝑷𝒓𝒊𝒄𝒆 2001 $1.46 2002 $1.39 2003 $1.60 2004 $1.90 2005 $2.31 2006 $2.61
- 12. 4. The following data represents the prices of gasoline in the United States from 2001 to 2006. Calculate the largest sectoral angle of gasoline price. A. 83.37° B. 84.37° C. 85.37° D. 86.37° E. 87.37° The correct answer is 83.37° 𝑌𝑒𝑎𝑟 𝑮𝒂𝒔 𝑷𝒓𝒊𝒄𝒆 2001 $1.46 2002 $1.39 2003 $1.60 2004 $1.90 2005 $2.31 2006 $2.61 Solution 𝐿𝑎𝑟𝑔𝑒𝑠𝑡 𝑎𝑛𝑔𝑙𝑒 = $2.61 $11.27 × 360° = 83.37°
- 13. 5. The following data represents the population of students in class 6 of some 6 different schools. What is the population of school C? A. 15 B. 25 C. 5 D. 35 E. 20 The correct answer is 15 𝑺𝒄𝒉𝒐𝒐𝒍 𝑷𝒐𝒑𝒖𝒍𝒂𝒕𝒊𝒐𝒏 Sectoral angle 𝐴 40 120° 𝐵 10 𝑥° 𝐶 𝑢 45° 𝐷 20 𝑦° 𝐸 𝑣 75° 𝐹 10 𝑥°
- 14. 5. The following data represents the population of students in class 6 of some 6 different schools. What is the population of school C? A. 15 B. 25 C. 5 D. 35 E. 20 The correct answer is 15 𝑺𝒄𝒉𝒐𝒐𝒍 𝑷𝒐𝒑𝒖𝒍𝒂𝒕𝒊𝒐𝒏 Sectoral angle 𝐴 40 120° 𝐵 10 𝑥° 𝐶 𝑢 45° 𝐷 20 𝑦° 𝐸 𝑣 75° 𝐹 10 𝑥° Solution 120°: 40 45°: 𝑢 If less more divides, 𝑢 = 45 × 40 120 = 15
- 15. 6. The following data represents the population of students in class 6 of some 6 different schools. What is the population of the 6 schools? A. 130 B. 150 C. 120 D. 100 E. 240 The correct answer is 120 𝑺𝒄𝒉𝒐𝒐𝒍 𝑷𝒐𝒑𝒖𝒍𝒂𝒕𝒊𝒐𝒏 Sectoral angle 𝐴 40 120° 𝐵 10 𝑥° 𝐶 𝑢 45° 𝐷 20 𝑦° 𝐸 𝑣 75° 𝐹 10 𝑥°
- 16. 6. The following data represents the population of students in class 6 of some 6 different schools. What is the population of the 6 schools? A. 130 B. 150 C. 120 D. 100 E. 240 The correct answer is 120 𝑺𝒄𝒉𝒐𝒐𝒍 𝑷𝒐𝒑𝒖𝒍𝒂𝒕𝒊𝒐𝒏 Sectoral angle 𝐴 40 120° 𝐵 10 𝑥° 𝐶 𝑢 45° 𝐷 20 𝑦° 𝐸 𝑣 75° 𝐹 10 𝑥° Solution Let total population be p 120°: 40 360°: 𝑝 If more less divides, 𝑢 = 360 × 40 120 = 120
- 17. 7. The following data represents the population of students in class 6 of some 6 different schools. What is the value of 𝑥? A. 30° B. 50° C. 20° D. 10° E. 40° The correct answer is 30° 𝑺𝒄𝒉𝒐𝒐𝒍 𝑷𝒐𝒑𝒖𝒍𝒂𝒕𝒊𝒐𝒏 Sectoral angle 𝐴 40 120° 𝐵 10 𝑥° 𝐶 𝑢 45° 𝐷 20 𝑦° 𝐸 𝑣 75° 𝐹 10 𝑥°
- 18. 7. The following data represents the population of students in class 6 of some 6 different schools. What is the value of 𝑥? A. 30° B. 50° C. 20° D. 10° E. 40° The correct answer is 30° 𝑺𝒄𝒉𝒐𝒐𝒍 𝑷𝒐𝒑𝒖𝒍𝒂𝒕𝒊𝒐𝒏 Sectoral angle 𝐴 40 120° 𝐵 10 𝑥° 𝐶 𝑢 45° 𝐷 20 𝑦° 𝐸 𝑣 75° 𝐹 10 𝑥° Solution 120°: 40 𝑥°: 10 If less more divides, 𝑢 = 120 × 10 40 = 30°
- 19. 8. The following data represents the population of students in class 6 of some 6 different schools. What is the value of y? A. 30° B. 50° C. 60° D. 80° E. 40° The correct answer is 60° 𝑺𝒄𝒉𝒐𝒐𝒍 𝑷𝒐𝒑𝒖𝒍𝒂𝒕𝒊𝒐𝒏 Sectoral angle 𝐴 40 120° 𝐵 10 𝑥° 𝐶 𝑢 45° 𝐷 20 𝑦° 𝐸 𝑣 75° 𝐹 10 𝑥°
- 20. 8. The following data represents the population of students in class 6 of some 6 different schools. What is the value of y? A. 30° B. 50° C. 60° D. 80° E. 40° The correct answer is 60° 𝑺𝒄𝒉𝒐𝒐𝒍 𝑷𝒐𝒑𝒖𝒍𝒂𝒕𝒊𝒐𝒏 Sectoral angle 𝐴 40 120° 𝐵 10 𝑥° 𝐶 𝑢 45° 𝐷 20 𝑦° 𝐸 𝑣 75° 𝐹 10 𝑥° Solution 120°: 40 𝑦°: 20 If less more divides, 𝑢 = 120 × 20 40 = 60°
- 21. 9. The pie chart represents the minerals of a certain mining company. What is the value of 𝑥°. A. 45° B. 46° C. 50° D. 70° E. 20° The correct answer is 50° Gold 𝑥° Diamon d 𝑥° Bauxite 2𝑥° Manganes e 160°
- 22. 9. The pie chart represents the minerals of a certain mining company. What is the value of 𝑥°. A. 45° B. 46° C. 50° D. 70° E. 20° The correct answer is 50° Gold 𝑥° Diamon d 𝑥° Bauxite 2𝑥° Manganes e 160° Solution 𝑥 + 𝑥 + 2𝑥 + 160 = 360 4𝑥 = 200 𝑥 = 50°
- 23. 10 The pie chart represents the minerals of a certain mining company. What is the angle of bauxite? A. 45° B. 46° C. 75° D. 170° E. 100° The correct answer is 100° Gold 𝑥° Diamon d 𝑥° Bauxite 2𝑥° Manganes e 160°
- 24. 10 The pie chart represents the minerals of a certain mining company. What is the angle of bauxite? A. 45° B. 46° C. 75° D. 170° E. 100° The correct answer is 100° Gold 𝑥° Diamon d 𝑥° Bauxite 2𝑥° Manganes e 160° Solution 𝑥 + 𝑥 + 2𝑥 + 160 = 360 4𝑥 = 200 𝑥 = 50° Bauxite = 2(50) = 100°
- 25. PIE CHART Pie chart is used to represent information pictorially in a circle Apply your knowledge of ratio and proportion to find the missing angl 𝑆𝑢𝑚 𝑜𝑓 𝑎𝑙𝑙 𝑡ℎ𝑒 𝑎𝑛𝑔𝑙𝑒𝑠 𝑜𝑓 𝑒𝑎𝑐ℎ 𝑠𝑒𝑐𝑡𝑜𝑟 𝑖𝑛 𝑎 𝑝𝑖𝑒 𝑐ℎ𝑎𝑟𝑡 𝑖𝑠 360°