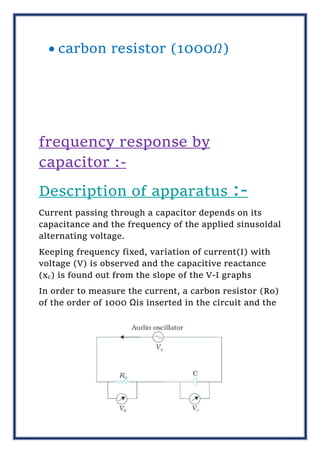
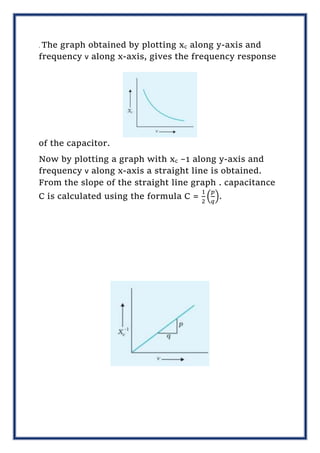
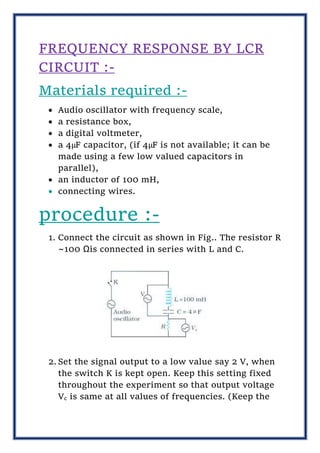
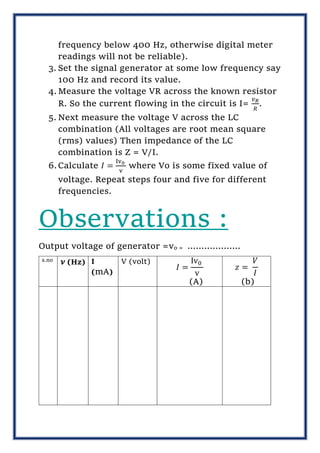
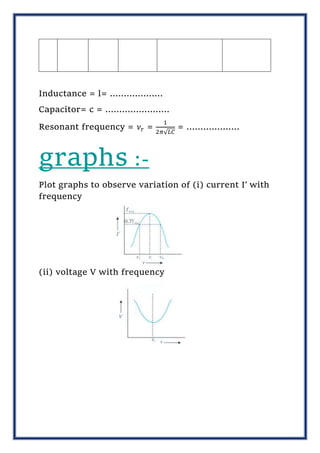
SCHOOL NAME
SESSION : 2022-23
PHYSICS INVESTIGATORY
PROJECT
TOPIC:
FREQUENCY RESPONSE BY CAPACITOR AND
LCR CIRCUIT
SUBMITTED BY :
NAME –
CLASS -XII B ROLL NO.-
CERTIFICATE
This is hereby to certify that the original
and genuine investigation work has been
carried out to investigate the about the
subject matter and related data collection
and investigation has been done
completed solely, sincerely and
satisfactorily done by, name of the
student a student of class XII-B under the
roll no.1230 for the academic year 2022-
23.
Regarding the investigatory project
entitled
“FREQUENCY RESPONSE BY CAPACITOR AND
LCR CIRCUIT .”.
For Physics Department under direct
supervision of the undersigned as per the
requirement.
principal’s signature:
internal examiner’s signature:
external examiner’s signature:
ACKNOWLEDGEMENT
In the accomplishment of, this project
successfully many people have best owned
upon me their blessings and the heart pledged
support, this time I am utilizing to thank all
the people who have been concerned with the
project.
I would like to express my special thanks of
gratitude to our respected principal MR.. and
our Physics teacher MR. for their suggestions
and their instructions has served as the major
contribution towards the completing the
project.
Then I would like to extend my gratitude to
my parents and friends who helped with their
valuable suggestions and guidance has been
helpful in various phases of the completing
the project.
INDEX
 Objective of the project.
 Materials required.
 Frequency response by capacitor.
i. Description of apparatus
ii. Procedure
iii. Observation
iv. Calculation
v. Graphs
 Frequency responded by lcr circuit
i. Materials required
ii. Procedure
iii. Observation
iv. Graph
v. Results
vi. Points to note
 Bibliography
OBJECTIVE OF
THE PROJECT :-
THE OBJECTIVE OF THE PROJECT IS
TO FREQUENCY RESPONSE OF-
(I) A CAPACTIOR
(II) A LCR CIRCUIT.
Materials required :-
 paper or mica capacitor (0.1-
1.0𝜇𝐹)
 digital multimeter (dmm)
 carbon resistor (1000𝛺)
frequency response by
capacitor :-
Description of apparatus :-
Current passing through a capacitor depends on its
capacitance and the frequency of the applied sinusoidal
alternating voltage.
Keeping frequency fixed, variation of current(I) with
voltage (V) is observed and the capacitive reactance
(xc) is found out from the slope of the V-I graphs
In order to measure the current, a carbon resistor (Ro)
of the order of 1000 Ωis inserted in the circuit and the
voltage V across it is measured with the DMM, in ac
voltage mode.
Fig: measurement of the reactance of a capacitor
So the current in the circuit is I = VR /Ro . Setting the
oscillator at different frequencies, xc is found for
different frequencies. A graph between xc and
frequency ν is called the frequency response of the
capacitor.
A graph between xc –1 and frequency ν is also obtained
which is a straight line passing through the origin.
Note: A DMM always measures the rms values of ac
current and voltage. It is always advised not to use the
DMM in the ac current mode.
PROCEDURE:-
1. Connect the audio oscillator, carbon resistor
Ro and capacitor according to the Fig .
2. Set the oscillator to frequency of 50 Hz and
maximum amplitude. The DMM in ac voltage
mode is connected across C, afterwards across
Ro to measure Vc and VR respectively. The
different pairs of values of Vc and VR are
obtained by changing the amplitude of the
applied voltage. The values are recorded in Table
FIG.
3. The step 2 is repeated with frequencies 100
Hz, 150 Hz, 200 Hz, 250 Hz and 300 Hz and the
corresponding values of Vc and VR are also
tabulated in Table FIG.
Observations :-
Measurement of xc for diff. values of v –
s.
no Amplitude
Frequency
(ν)
(Hz)
Vc
(v)
Vr
(v)
I= vr/ro
(a)
Slope of graph
Vc – I graph
xc (ohm)
1.
2.
-
.-
6.
50
(i)
(ii)
(iii)
(iv)
100
(i)
(ii)
(iii)
(iv)
300
(i)
(ii)
(iii)
(iv)
Calculations & Graphs:-
For a given frequency, the values of I are plotted along
x-axis and those of Vc are plotted along y-axis. The
gradient (∆Vc /∆ I) of the straight line graph fig.
xc, is the capacitive reactance and its value is
calculated. The same is done for other frequencies
also. The values of xc for different frequencies are also
included in Table.
. The graph obtained by plotting xc along y-axis and
frequency ν along x-axis, gives the frequency response
of the capacitor.
Now by plotting a graph with xc –1 along y-axis and
frequency ν along x-axis a straight line is obtained.
From the slope of the straight line graph . capacitance
C is calculated using the formula C =
1
2
(
𝑝
𝑞
).
FREQUENCY RESPONSE BY LCR
CIRCUIT :-
Materials required :-
 Audio oscillator with frequency scale,
 a resistance box,
 a digital voltmeter,
 a 4µF capacitor, (if 4µF is not available; it can be
made using a few low valued capacitors in
parallel),
 an inductor of 100 mH,
 connecting wires.
procedure :-
1. Connect the circuit as shown in Fig.. The resistor R
~100 Ωis connected in series with L and C.
2. Set the signal output to a low value say 2 V, when
the switch K is kept open. Keep this setting fixed
throughout the experiment so that output voltage
Vc is same at all values of frequencies. (Keep the
frequency below 400 Hz, otherwise digital meter
readings will not be reliable).
3. Set the signal generator at some low frequency say
100 Hz and record its value.
4. Measure the voltage VR across the known resistor
R. So the current flowing in the circuit is I=
𝑣𝑅
𝑅
.
5. Next measure the voltage V across the LC
combination (All voltages are root mean square
(rms) values) Then impedance of the LC
combination is Z = V/I.
6.Calculate 𝐼 =
Iv0
v
where Vo is some fixed value of
voltage. Repeat steps four and five for different
frequencies.
Observations :
Output voltage of generator =vo = ……………….
s.no
𝝂 (Hz) I
(mA)
V (volt)
𝐼 =
Iv0
v
(A)
𝑧 =
𝑉
𝐼
(b)
Inductance = l= ……………….
Capacitor= c = …………………..
Resonant frequency = 𝜈𝑟 =
1
2𝜋√𝐿𝐶
= ……………….
graphs :-
Plot graphs to observe variation of (i) current I′ with
frequency
(ii) voltage V with frequency
(iii) impedance Z with frequency. Observe the resonant
frequency from the three graphs and compare their
values.
Result :-
1. Resonant frequency from I′ vs ν graph = ....... Hz
2. Resonant frequency from V vs ν graph = ....….H
3. Resonant frequency from Z vs ν graph =........Hz
4. Minimum value of Z i.e., internal resistance RI from
Z versus ν graph = ............... Ω(should be around ~ 100
Ω
)
Points to note :-
1. why to perform the experiment at low voltage? As
you approach to resonant frequency , both vl and
Vc increase enormously. Therefore, it may cause
damage to insulation of electrical components.
This is the reason for setting up the generator at
low voltage. Ensure that the capacitor and
inductor are rated atleast 300 V.
2. Phase relation between xl and xc : For frequencies,
quite far away from resonant frequency,
individual voltages vl and Vc may be larger than
the output voltage of the oscillator and V is quite
closely equal to their difference. Check up this fact
at one or two frequencies by actually measuring vl
and Vc .
it shows that inductive and capacitive reactance are
opposite in character, i.e., voltage across inductor and
the capacitor are in a phase opposite to each other. The
ac current in circuit lags behind voltage vl by 90° and
Vc lags behind the ac current by further 90°. Hence vl
and Vc are 180° out of phase with each other.
3. Internal resistant of resonance circuit– Resonance in
the circuit is observed when xl and xc are equal to each
other. In case of ideal inductor and capacitor their
combined reactance would be zero at resonance. It will
cause an infinite current at resonance, except that it is
limited by the output impedance of the signal
generator. Internal resistance RI in an inductive coil is
due to finite resistance of its windings and some
hysterisis losses in its iron core. In case of a capacitor,
there is energy losses in the dielectric. The minimum
value of X at resonance represents this internal
resistance RI .
4. Quality factor The magnitude of voltage drop across
L at resonance is
Vl= (VL)(IMAX) = 2πVRL
𝑣𝑚𝑖𝑛
𝑅𝑖
= QOVMIN
QO=
2𝜋𝜈𝑟𝐿
𝑅𝑖
=
1
2𝜋𝜈𝑟𝐶𝑅𝑖
is the quality factor at resonance.
It is the ratio of reactance of L (or of C) to the value of
X, both taken at resonant frequency νr . Since Q0 is a
number greater than 1, the voltage drop across C or L
would be greater than Vmin, the voltage drop across L
and C combine together
Bibliography :-
 https://ncert.nic.in/
 https://techweb.rohm.com/kn
owledge/emc/he%20frequenc
y,impedance%20in%20the%2
0ca
 https://www.khanacademy.or
g/science/in-in-class-12th-
physics-india/
 Ncert class xii physics
physics investogatory project class 12t.docx

physics investogatory project class 12t.docx

  • 1.
    SCHOOL NAME SESSION :2022-23 PHYSICS INVESTIGATORY PROJECT TOPIC: FREQUENCY RESPONSE BY CAPACITOR AND LCR CIRCUIT SUBMITTED BY : NAME – CLASS -XII B ROLL NO.-
  • 2.
    CERTIFICATE This is herebyto certify that the original and genuine investigation work has been carried out to investigate the about the subject matter and related data collection and investigation has been done completed solely, sincerely and satisfactorily done by, name of the student a student of class XII-B under the roll no.1230 for the academic year 2022- 23. Regarding the investigatory project entitled “FREQUENCY RESPONSE BY CAPACITOR AND LCR CIRCUIT .”. For Physics Department under direct supervision of the undersigned as per the requirement. principal’s signature: internal examiner’s signature:
  • 3.
    external examiner’s signature: ACKNOWLEDGEMENT Inthe accomplishment of, this project successfully many people have best owned upon me their blessings and the heart pledged support, this time I am utilizing to thank all the people who have been concerned with the project. I would like to express my special thanks of gratitude to our respected principal MR.. and our Physics teacher MR. for their suggestions and their instructions has served as the major contribution towards the completing the project. Then I would like to extend my gratitude to my parents and friends who helped with their valuable suggestions and guidance has been helpful in various phases of the completing the project.
  • 4.
    INDEX  Objective ofthe project.  Materials required.  Frequency response by capacitor. i. Description of apparatus ii. Procedure iii. Observation iv. Calculation v. Graphs  Frequency responded by lcr circuit i. Materials required ii. Procedure iii. Observation iv. Graph v. Results vi. Points to note  Bibliography
  • 5.
    OBJECTIVE OF THE PROJECT:- THE OBJECTIVE OF THE PROJECT IS TO FREQUENCY RESPONSE OF- (I) A CAPACTIOR (II) A LCR CIRCUIT. Materials required :-  paper or mica capacitor (0.1- 1.0𝜇𝐹)  digital multimeter (dmm)
  • 6.
     carbon resistor(1000𝛺) frequency response by capacitor :- Description of apparatus :- Current passing through a capacitor depends on its capacitance and the frequency of the applied sinusoidal alternating voltage. Keeping frequency fixed, variation of current(I) with voltage (V) is observed and the capacitive reactance (xc) is found out from the slope of the V-I graphs In order to measure the current, a carbon resistor (Ro) of the order of 1000 Ωis inserted in the circuit and the
  • 7.
    voltage V acrossit is measured with the DMM, in ac voltage mode. Fig: measurement of the reactance of a capacitor So the current in the circuit is I = VR /Ro . Setting the oscillator at different frequencies, xc is found for different frequencies. A graph between xc and frequency ν is called the frequency response of the capacitor. A graph between xc –1 and frequency ν is also obtained which is a straight line passing through the origin. Note: A DMM always measures the rms values of ac current and voltage. It is always advised not to use the DMM in the ac current mode. PROCEDURE:- 1. Connect the audio oscillator, carbon resistor Ro and capacitor according to the Fig . 2. Set the oscillator to frequency of 50 Hz and maximum amplitude. The DMM in ac voltage mode is connected across C, afterwards across Ro to measure Vc and VR respectively. The different pairs of values of Vc and VR are obtained by changing the amplitude of the applied voltage. The values are recorded in Table FIG.
  • 8.
    3. The step2 is repeated with frequencies 100 Hz, 150 Hz, 200 Hz, 250 Hz and 300 Hz and the corresponding values of Vc and VR are also tabulated in Table FIG. Observations :- Measurement of xc for diff. values of v – s. no Amplitude Frequency (ν) (Hz) Vc (v) Vr (v) I= vr/ro (a) Slope of graph Vc – I graph xc (ohm) 1. 2. - .- 6. 50 (i) (ii) (iii) (iv) 100 (i) (ii) (iii) (iv) 300 (i)
  • 9.
    (ii) (iii) (iv) Calculations & Graphs:- Fora given frequency, the values of I are plotted along x-axis and those of Vc are plotted along y-axis. The gradient (∆Vc /∆ I) of the straight line graph fig. xc, is the capacitive reactance and its value is calculated. The same is done for other frequencies also. The values of xc for different frequencies are also included in Table.
  • 10.
    . The graphobtained by plotting xc along y-axis and frequency ν along x-axis, gives the frequency response of the capacitor. Now by plotting a graph with xc –1 along y-axis and frequency ν along x-axis a straight line is obtained. From the slope of the straight line graph . capacitance C is calculated using the formula C = 1 2 ( 𝑝 𝑞 ).
  • 11.
    FREQUENCY RESPONSE BYLCR CIRCUIT :- Materials required :-  Audio oscillator with frequency scale,  a resistance box,  a digital voltmeter,  a 4µF capacitor, (if 4µF is not available; it can be made using a few low valued capacitors in parallel),  an inductor of 100 mH,  connecting wires. procedure :- 1. Connect the circuit as shown in Fig.. The resistor R ~100 Ωis connected in series with L and C. 2. Set the signal output to a low value say 2 V, when the switch K is kept open. Keep this setting fixed throughout the experiment so that output voltage Vc is same at all values of frequencies. (Keep the
  • 12.
    frequency below 400Hz, otherwise digital meter readings will not be reliable). 3. Set the signal generator at some low frequency say 100 Hz and record its value. 4. Measure the voltage VR across the known resistor R. So the current flowing in the circuit is I= 𝑣𝑅 𝑅 . 5. Next measure the voltage V across the LC combination (All voltages are root mean square (rms) values) Then impedance of the LC combination is Z = V/I. 6.Calculate 𝐼 = Iv0 v where Vo is some fixed value of voltage. Repeat steps four and five for different frequencies. Observations : Output voltage of generator =vo = ………………. s.no 𝝂 (Hz) I (mA) V (volt) 𝐼 = Iv0 v (A) 𝑧 = 𝑉 𝐼 (b)
  • 13.
    Inductance = l=………………. Capacitor= c = ………………….. Resonant frequency = 𝜈𝑟 = 1 2𝜋√𝐿𝐶 = ………………. graphs :- Plot graphs to observe variation of (i) current I′ with frequency (ii) voltage V with frequency
  • 14.
    (iii) impedance Zwith frequency. Observe the resonant frequency from the three graphs and compare their values. Result :- 1. Resonant frequency from I′ vs ν graph = ....... Hz 2. Resonant frequency from V vs ν graph = ....….H 3. Resonant frequency from Z vs ν graph =........Hz 4. Minimum value of Z i.e., internal resistance RI from Z versus ν graph = ............... Ω(should be around ~ 100 Ω ) Points to note :- 1. why to perform the experiment at low voltage? As you approach to resonant frequency , both vl and Vc increase enormously. Therefore, it may cause damage to insulation of electrical components. This is the reason for setting up the generator at low voltage. Ensure that the capacitor and inductor are rated atleast 300 V. 2. Phase relation between xl and xc : For frequencies, quite far away from resonant frequency,
  • 15.
    individual voltages vland Vc may be larger than the output voltage of the oscillator and V is quite closely equal to their difference. Check up this fact at one or two frequencies by actually measuring vl and Vc . it shows that inductive and capacitive reactance are opposite in character, i.e., voltage across inductor and the capacitor are in a phase opposite to each other. The ac current in circuit lags behind voltage vl by 90° and Vc lags behind the ac current by further 90°. Hence vl and Vc are 180° out of phase with each other. 3. Internal resistant of resonance circuit– Resonance in the circuit is observed when xl and xc are equal to each other. In case of ideal inductor and capacitor their combined reactance would be zero at resonance. It will cause an infinite current at resonance, except that it is limited by the output impedance of the signal generator. Internal resistance RI in an inductive coil is due to finite resistance of its windings and some hysterisis losses in its iron core. In case of a capacitor, there is energy losses in the dielectric. The minimum value of X at resonance represents this internal resistance RI . 4. Quality factor The magnitude of voltage drop across L at resonance is Vl= (VL)(IMAX) = 2πVRL 𝑣𝑚𝑖𝑛 𝑅𝑖 = QOVMIN QO= 2𝜋𝜈𝑟𝐿 𝑅𝑖 = 1 2𝜋𝜈𝑟𝐶𝑅𝑖
  • 16.
    is the qualityfactor at resonance. It is the ratio of reactance of L (or of C) to the value of X, both taken at resonant frequency νr . Since Q0 is a number greater than 1, the voltage drop across C or L would be greater than Vmin, the voltage drop across L and C combine together Bibliography :-  https://ncert.nic.in/  https://techweb.rohm.com/kn owledge/emc/he%20frequenc y,impedance%20in%20the%2 0ca  https://www.khanacademy.or g/science/in-in-class-12th- physics-india/  Ncert class xii physics