Download to read offline
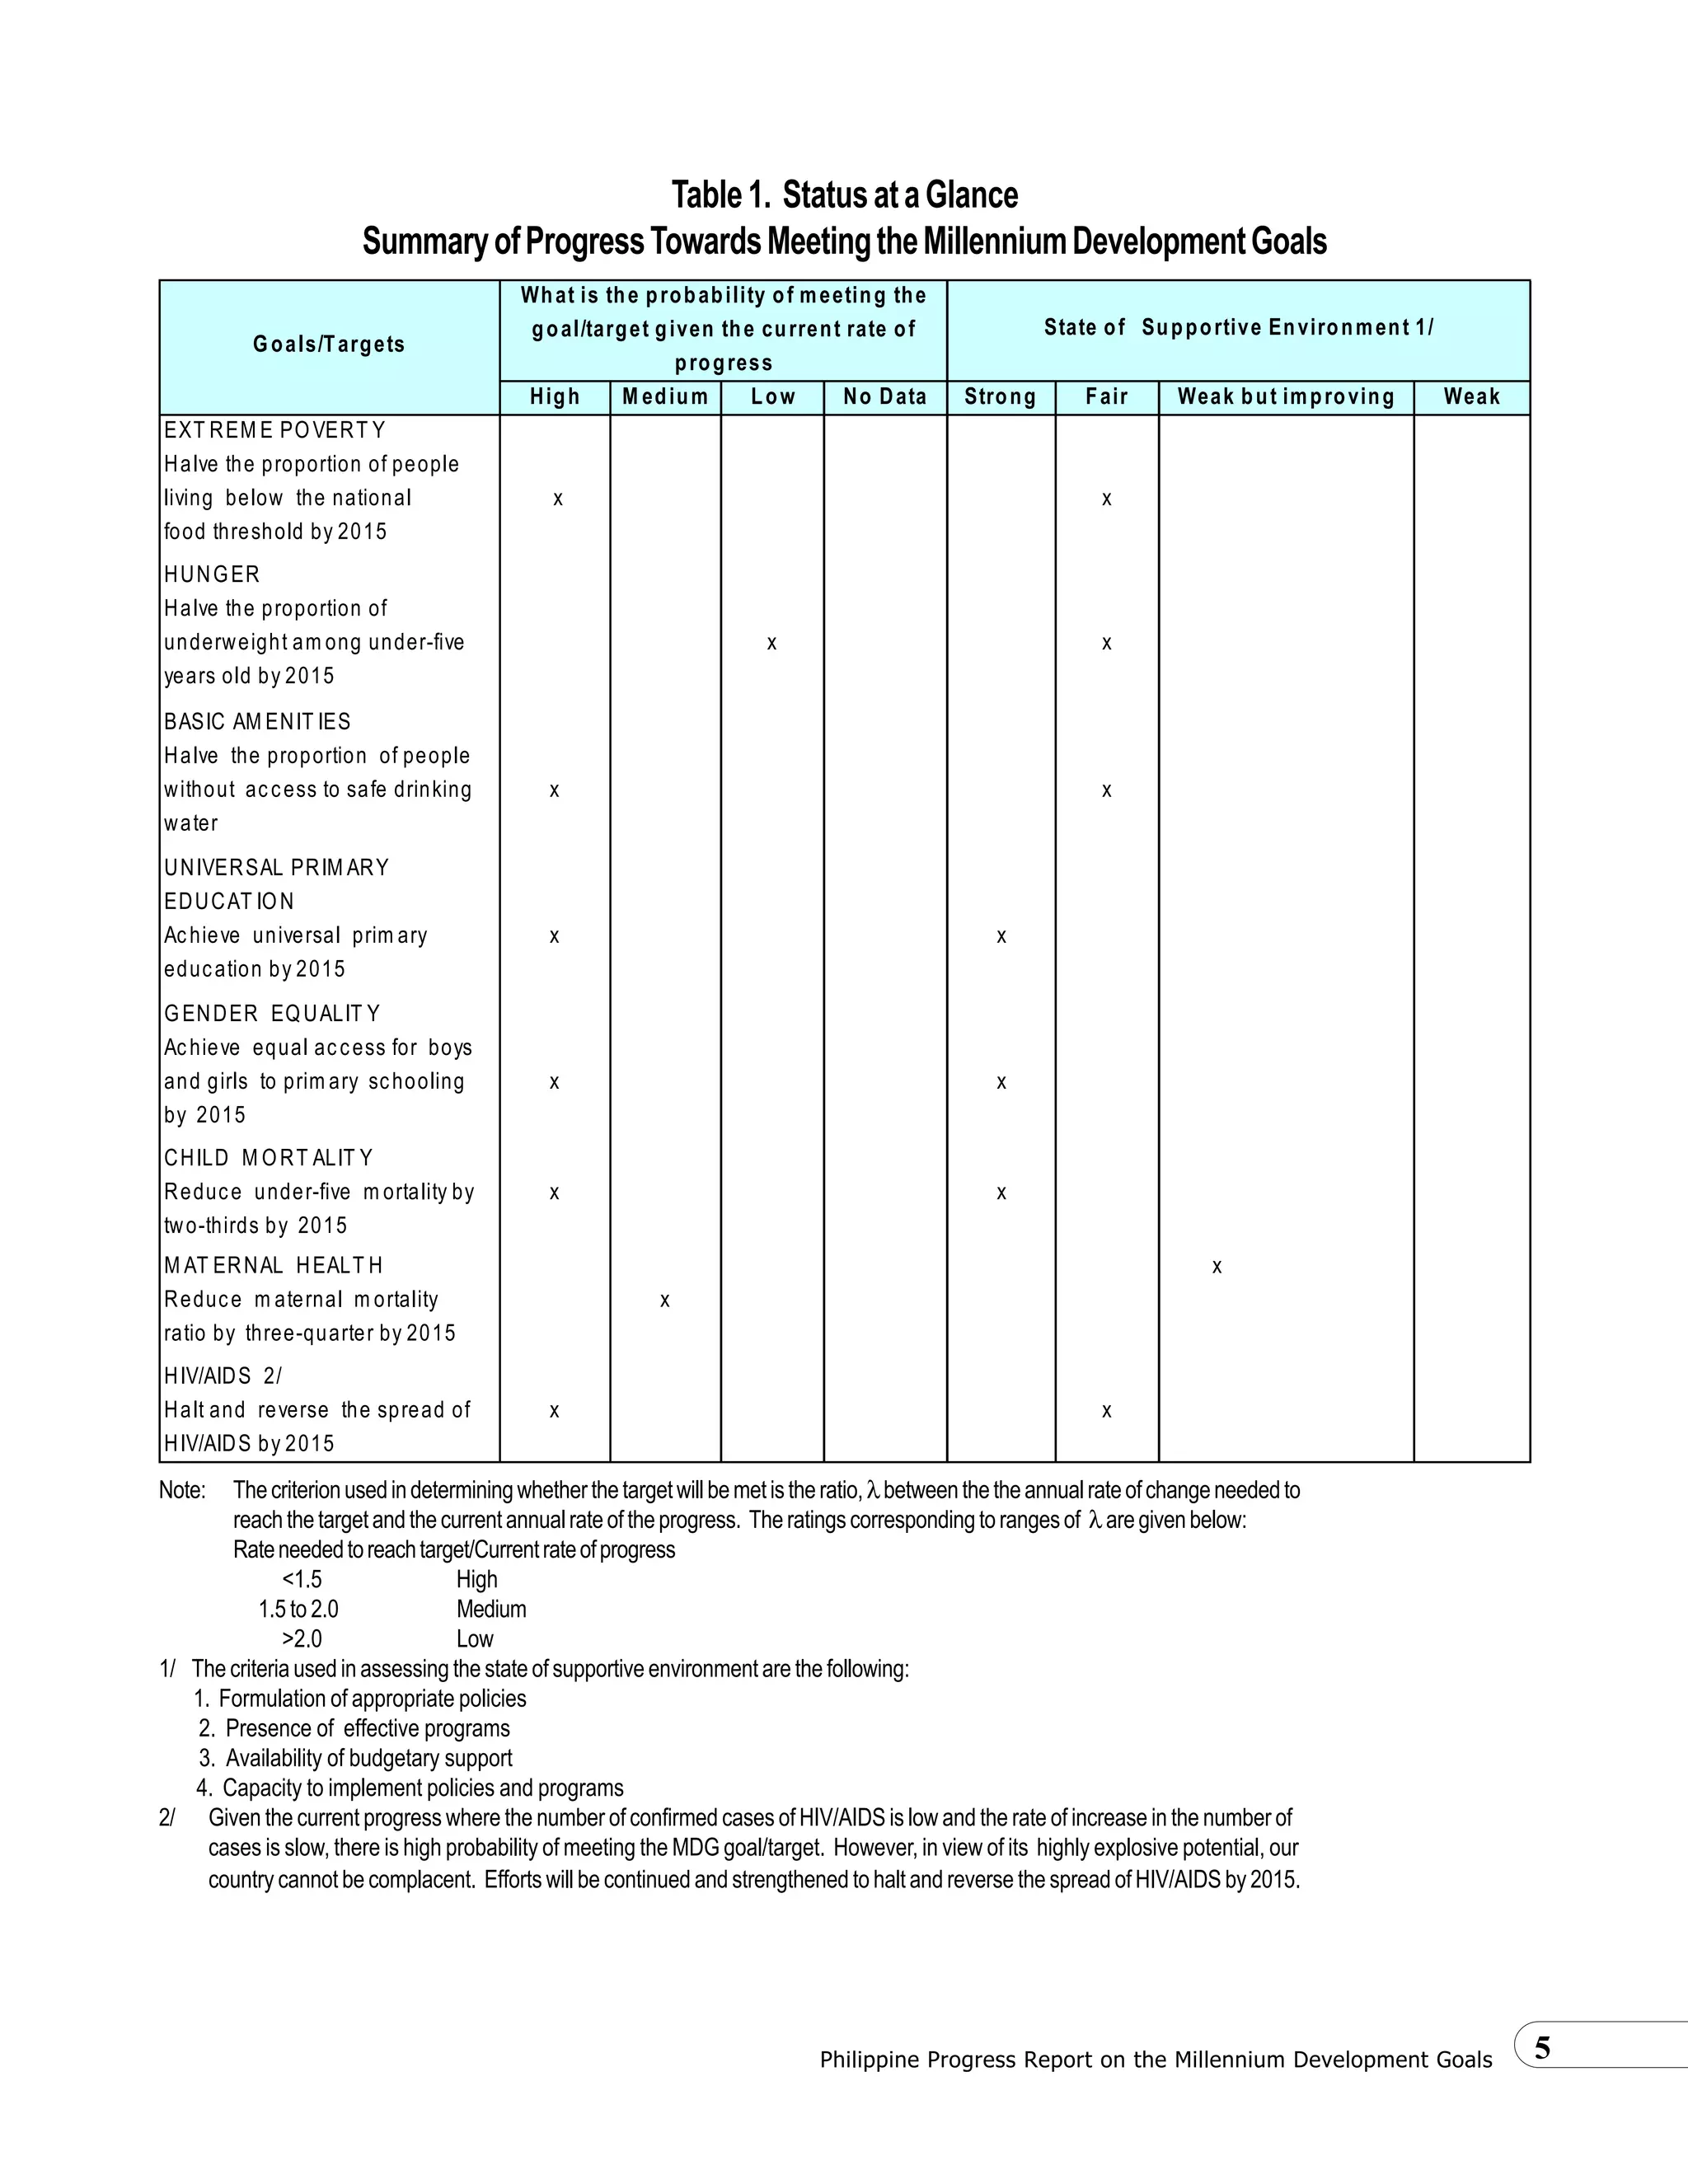

The United Nations Millennium Declaration in 2000 established 8 Millennium Development Goals to reduce extreme poverty, hunger, disease, and gender inequality by 2015. The Philippines made progress towards many of the goals between 1990-2000 by reducing poverty, child mortality, and increasing access to education and water, but still faces challenges in improving maternal health and the environment. Meeting all the MDG targets by 2015 will require increased funding and cooperation across government agencies.


