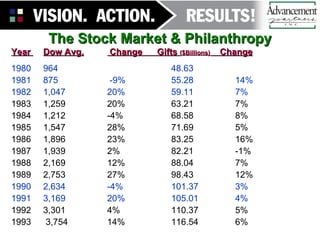
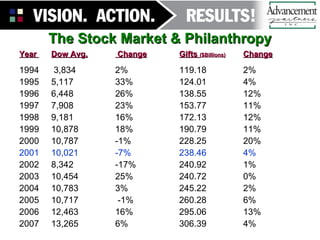
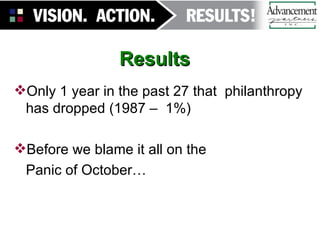
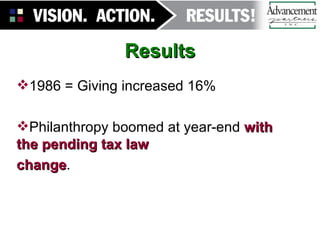
Advancement Partners, Inc. Philanthropy in Economic Slowdowns
Background After 9/11 The Center on Philanthropy at Indiana University examined what happened to the US economy and to giving in the years surrounding  13 major events  of terrorism, war (or war-like acts) and political or economic crises.
Events of War Fall of France 1939-41 Pearl Harbor 1940-41 Korean War 1949-51 Cuban Missile Crisis 1961-63 Bombing of Cambodia 1969-71 Gulf War 1990-92
Terrorism, Political & Economic Crises World Trade Center Bombing 1992-94 Oklahoma City Bombing 1994-96 JFK Assassination 1962-64 Nixon resigns 1973-75 Arab Oil Embargo 1972-74 Hunt Silver Crisis 1979-81 Panic of 1987 1986-88
Effect The stock market dropped  dramatically  within 30 days  of most of the major crises evaluated.
BUT… Within one year, the market had recovered (within 1%)  or more than recovered  its  value  in all but three cases: The fall of France The Arab oil embargo The financial panic of 1987
The Panic of 1987 One day drop: 18.1% drop in the market 30 days after the panic: Still down 15.6% One year later: Down just 4.9% 1988 Philanthropy: Increase of 7.1%
The Stock Market & Philanthropy Year  Dow Avg.  Change  Gifts  ($Billions)   Change 1980 964  48.63 1981  875  -9%  55.28 14% 1982  1,047  20%  59.11  7% 1983  1,259  20%  63.21  7% 1984  1,212  -4%  68.58  8% 1985  1,547  28%  71.69  5% 1986  1,896  23%  83.25  16% 1987  1,939  2%   82.21  -1% 1988  2,169  12%  88.04  7% 1989  2,753  27% 98.43  12% 1990  2,634  -4%  101.37  3% 1991  3,169  20%  105.01  4% 1992  3,301  4% 110.37  5% 1993  3,754  14% 116.54  6%
The Stock Market & Philanthropy Year  Dow Avg.  Change Gifts  ($Billions) Change 1994  3,834  2%  119.18  2% 1995  5,117  33%  124.01  4% 1996 6,448  26%  138.55  12% 1997  7,908  23%  153.77   11% 1998  9,181  16% 172.13  12% 1999  10,878  18%  190.79  11% 2000  10,787  -1% 228.25  20% 2001  10,021  -7% 238.46 4% 2002  8,342  -17% 240.92  1% 2003 10,454  25% 240.72  0% 2004  10,783  3%  245.22  2% 2005  10,717  -1%  260.28  6% 2006  12,463  16% 295.06  13% 2007  13,265  6% 306.39  4%
Results Only 1 year in the past 27 that  philanthropy has dropped (1987 –  1%) Before we blame it all on the  Panic of October…
Results 1986 = Giving increased 16%  Philanthropy boomed at year-end  with the pending tax law  change .
Results Otherwise, philanthropy has increased from one year to the next, even during years in which the market has dropped.
Results Even during the  worst decline in the stock market  (in 2002, when the Dow dropped 17% and the S&P 500 dropped 23%), philanthropy  increased  by 1%.
Results “ When the economy shows stress, whether it is a recession or not, giving may grow more slowly. It is important to note that  giving still grows” .
Results “ Before adjusting for inflation, giving has  increased  an average of  8.4 percent in years without a recession . In years  with a recession , giving has  increased 6.2 percent   (also in current dollars)”. Published by Giving USA Foundation™ and written and researched at the Center on Philanthropy at Indiana University
What’s it all mean? Changes in total philanthropy are  not  directly correlated to changes in the stock market.
What’s it all Mean? Total philanthropy appears to weather storms in the stock market  with great resiliency  and less dramatic fluctuation.
Conclusion Philanthropy remains resilient. A strong stock market gives donors confidence in giving, but  the opposite is not true.   Down markets do not always foretell decreased philanthropy.
Fall 1981 Recession Prime rate = 20% Inflation = 10% Mortgage rates = 15% Unemployment = 9+% Charitable giving  grew 13% over 1980   (3% inflation adjusted) Published August 2008-National Catholic Development Conference,  Dimensions
What To Do?   Most important: ask for gifts   in a clear and focused manner . News reports often focus on negative stories… Data show  repeatedly  that  donors continue to give during a recession or downturn  and that nonprofit organizations continue to raise funds successfully. Published by Giving USA Foundation™ and written and researched at the Center on Philanthropy at Indiana University

Philanthropy in Economic Slowdowns

  • 1.
    Advancement Partners, Inc.Philanthropy in Economic Slowdowns
  • 2.
    Background After 9/11The Center on Philanthropy at Indiana University examined what happened to the US economy and to giving in the years surrounding 13 major events of terrorism, war (or war-like acts) and political or economic crises.
  • 3.
    Events of WarFall of France 1939-41 Pearl Harbor 1940-41 Korean War 1949-51 Cuban Missile Crisis 1961-63 Bombing of Cambodia 1969-71 Gulf War 1990-92
  • 4.
    Terrorism, Political &Economic Crises World Trade Center Bombing 1992-94 Oklahoma City Bombing 1994-96 JFK Assassination 1962-64 Nixon resigns 1973-75 Arab Oil Embargo 1972-74 Hunt Silver Crisis 1979-81 Panic of 1987 1986-88
  • 5.
    Effect The stockmarket dropped dramatically within 30 days of most of the major crises evaluated.
  • 6.
    BUT… Within oneyear, the market had recovered (within 1%) or more than recovered its value in all but three cases: The fall of France The Arab oil embargo The financial panic of 1987
  • 7.
    The Panic of1987 One day drop: 18.1% drop in the market 30 days after the panic: Still down 15.6% One year later: Down just 4.9% 1988 Philanthropy: Increase of 7.1%
  • 8.
    The Stock Market& Philanthropy Year Dow Avg. Change Gifts ($Billions) Change 1980 964 48.63 1981 875 -9% 55.28 14% 1982 1,047 20% 59.11 7% 1983 1,259 20% 63.21 7% 1984 1,212 -4% 68.58 8% 1985 1,547 28% 71.69 5% 1986 1,896 23% 83.25 16% 1987 1,939 2% 82.21 -1% 1988 2,169 12% 88.04 7% 1989 2,753 27% 98.43 12% 1990 2,634 -4% 101.37 3% 1991 3,169 20% 105.01 4% 1992 3,301 4% 110.37 5% 1993 3,754 14% 116.54 6%
  • 9.
    The Stock Market& Philanthropy Year Dow Avg. Change Gifts ($Billions) Change 1994 3,834 2% 119.18 2% 1995 5,117 33% 124.01 4% 1996 6,448 26% 138.55 12% 1997 7,908 23% 153.77 11% 1998 9,181 16% 172.13 12% 1999 10,878 18% 190.79 11% 2000 10,787 -1% 228.25 20% 2001 10,021 -7% 238.46 4% 2002 8,342 -17% 240.92 1% 2003 10,454 25% 240.72 0% 2004 10,783 3% 245.22 2% 2005 10,717 -1% 260.28 6% 2006 12,463 16% 295.06 13% 2007 13,265 6% 306.39 4%
  • 10.
    Results Only 1year in the past 27 that philanthropy has dropped (1987 – 1%) Before we blame it all on the Panic of October…
  • 11.
    Results 1986 =Giving increased 16% Philanthropy boomed at year-end with the pending tax law change .
  • 12.
    Results Otherwise, philanthropyhas increased from one year to the next, even during years in which the market has dropped.
  • 13.
    Results Even duringthe worst decline in the stock market (in 2002, when the Dow dropped 17% and the S&P 500 dropped 23%), philanthropy increased by 1%.
  • 14.
    Results “ Whenthe economy shows stress, whether it is a recession or not, giving may grow more slowly. It is important to note that giving still grows” .
  • 15.
    Results “ Beforeadjusting for inflation, giving has increased an average of 8.4 percent in years without a recession . In years with a recession , giving has increased 6.2 percent (also in current dollars)”. Published by Giving USA Foundation™ and written and researched at the Center on Philanthropy at Indiana University
  • 16.
    What’s it allmean? Changes in total philanthropy are not directly correlated to changes in the stock market.
  • 17.
    What’s it allMean? Total philanthropy appears to weather storms in the stock market with great resiliency and less dramatic fluctuation.
  • 18.
    Conclusion Philanthropy remainsresilient. A strong stock market gives donors confidence in giving, but the opposite is not true. Down markets do not always foretell decreased philanthropy.
  • 19.
    Fall 1981 RecessionPrime rate = 20% Inflation = 10% Mortgage rates = 15% Unemployment = 9+% Charitable giving grew 13% over 1980 (3% inflation adjusted) Published August 2008-National Catholic Development Conference, Dimensions
  • 20.
    What To Do? Most important: ask for gifts in a clear and focused manner . News reports often focus on negative stories… Data show repeatedly that donors continue to give during a recession or downturn and that nonprofit organizations continue to raise funds successfully. Published by Giving USA Foundation™ and written and researched at the Center on Philanthropy at Indiana University