Download as PDF, PPTX
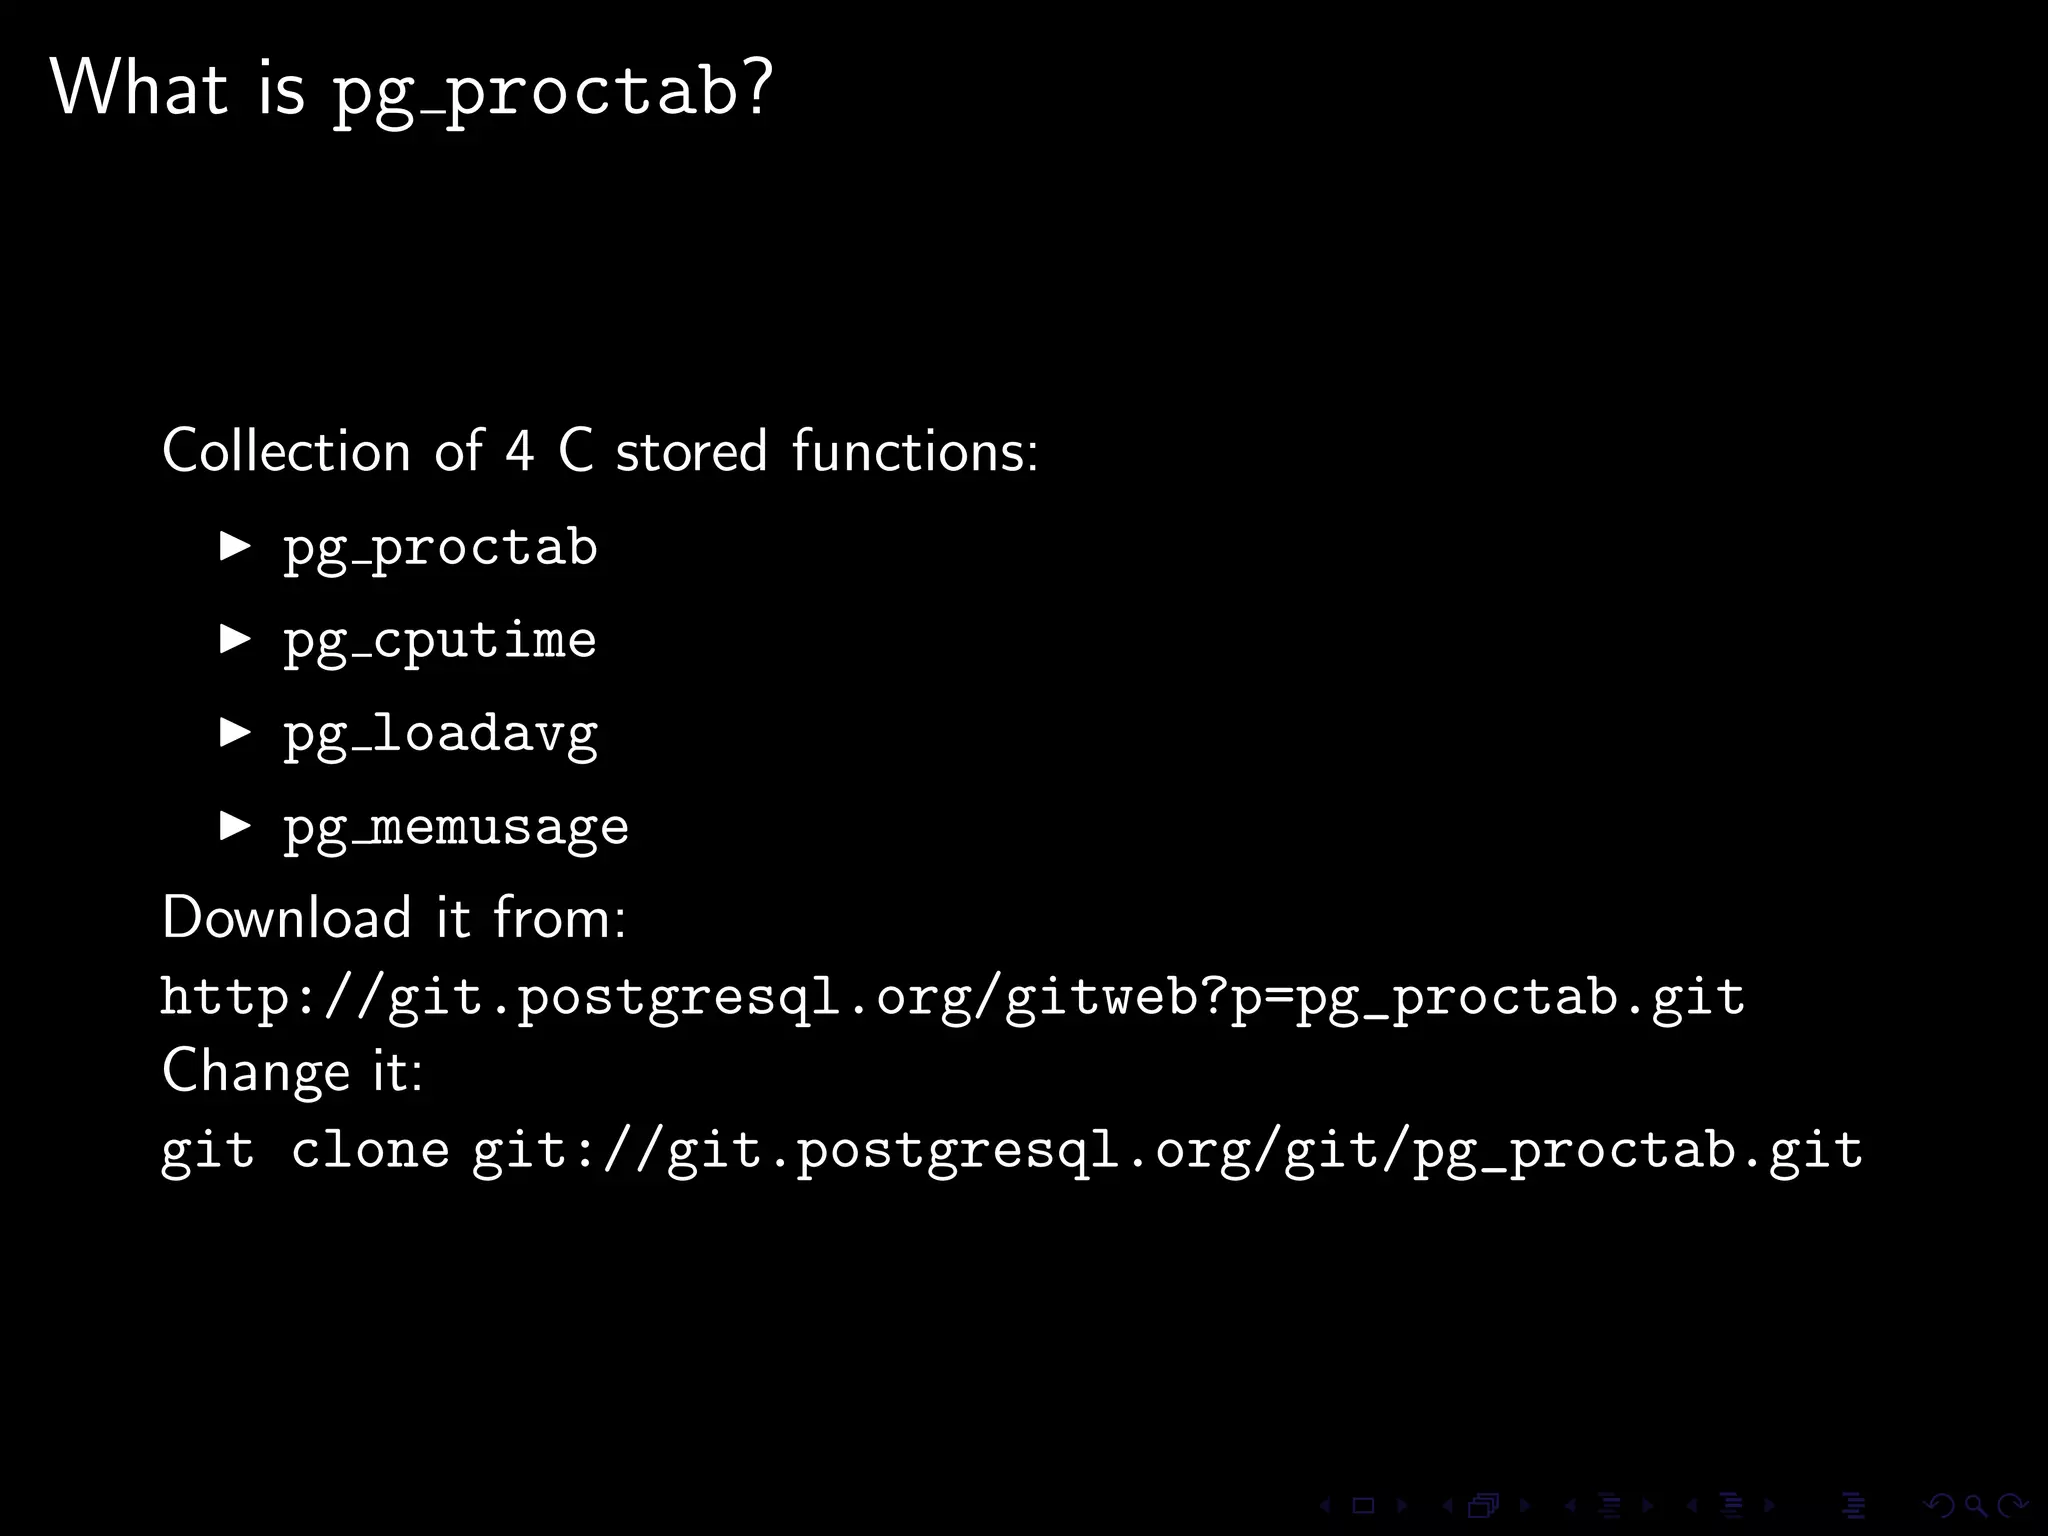
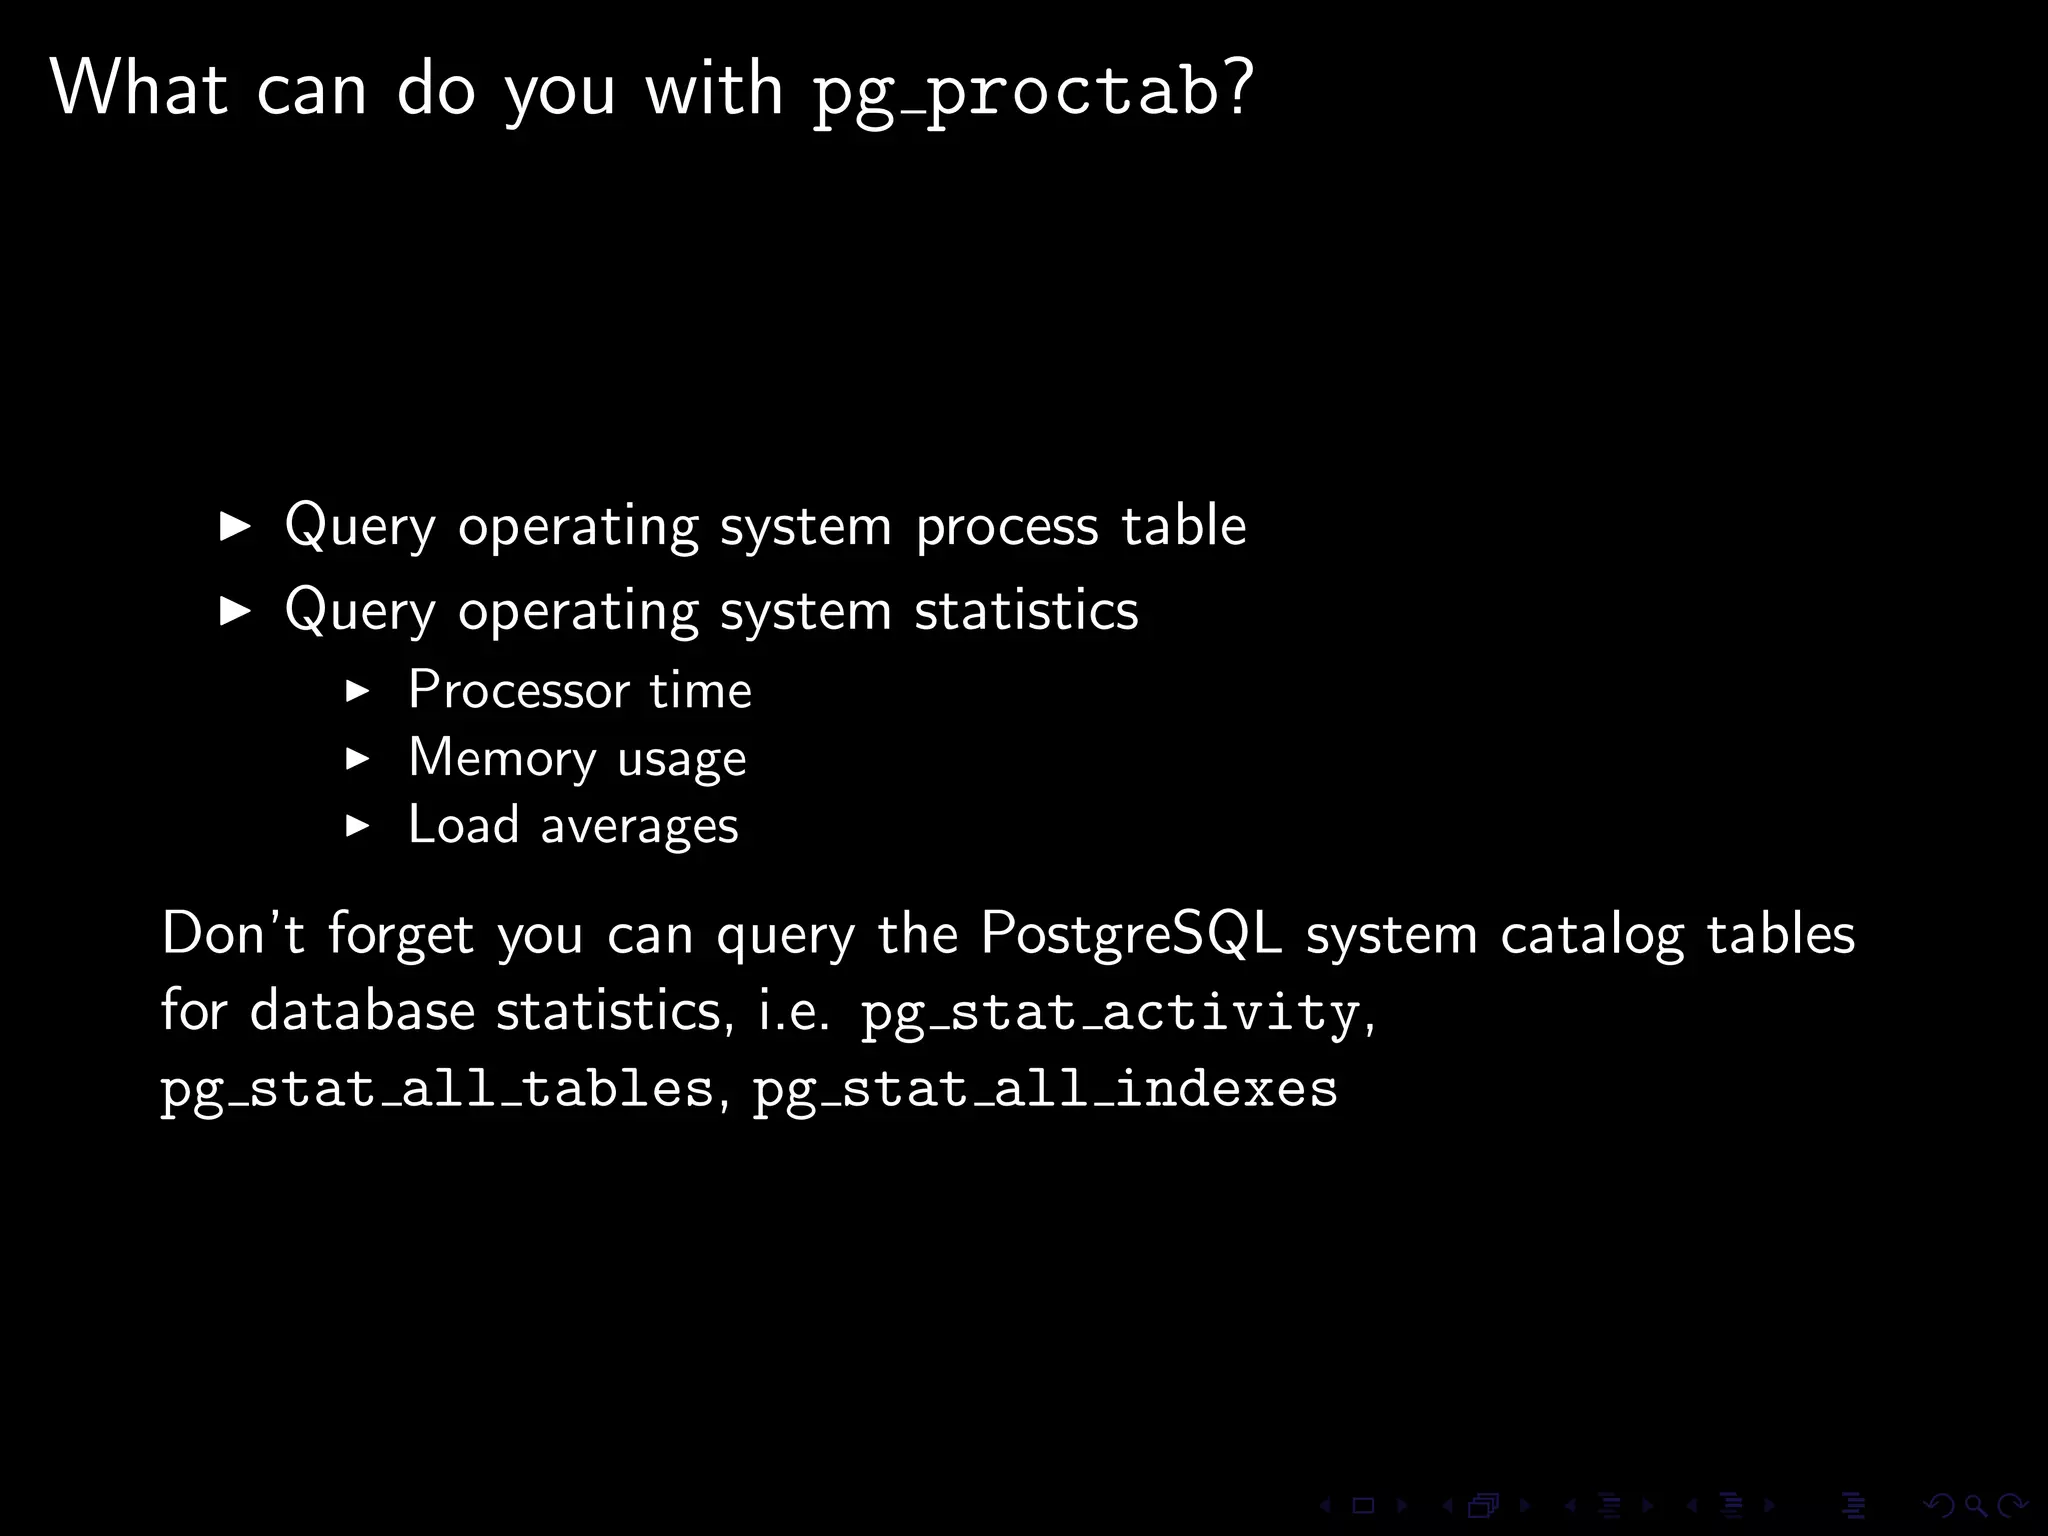
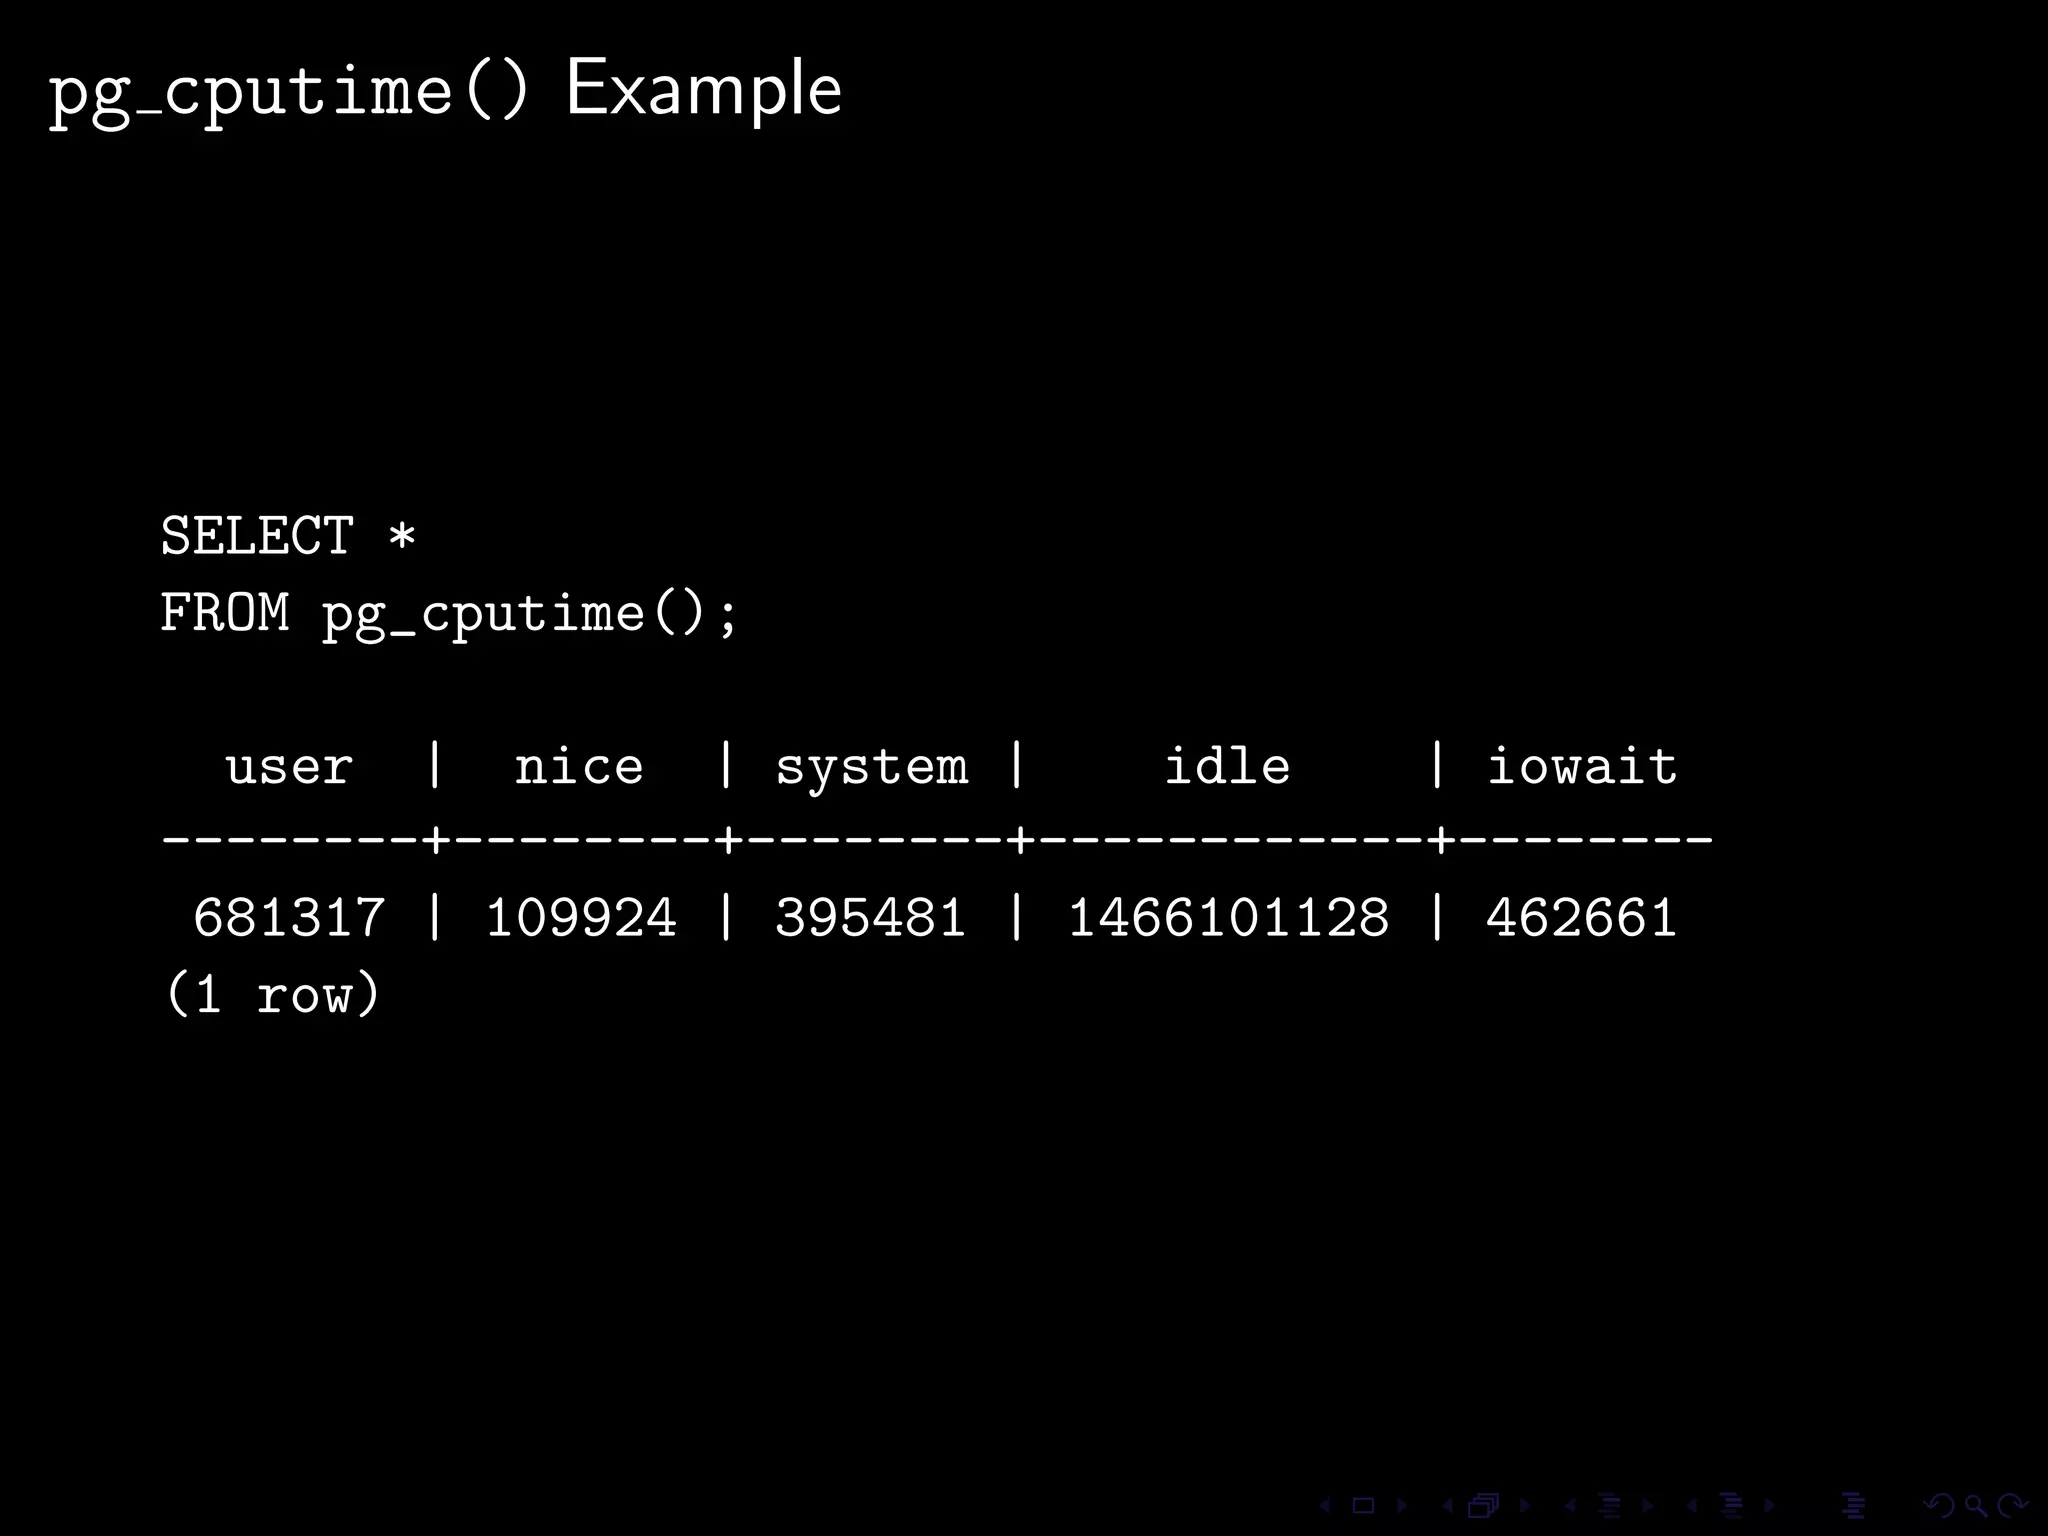
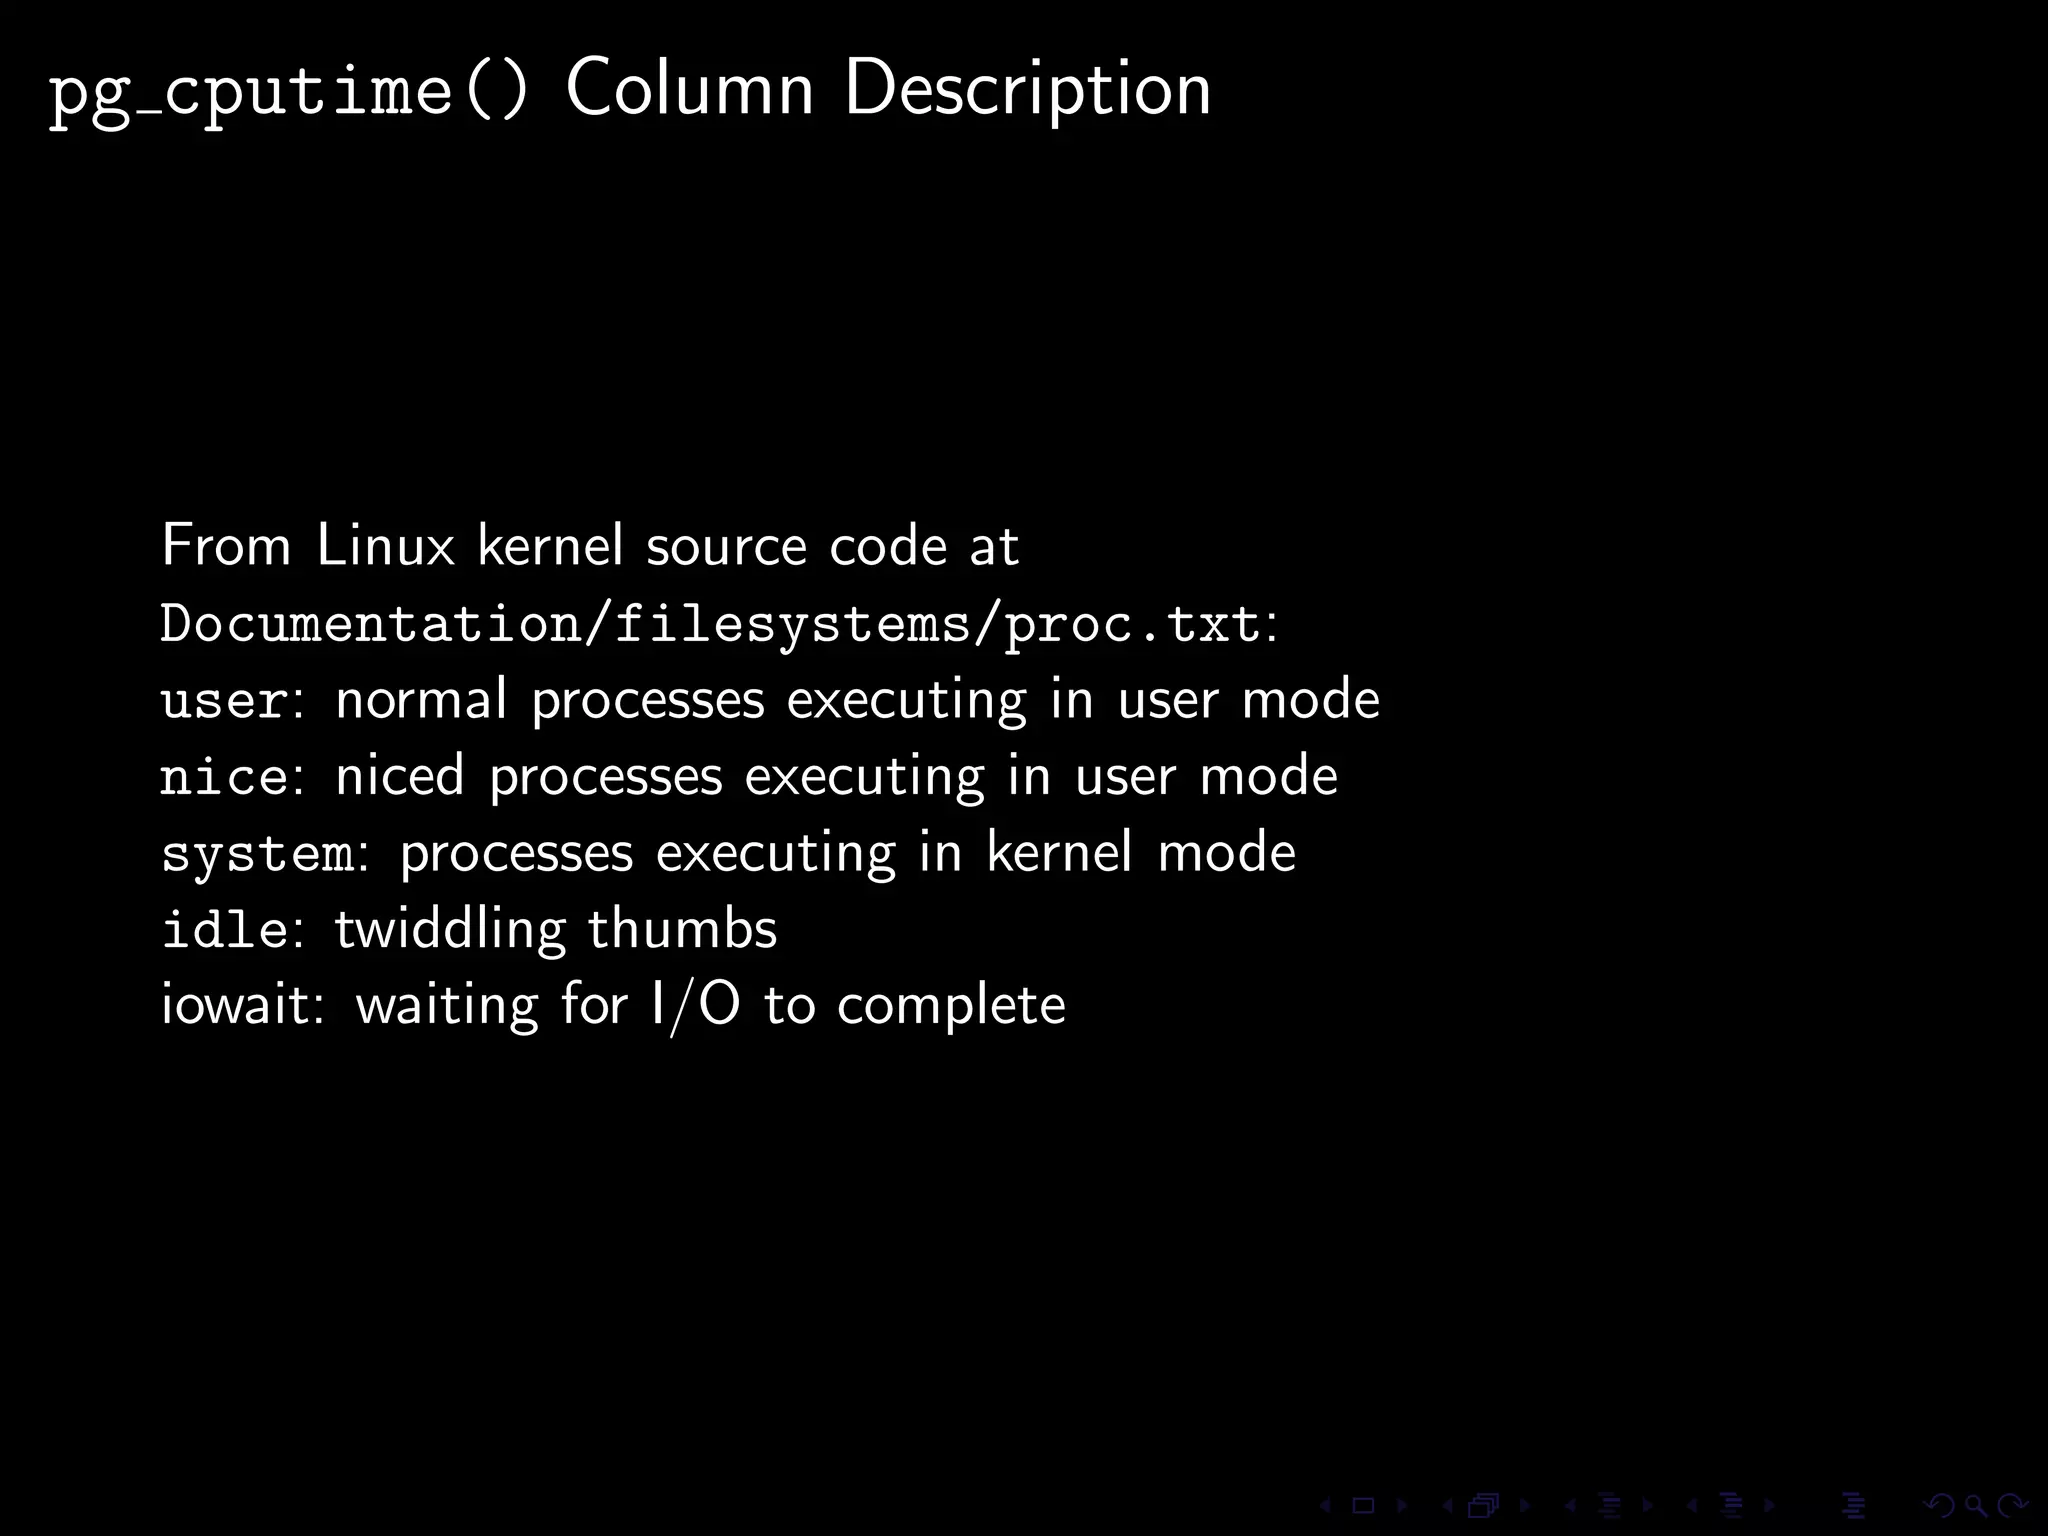
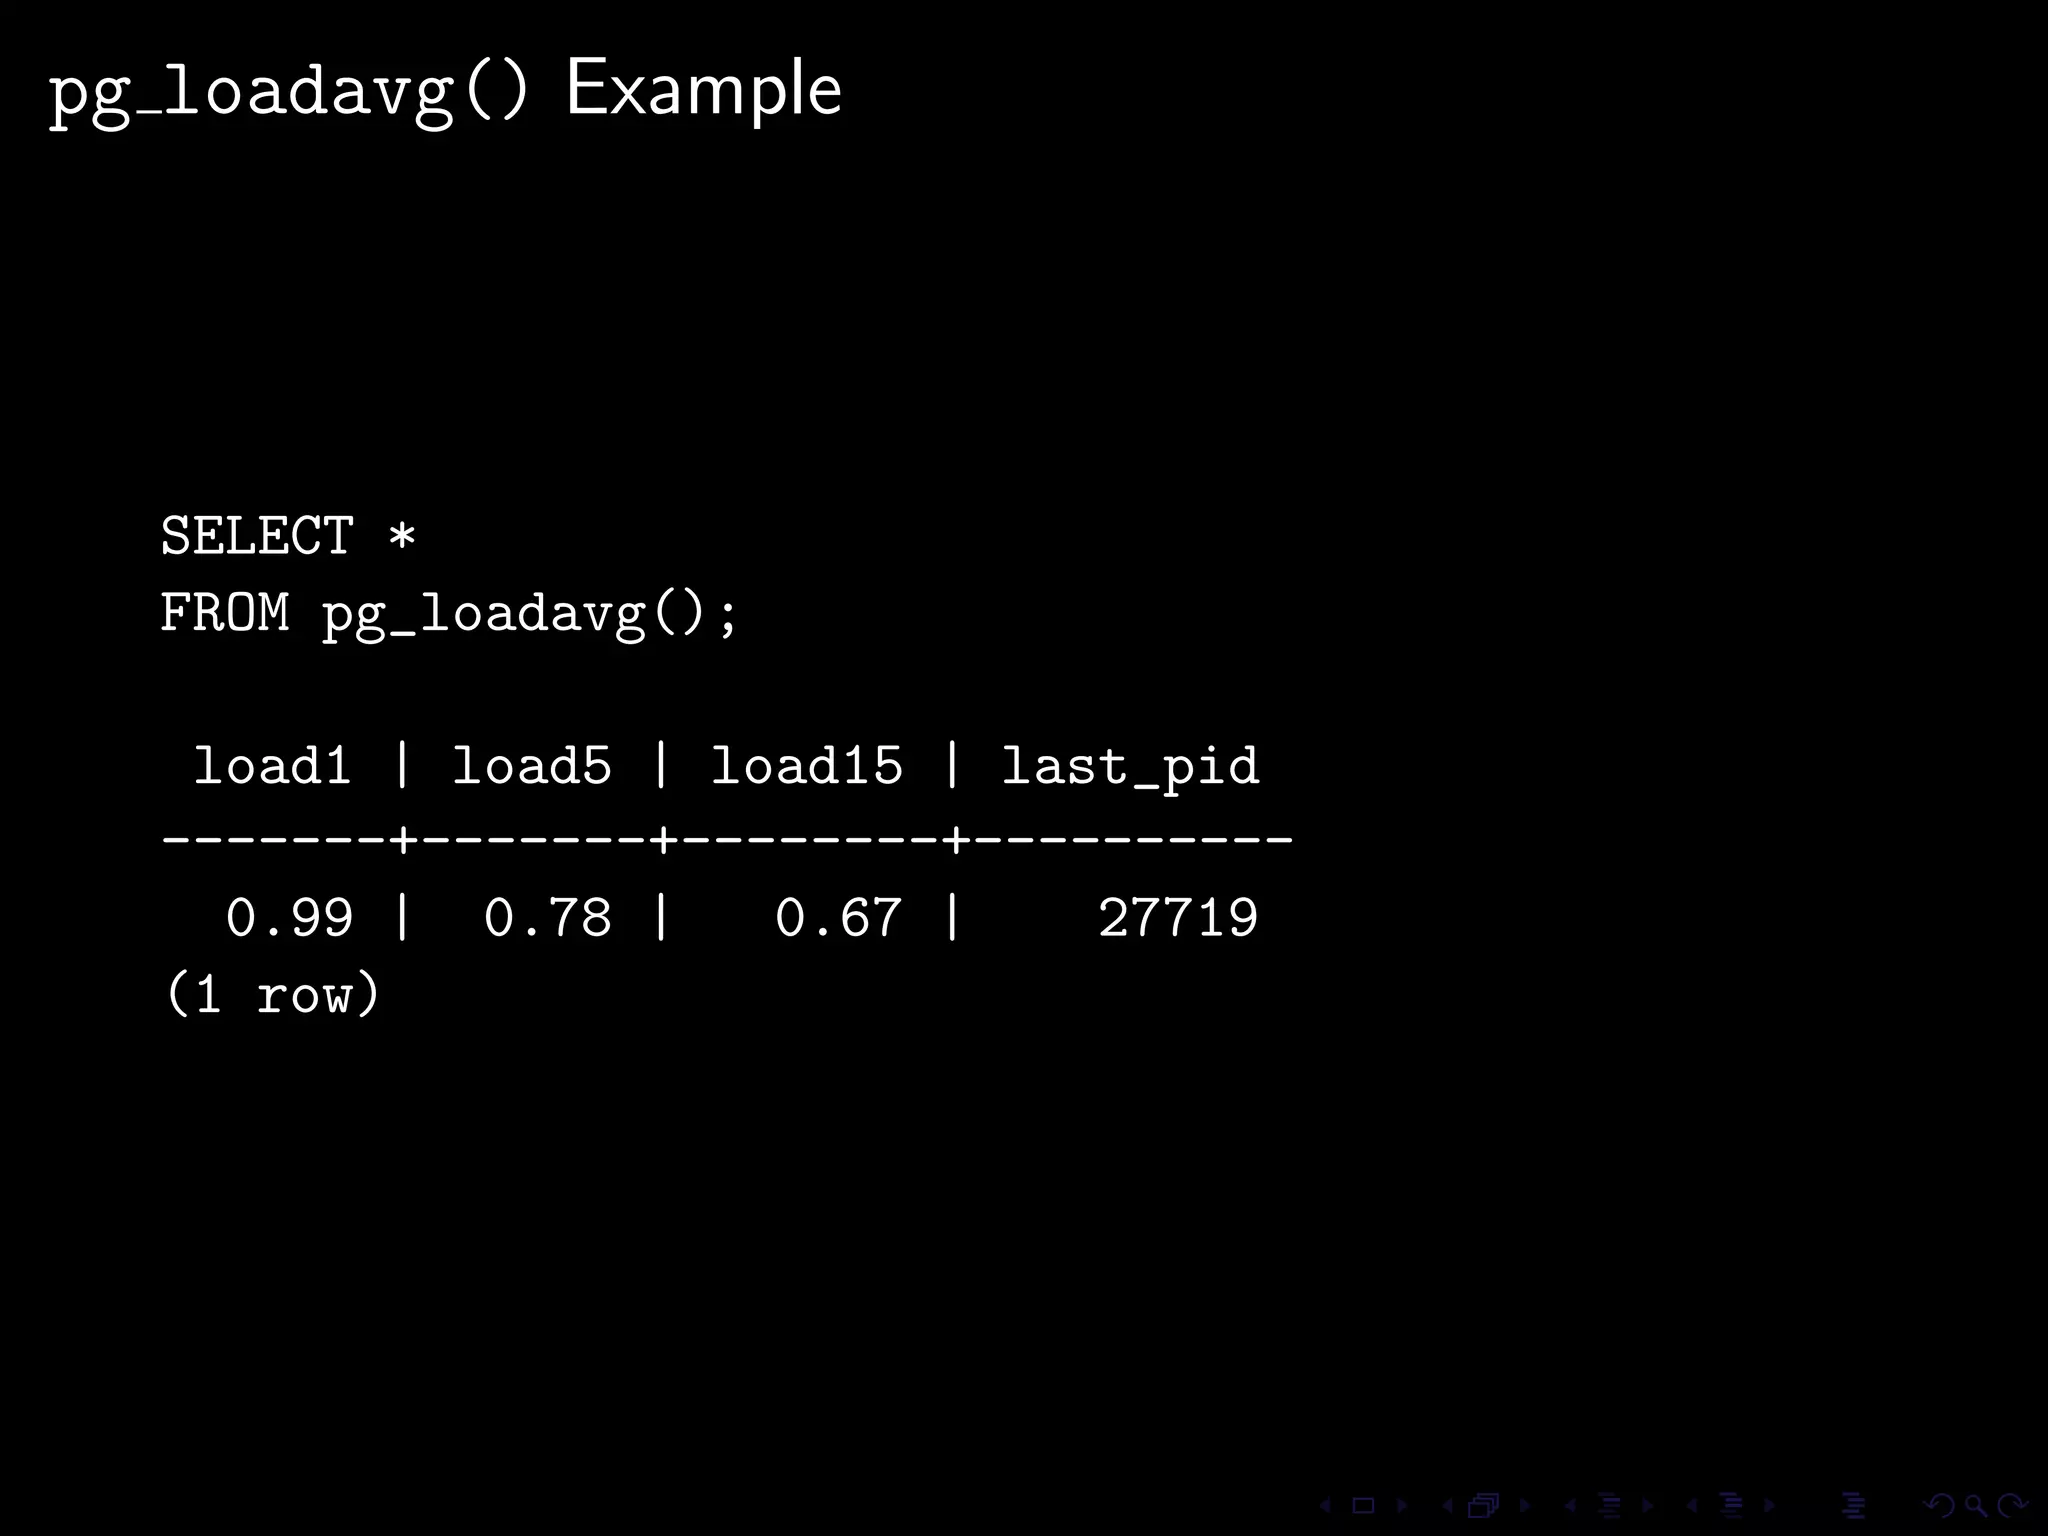
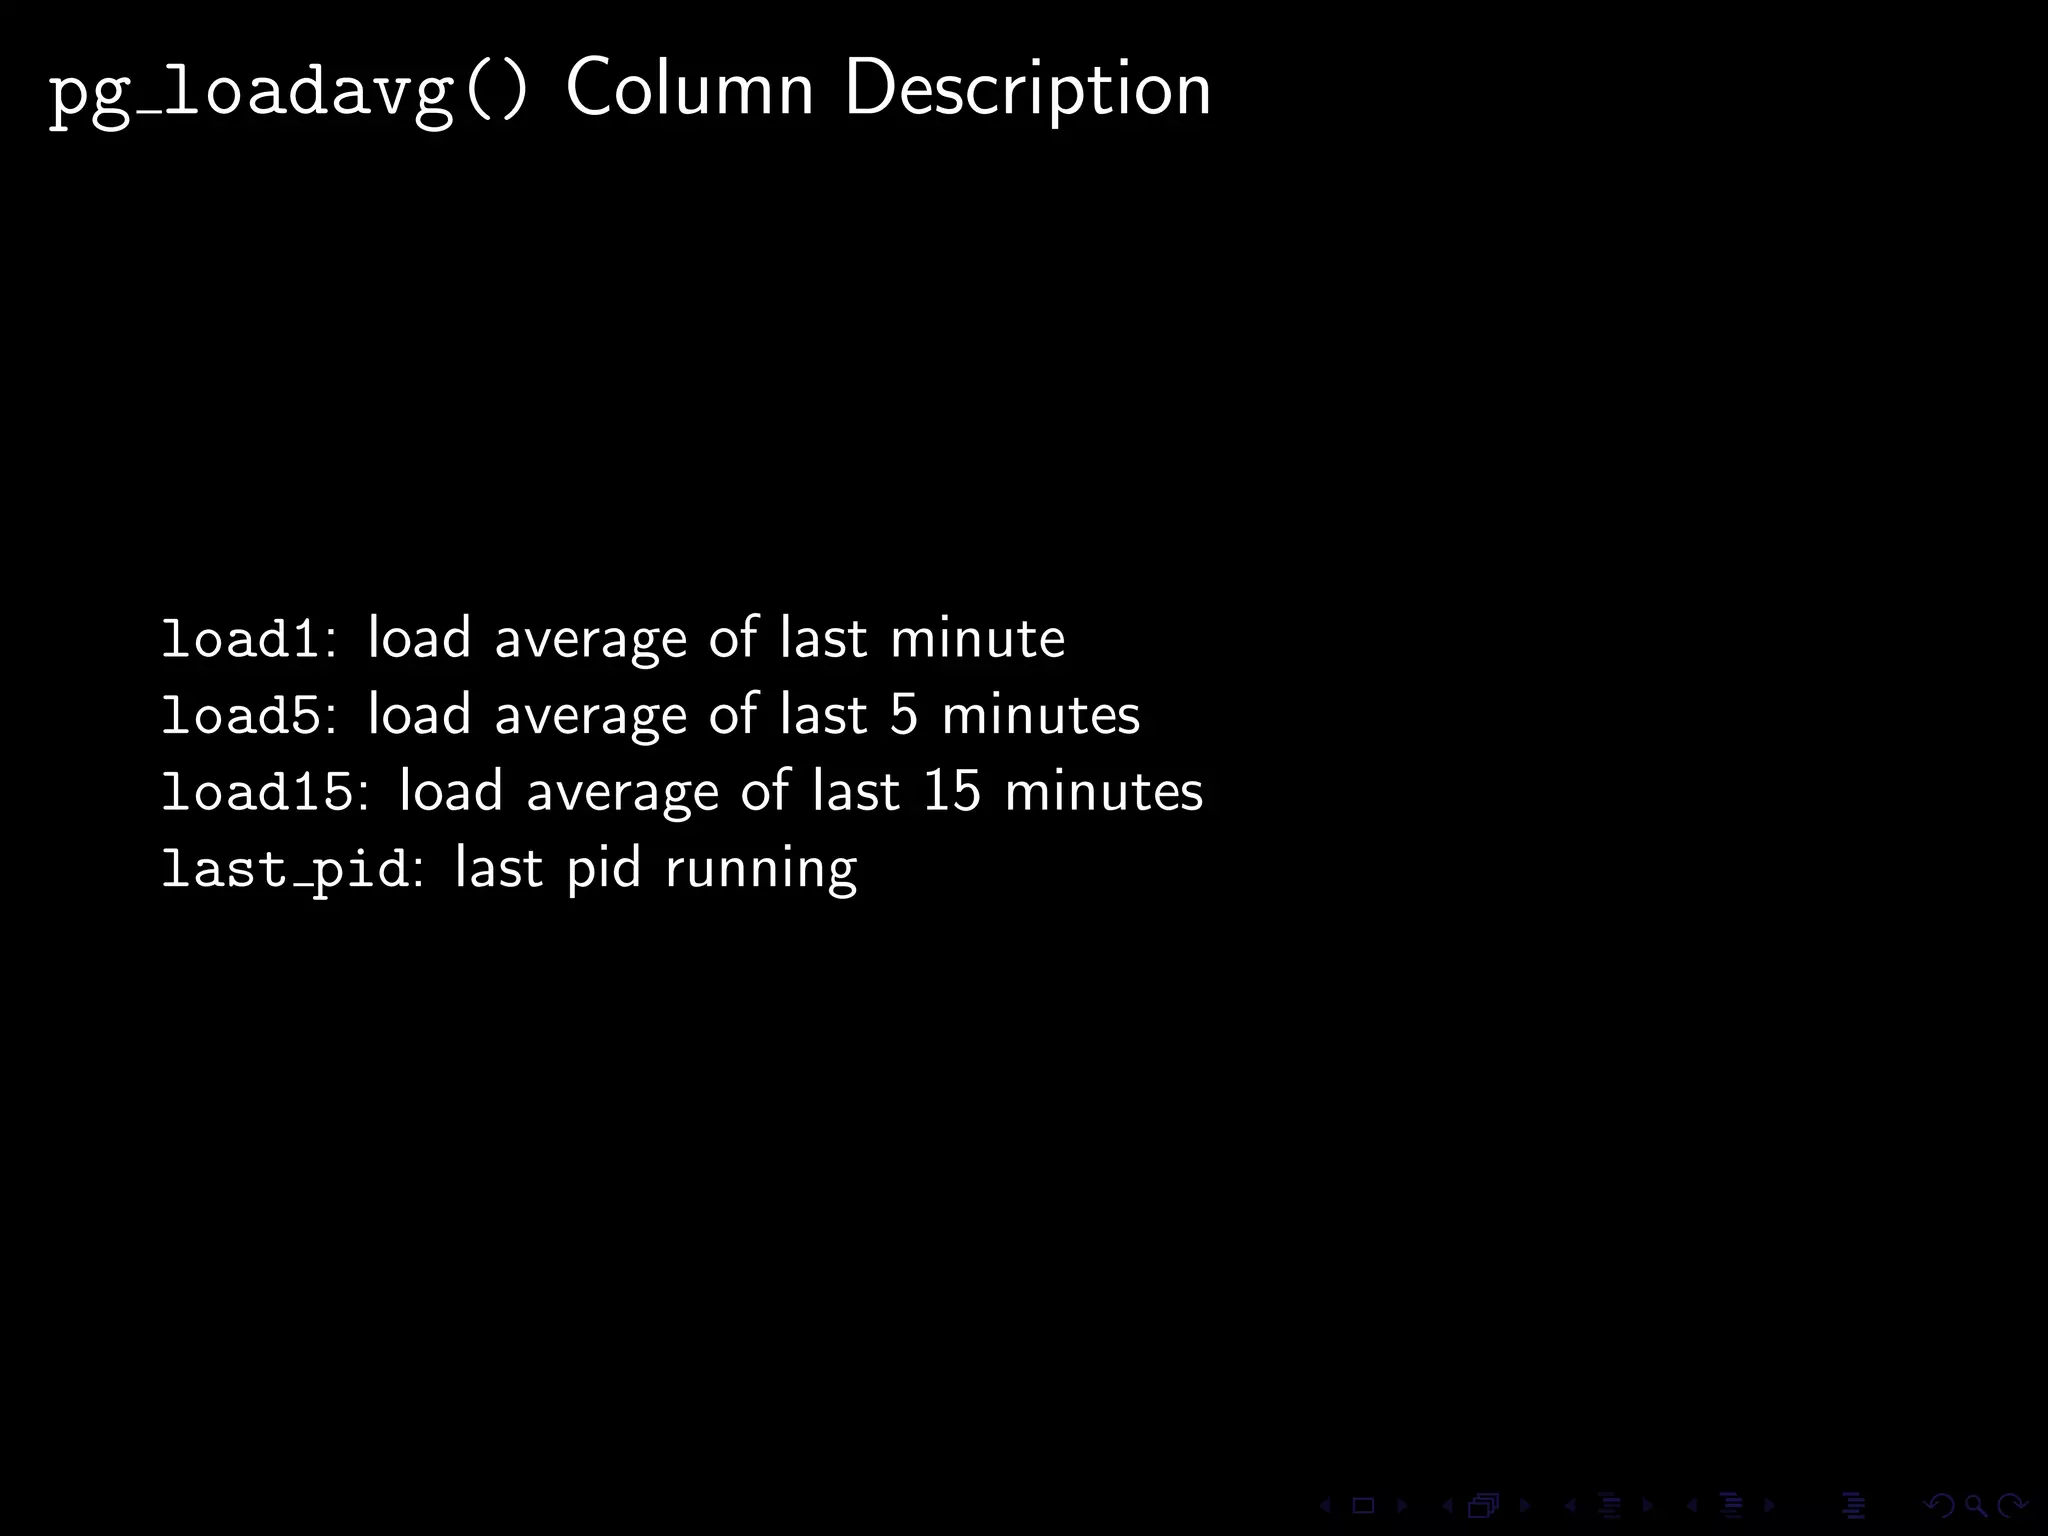
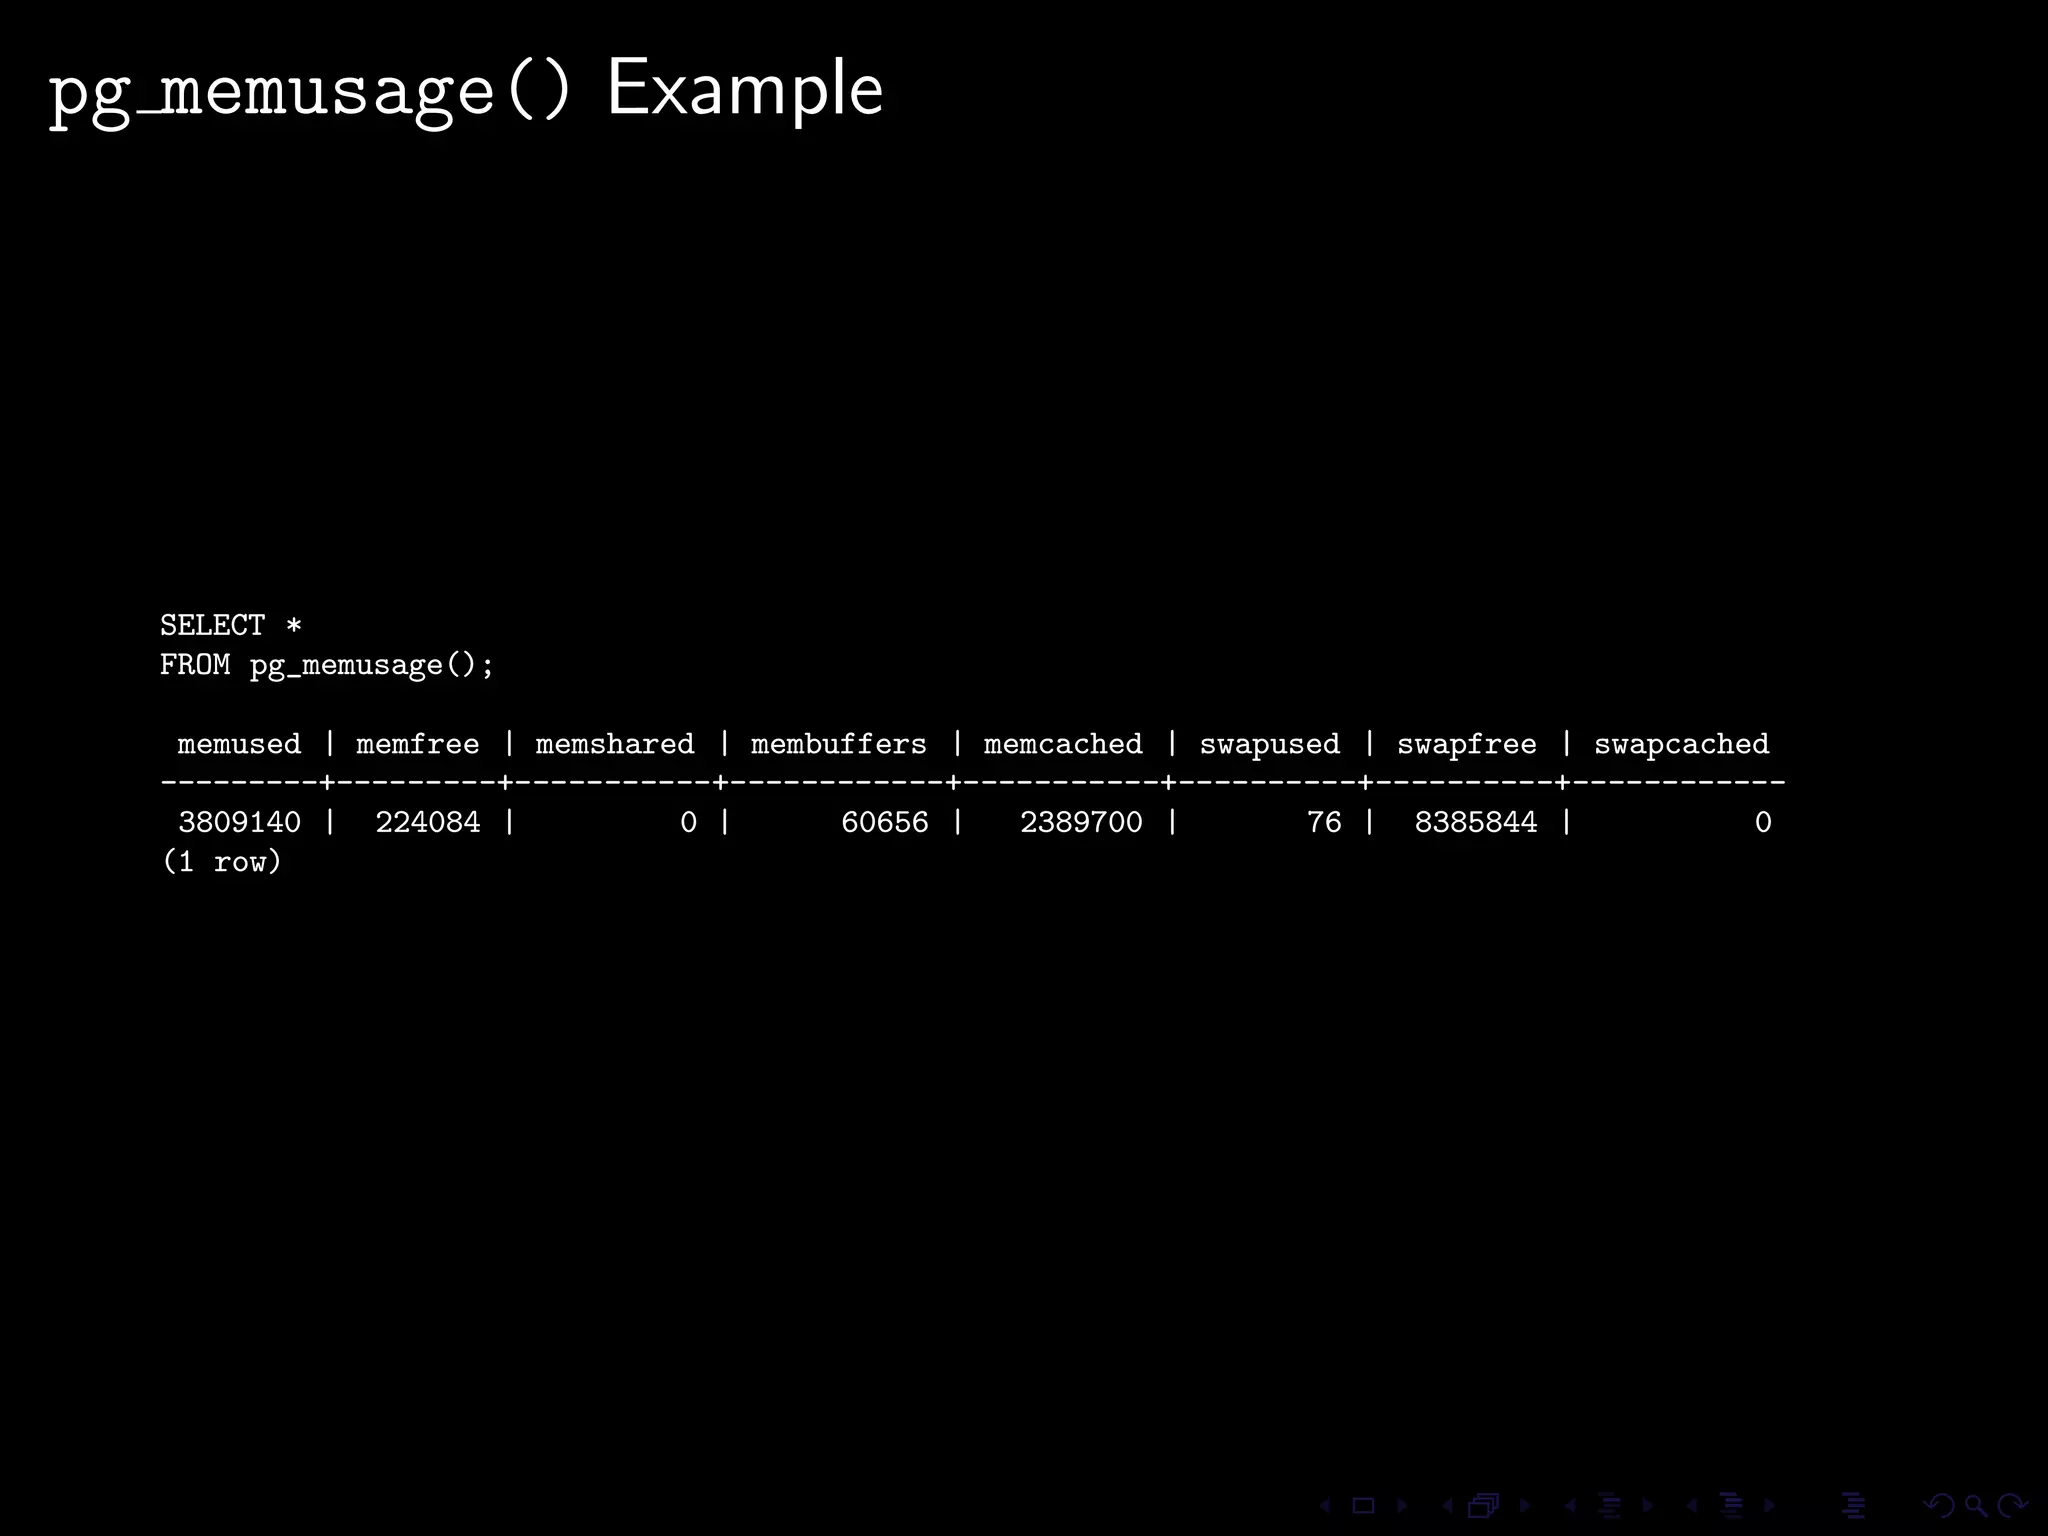
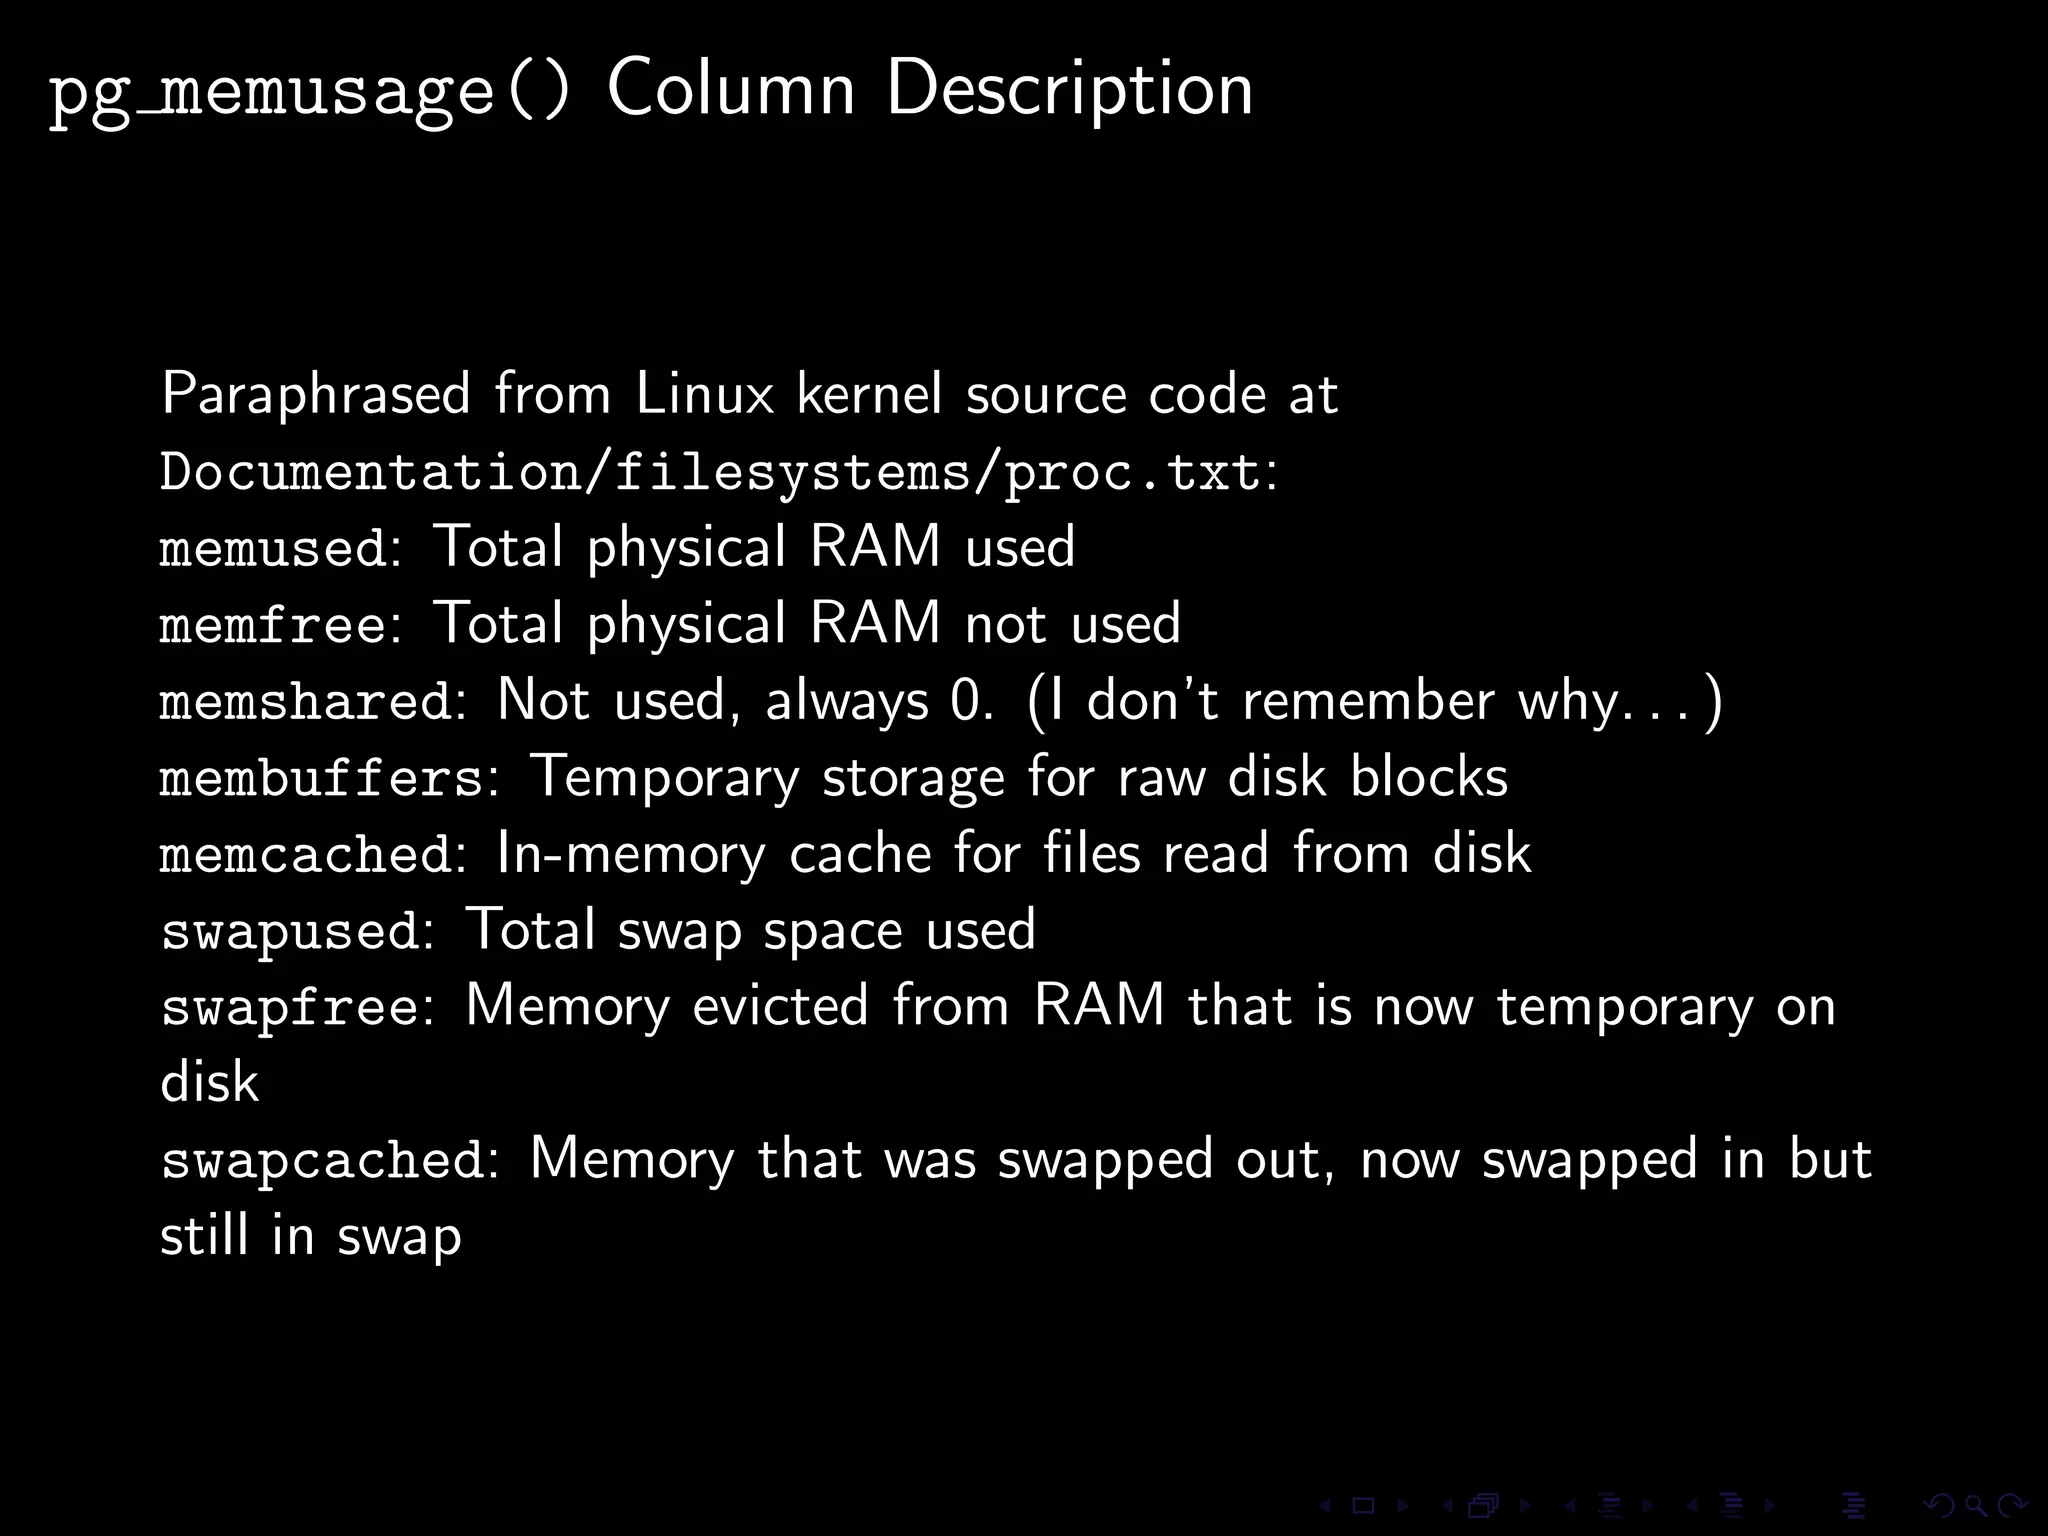
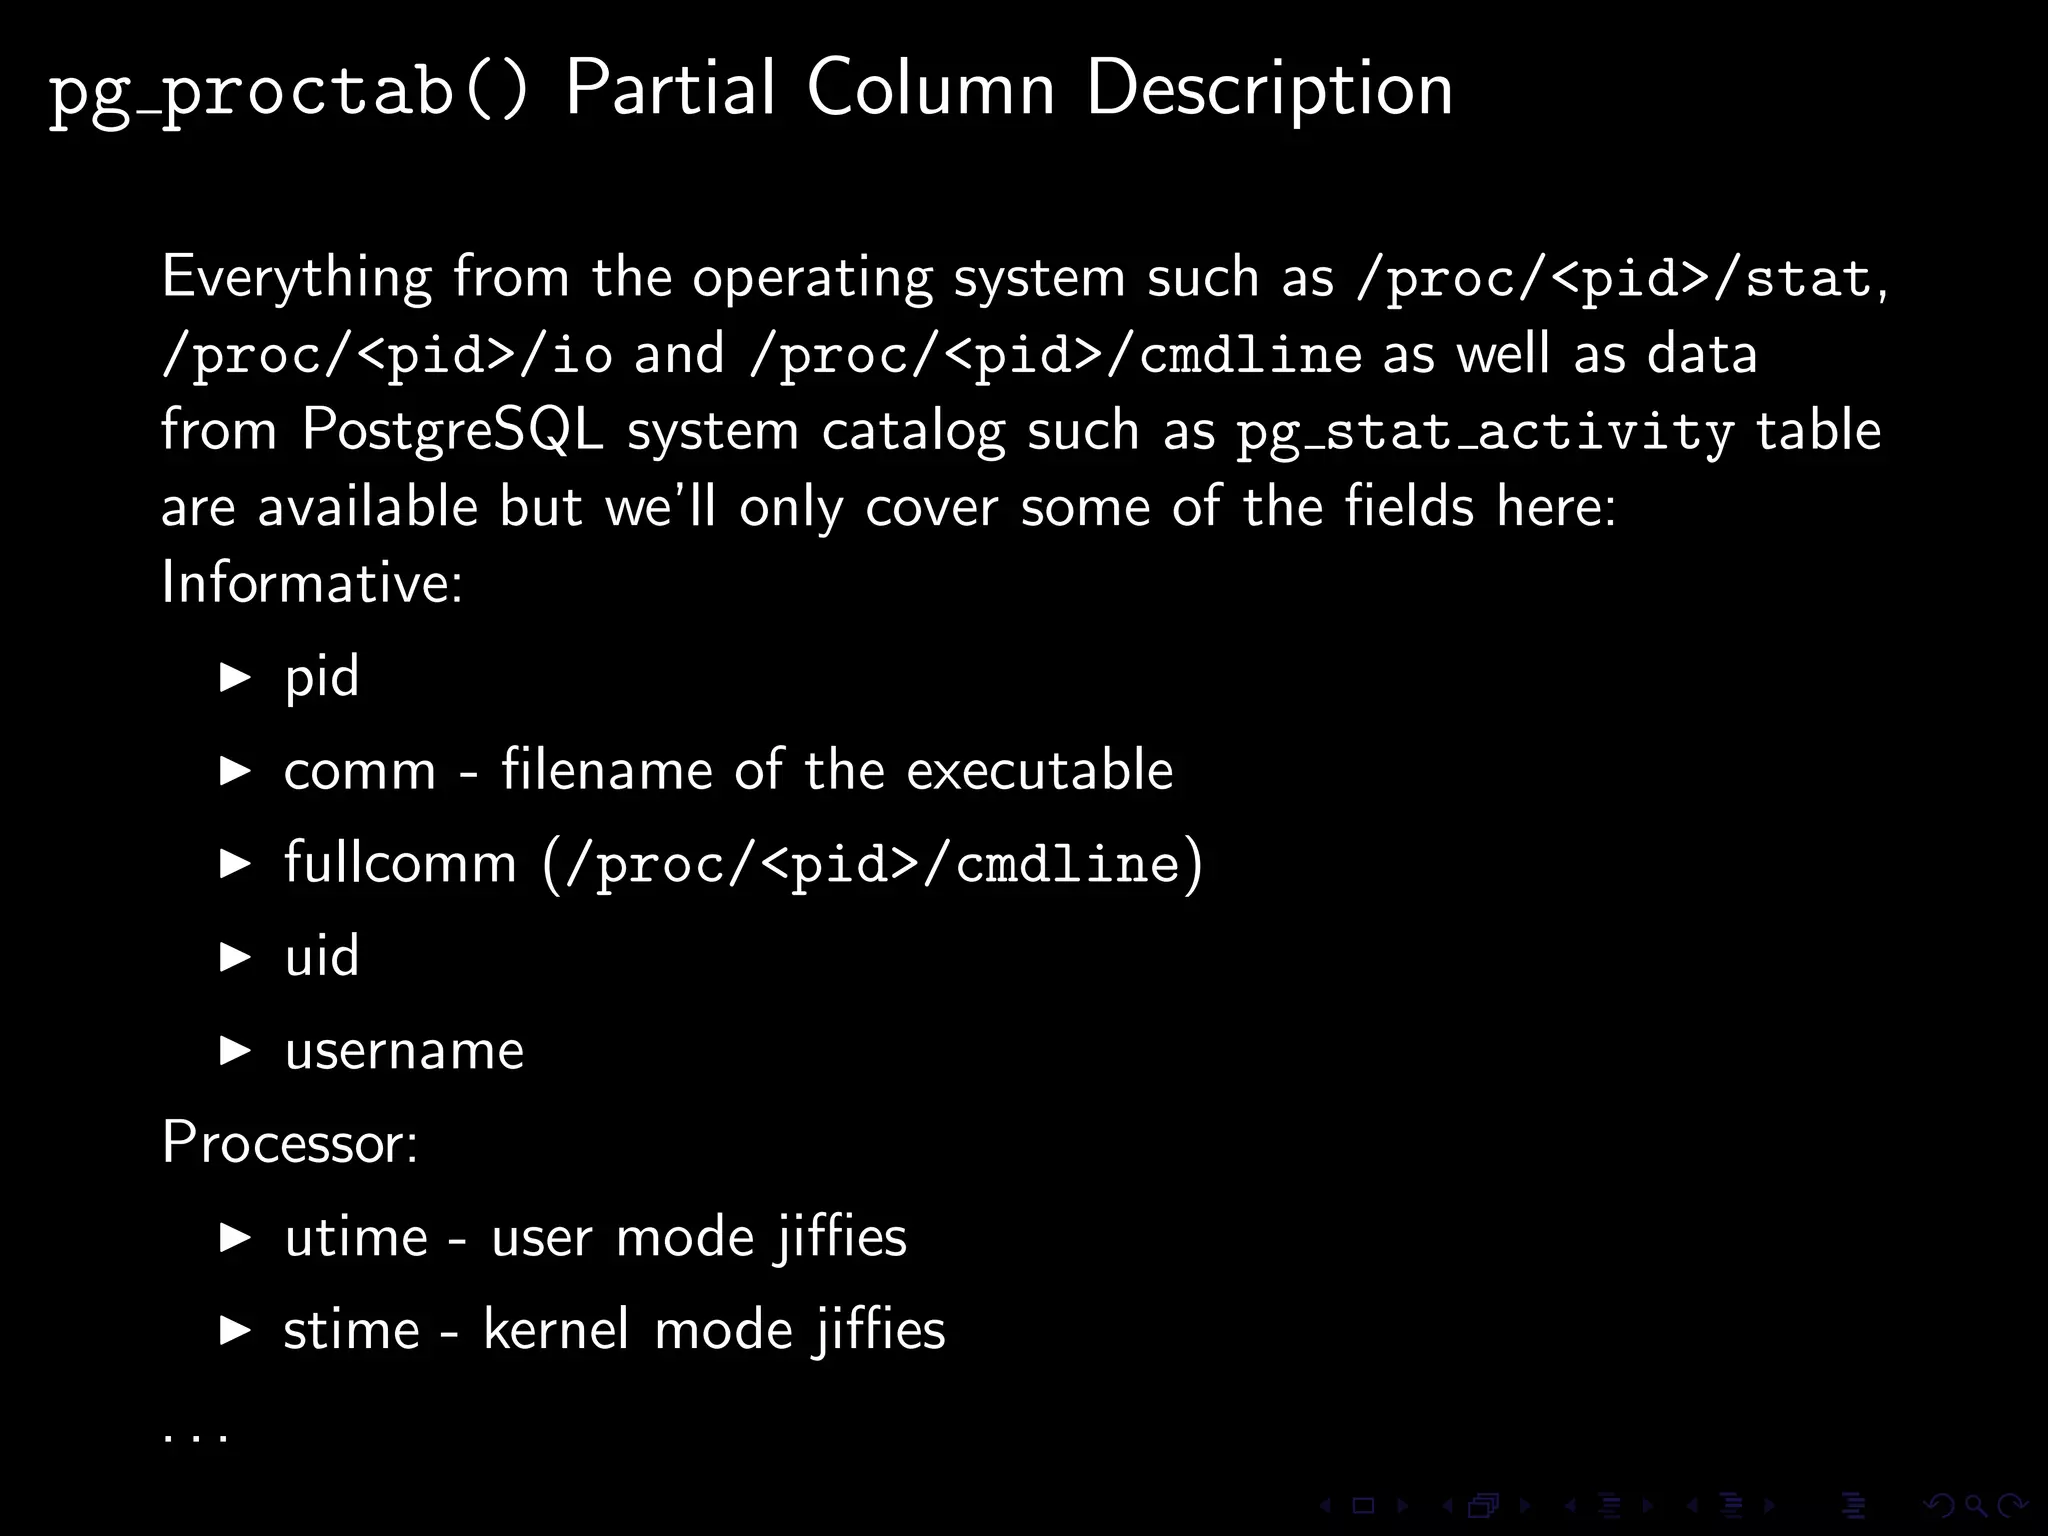
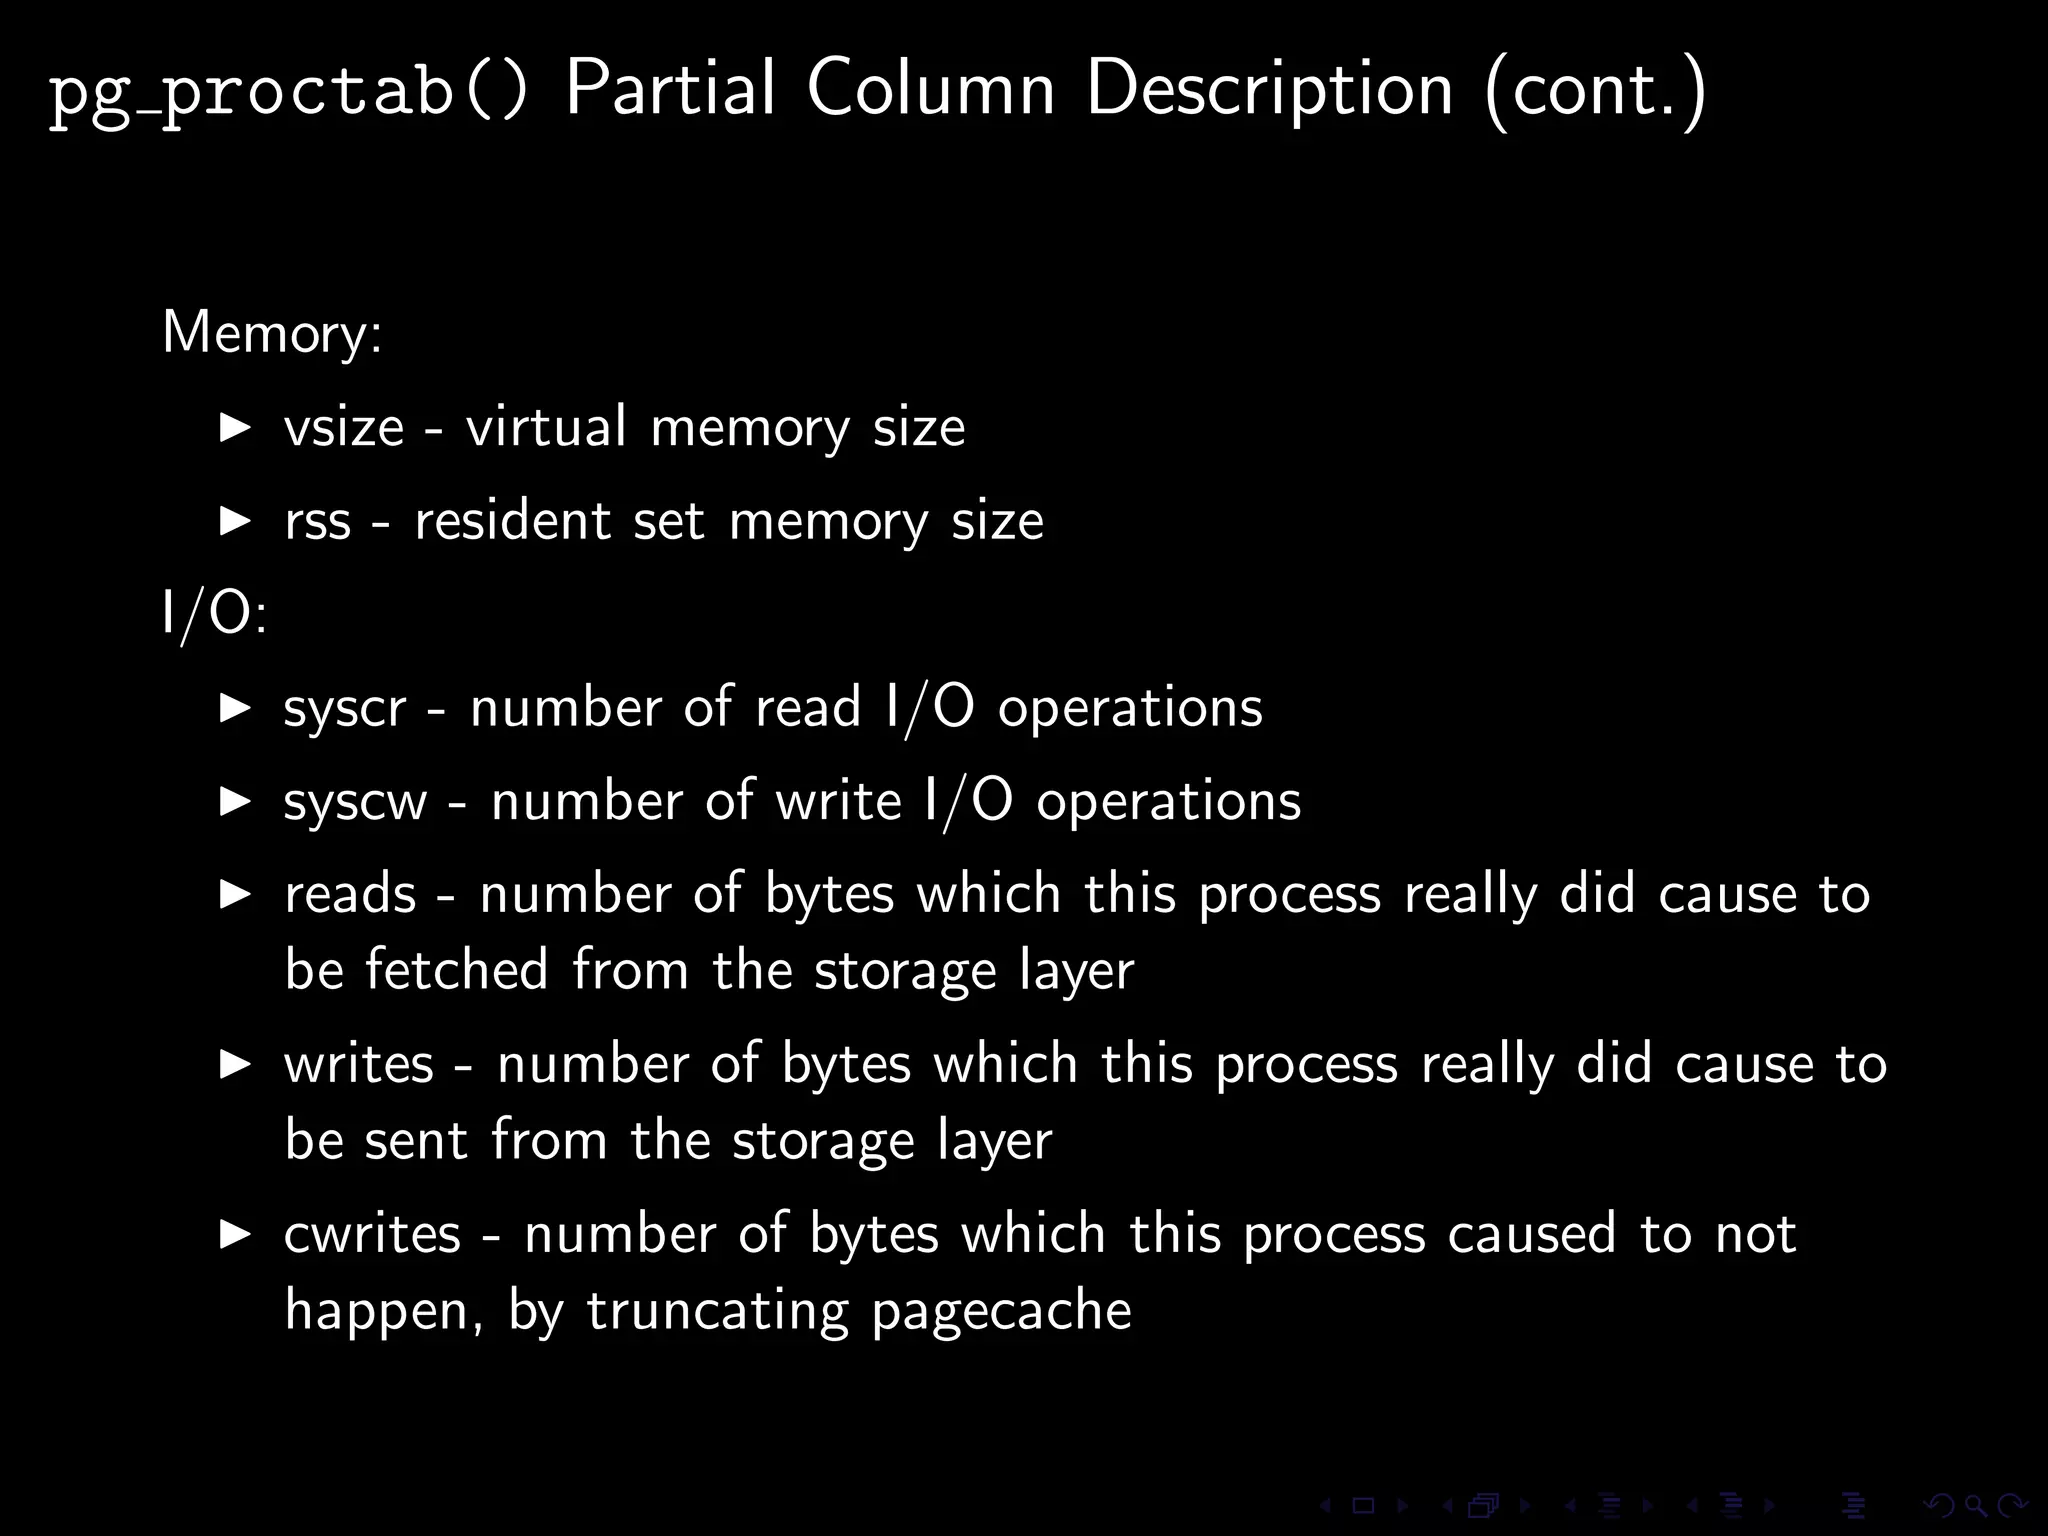
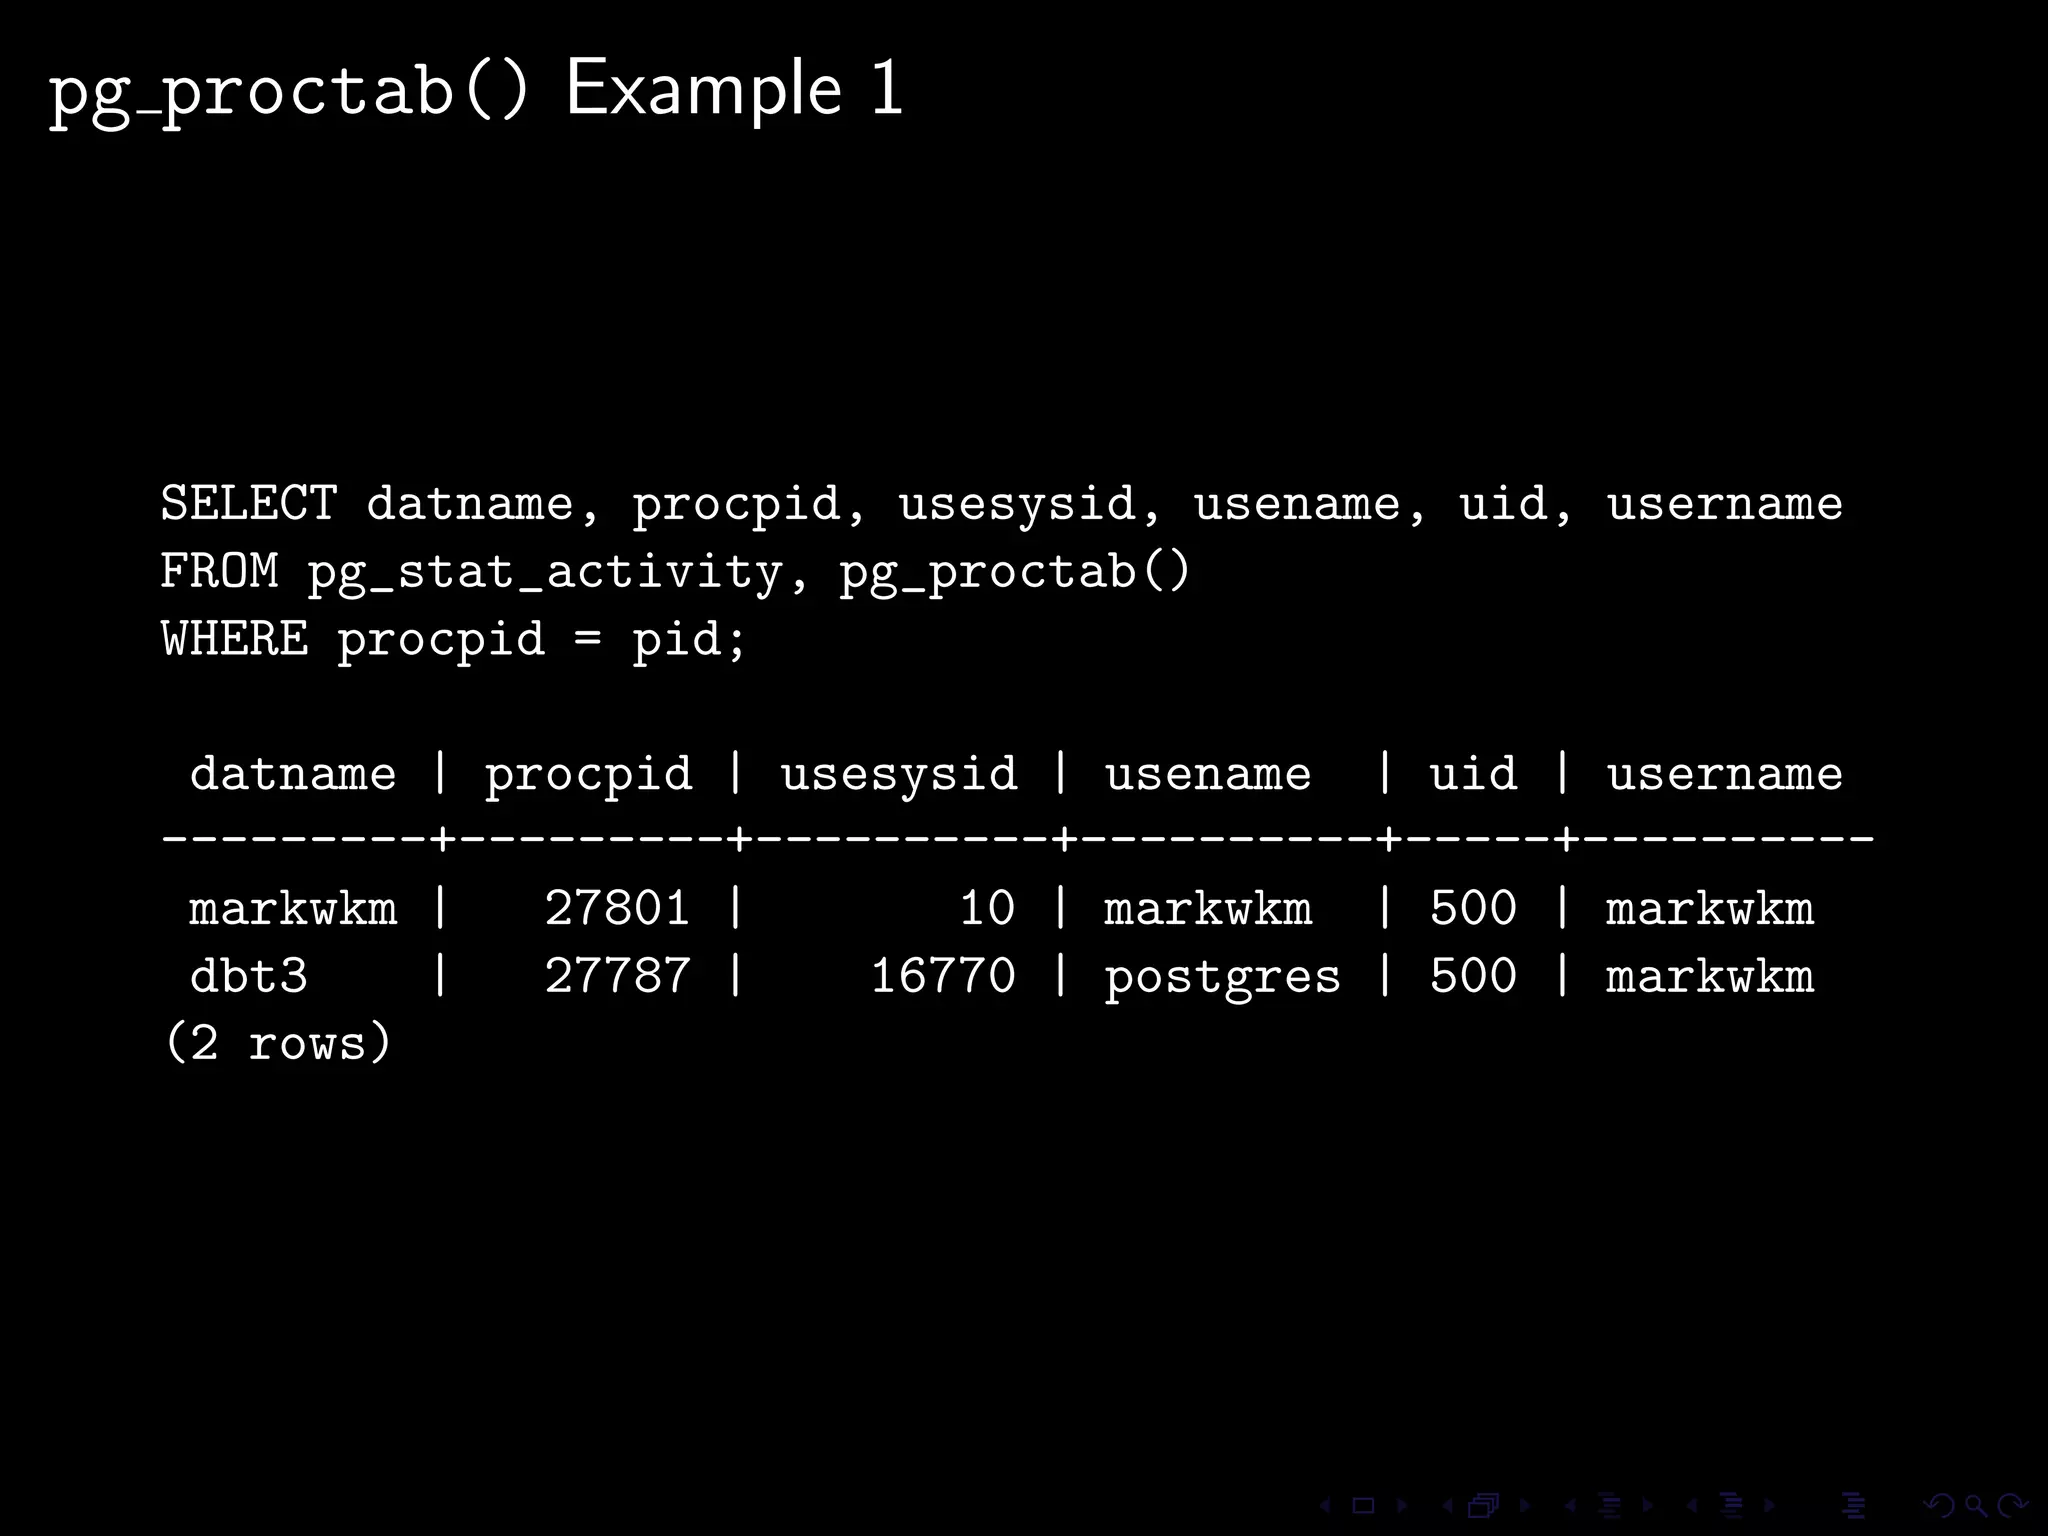
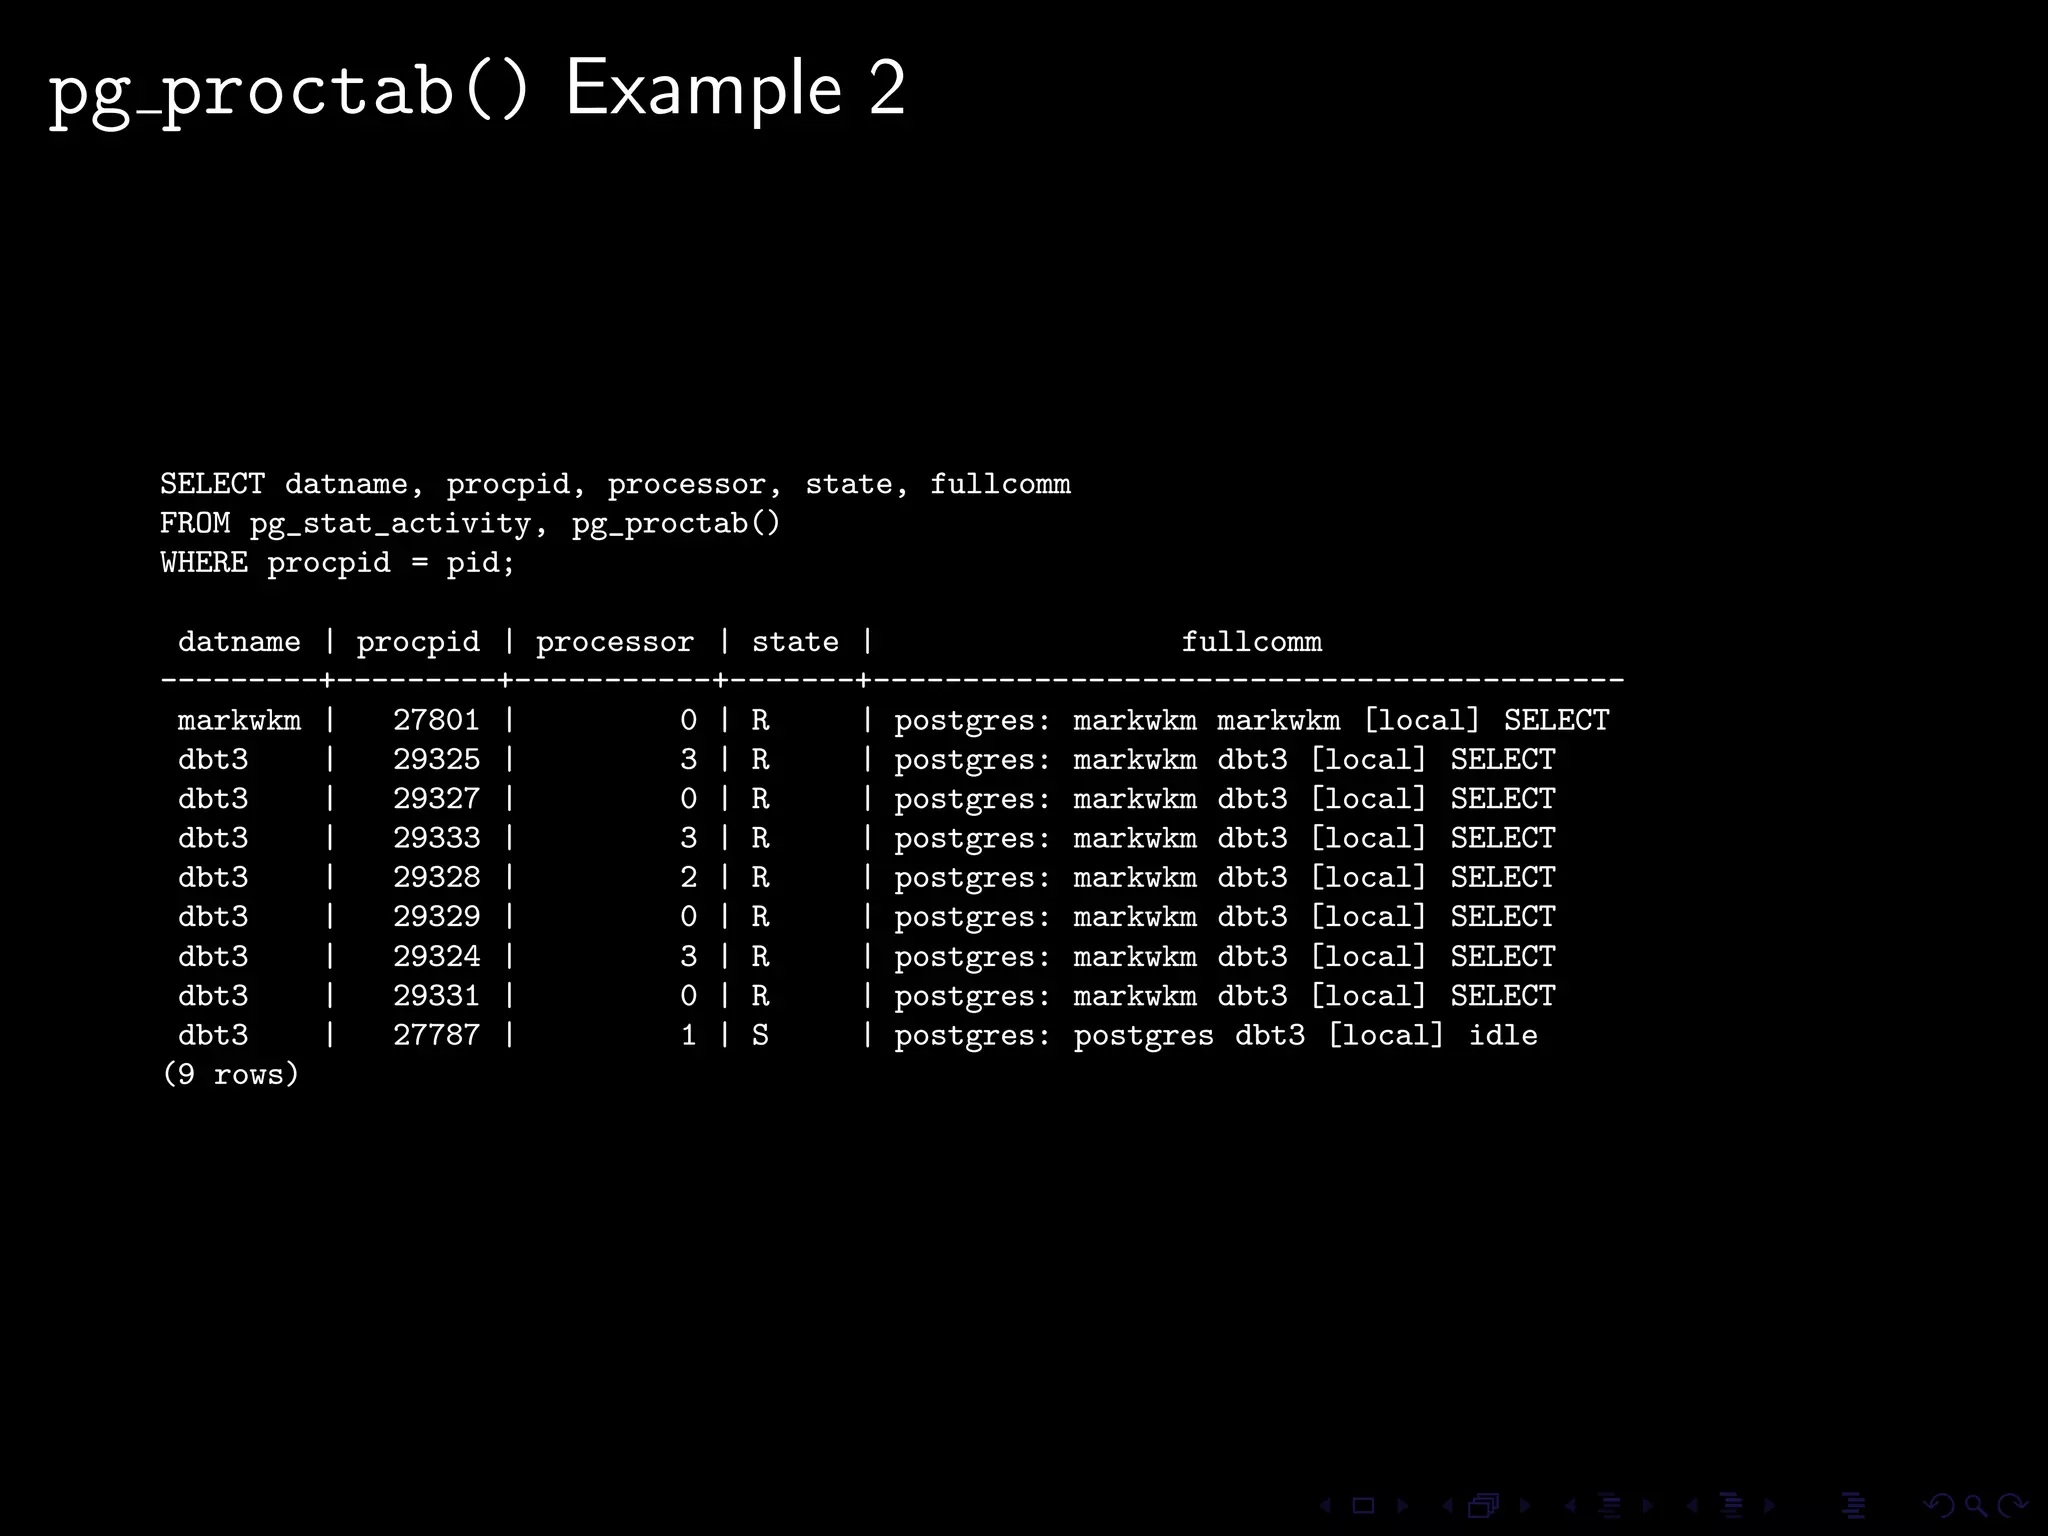
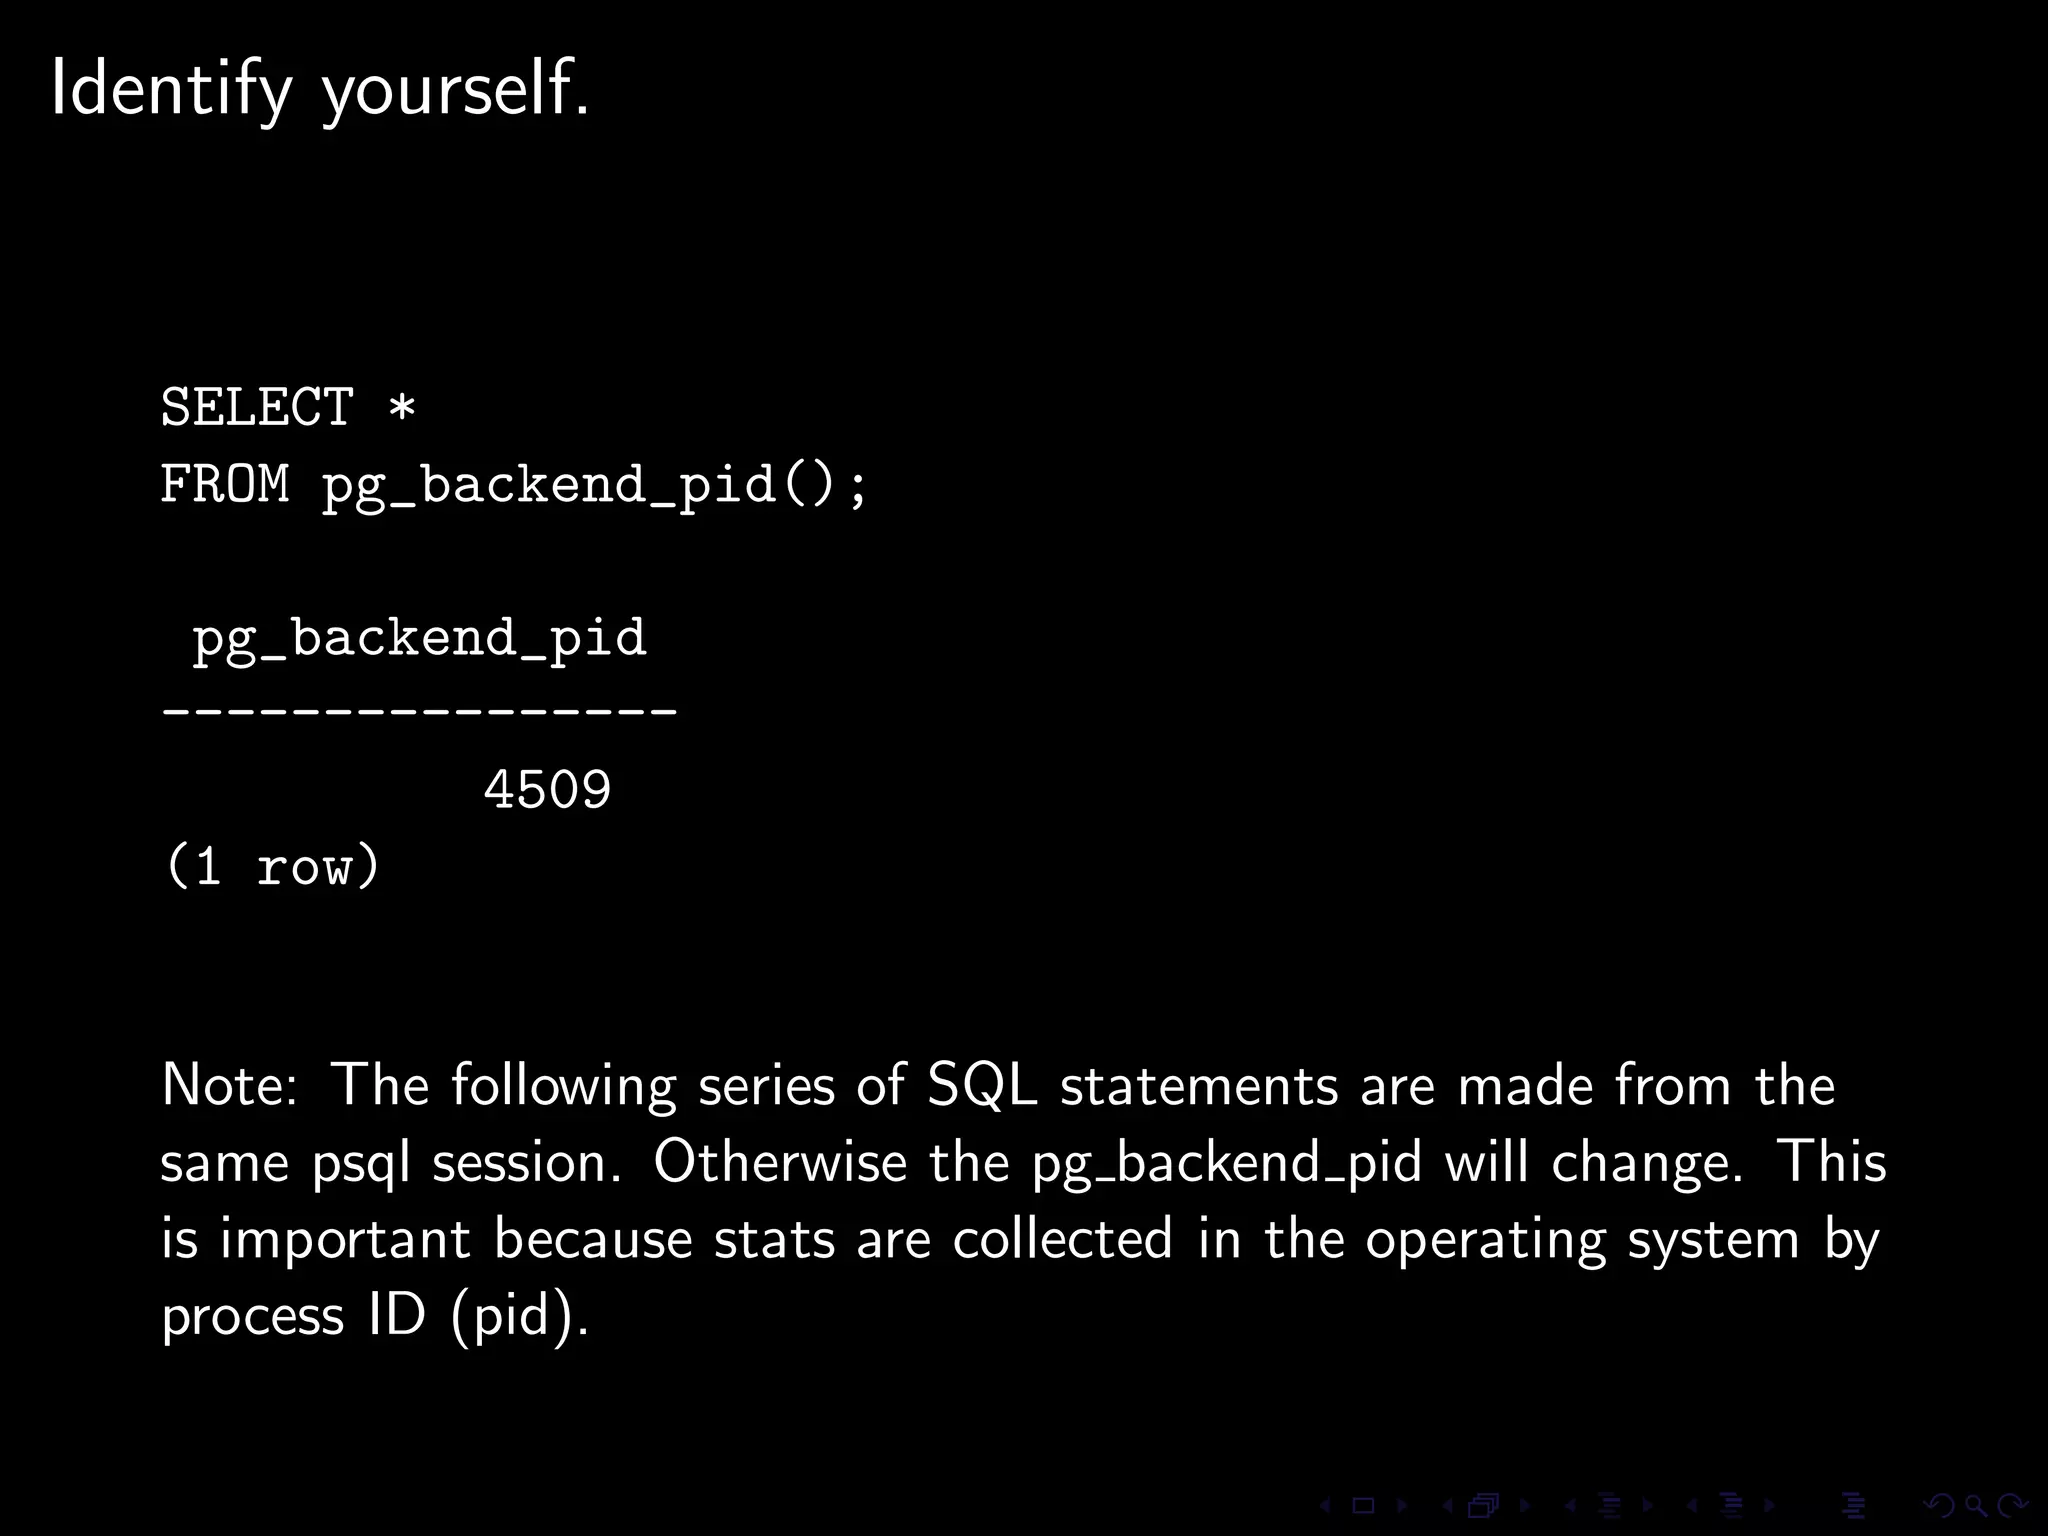
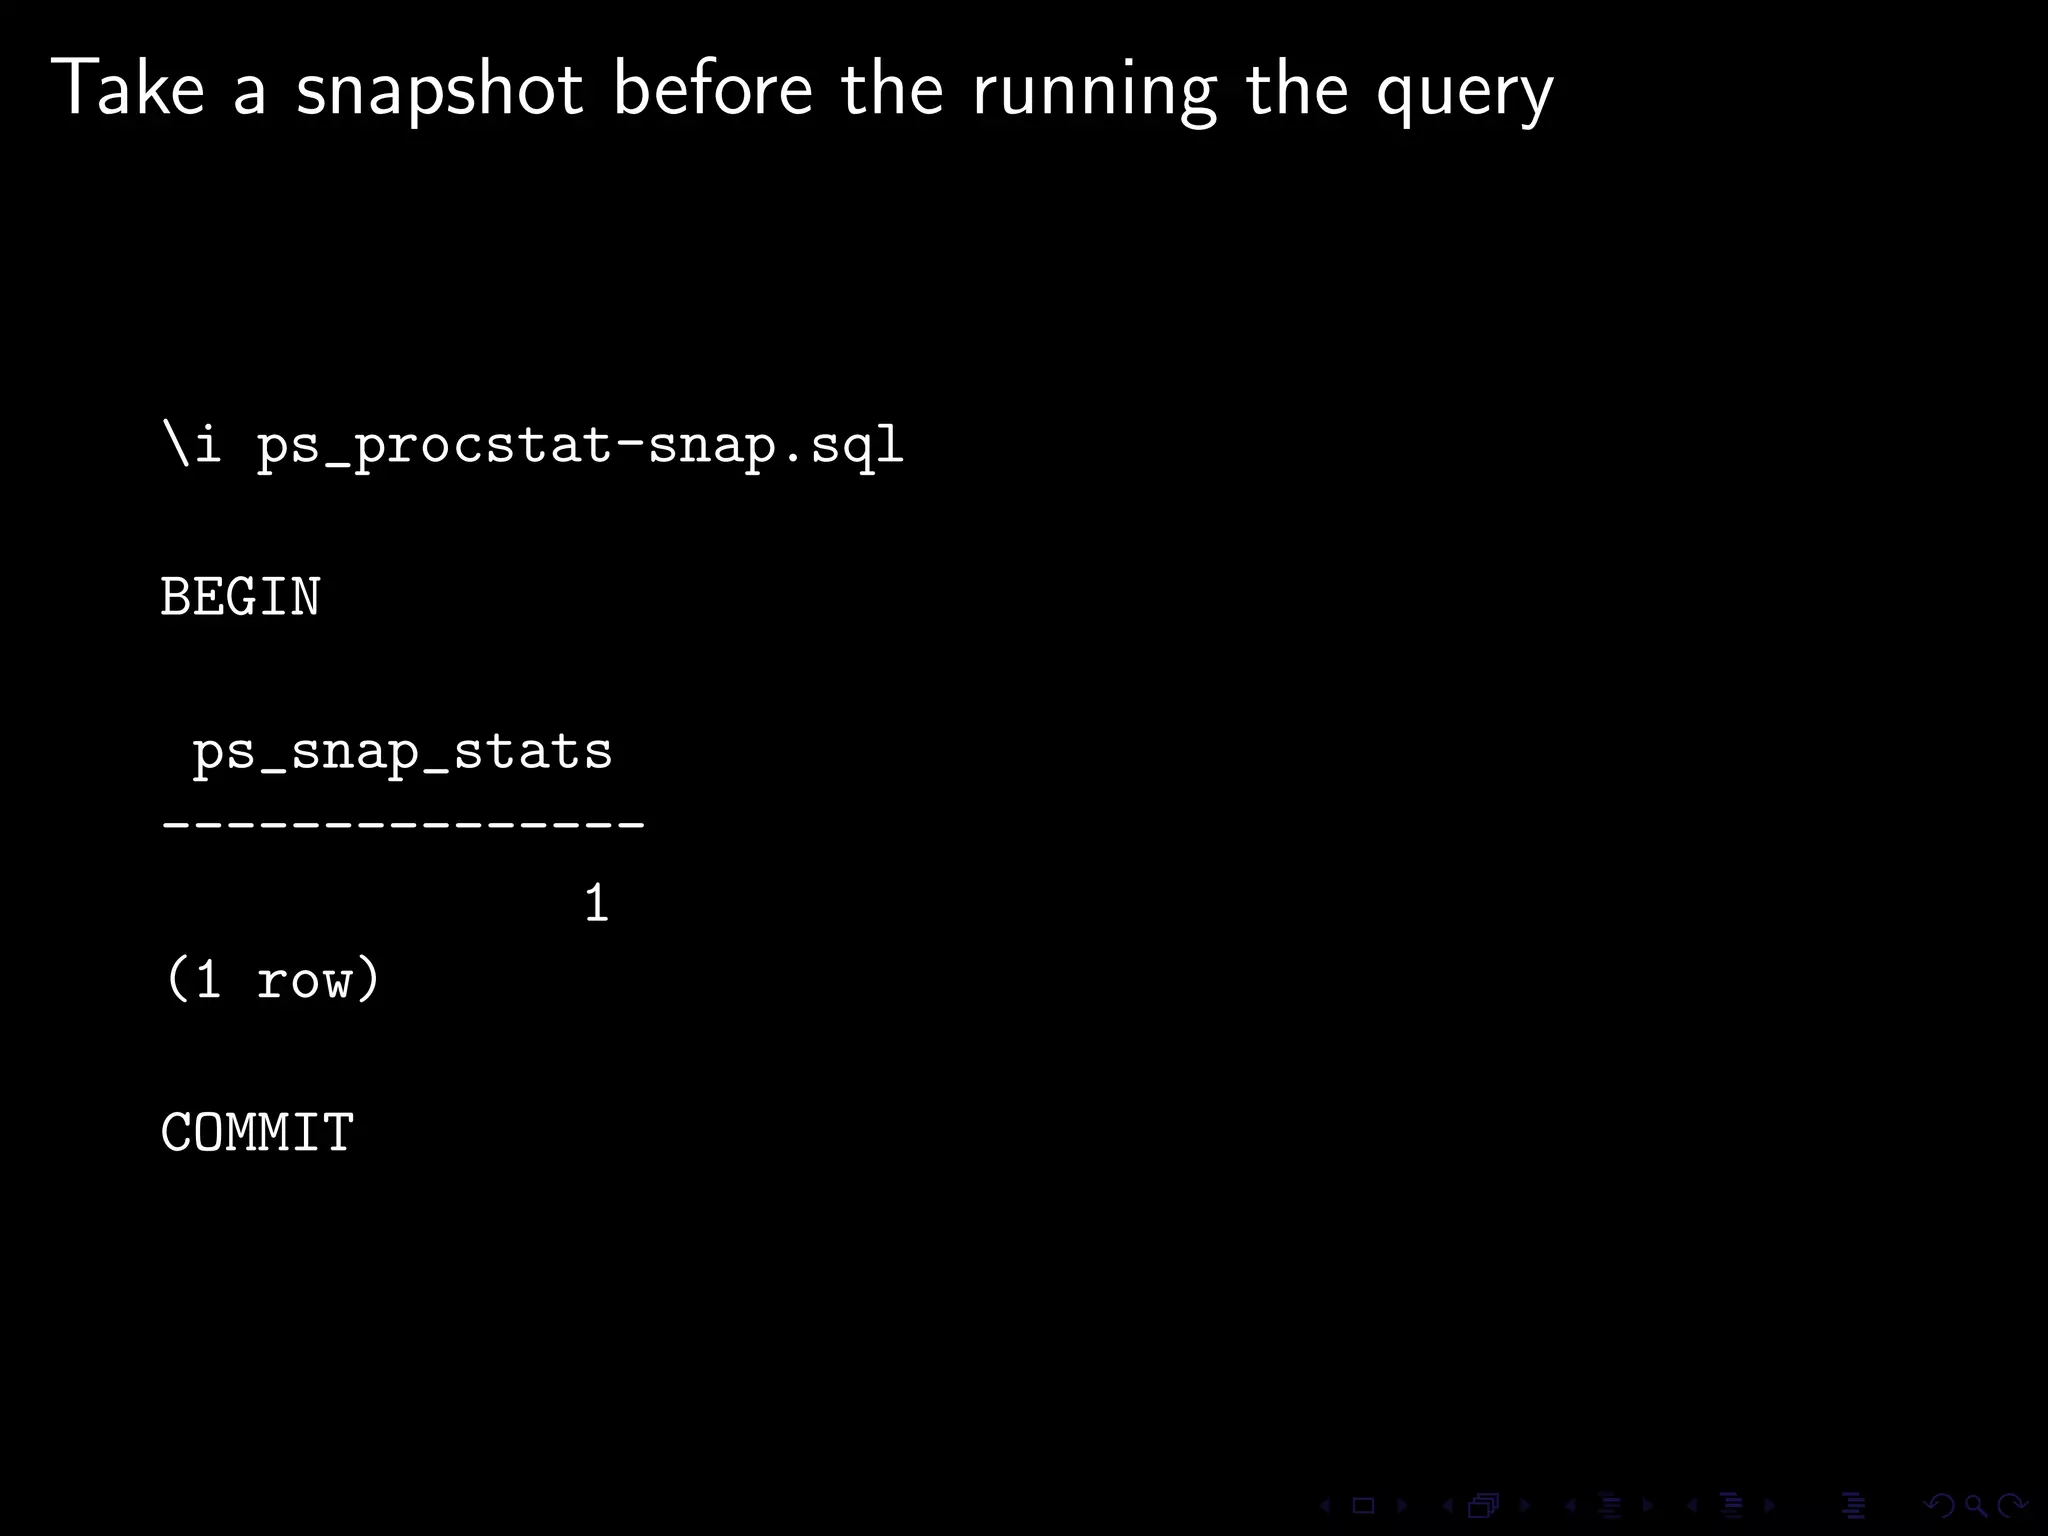
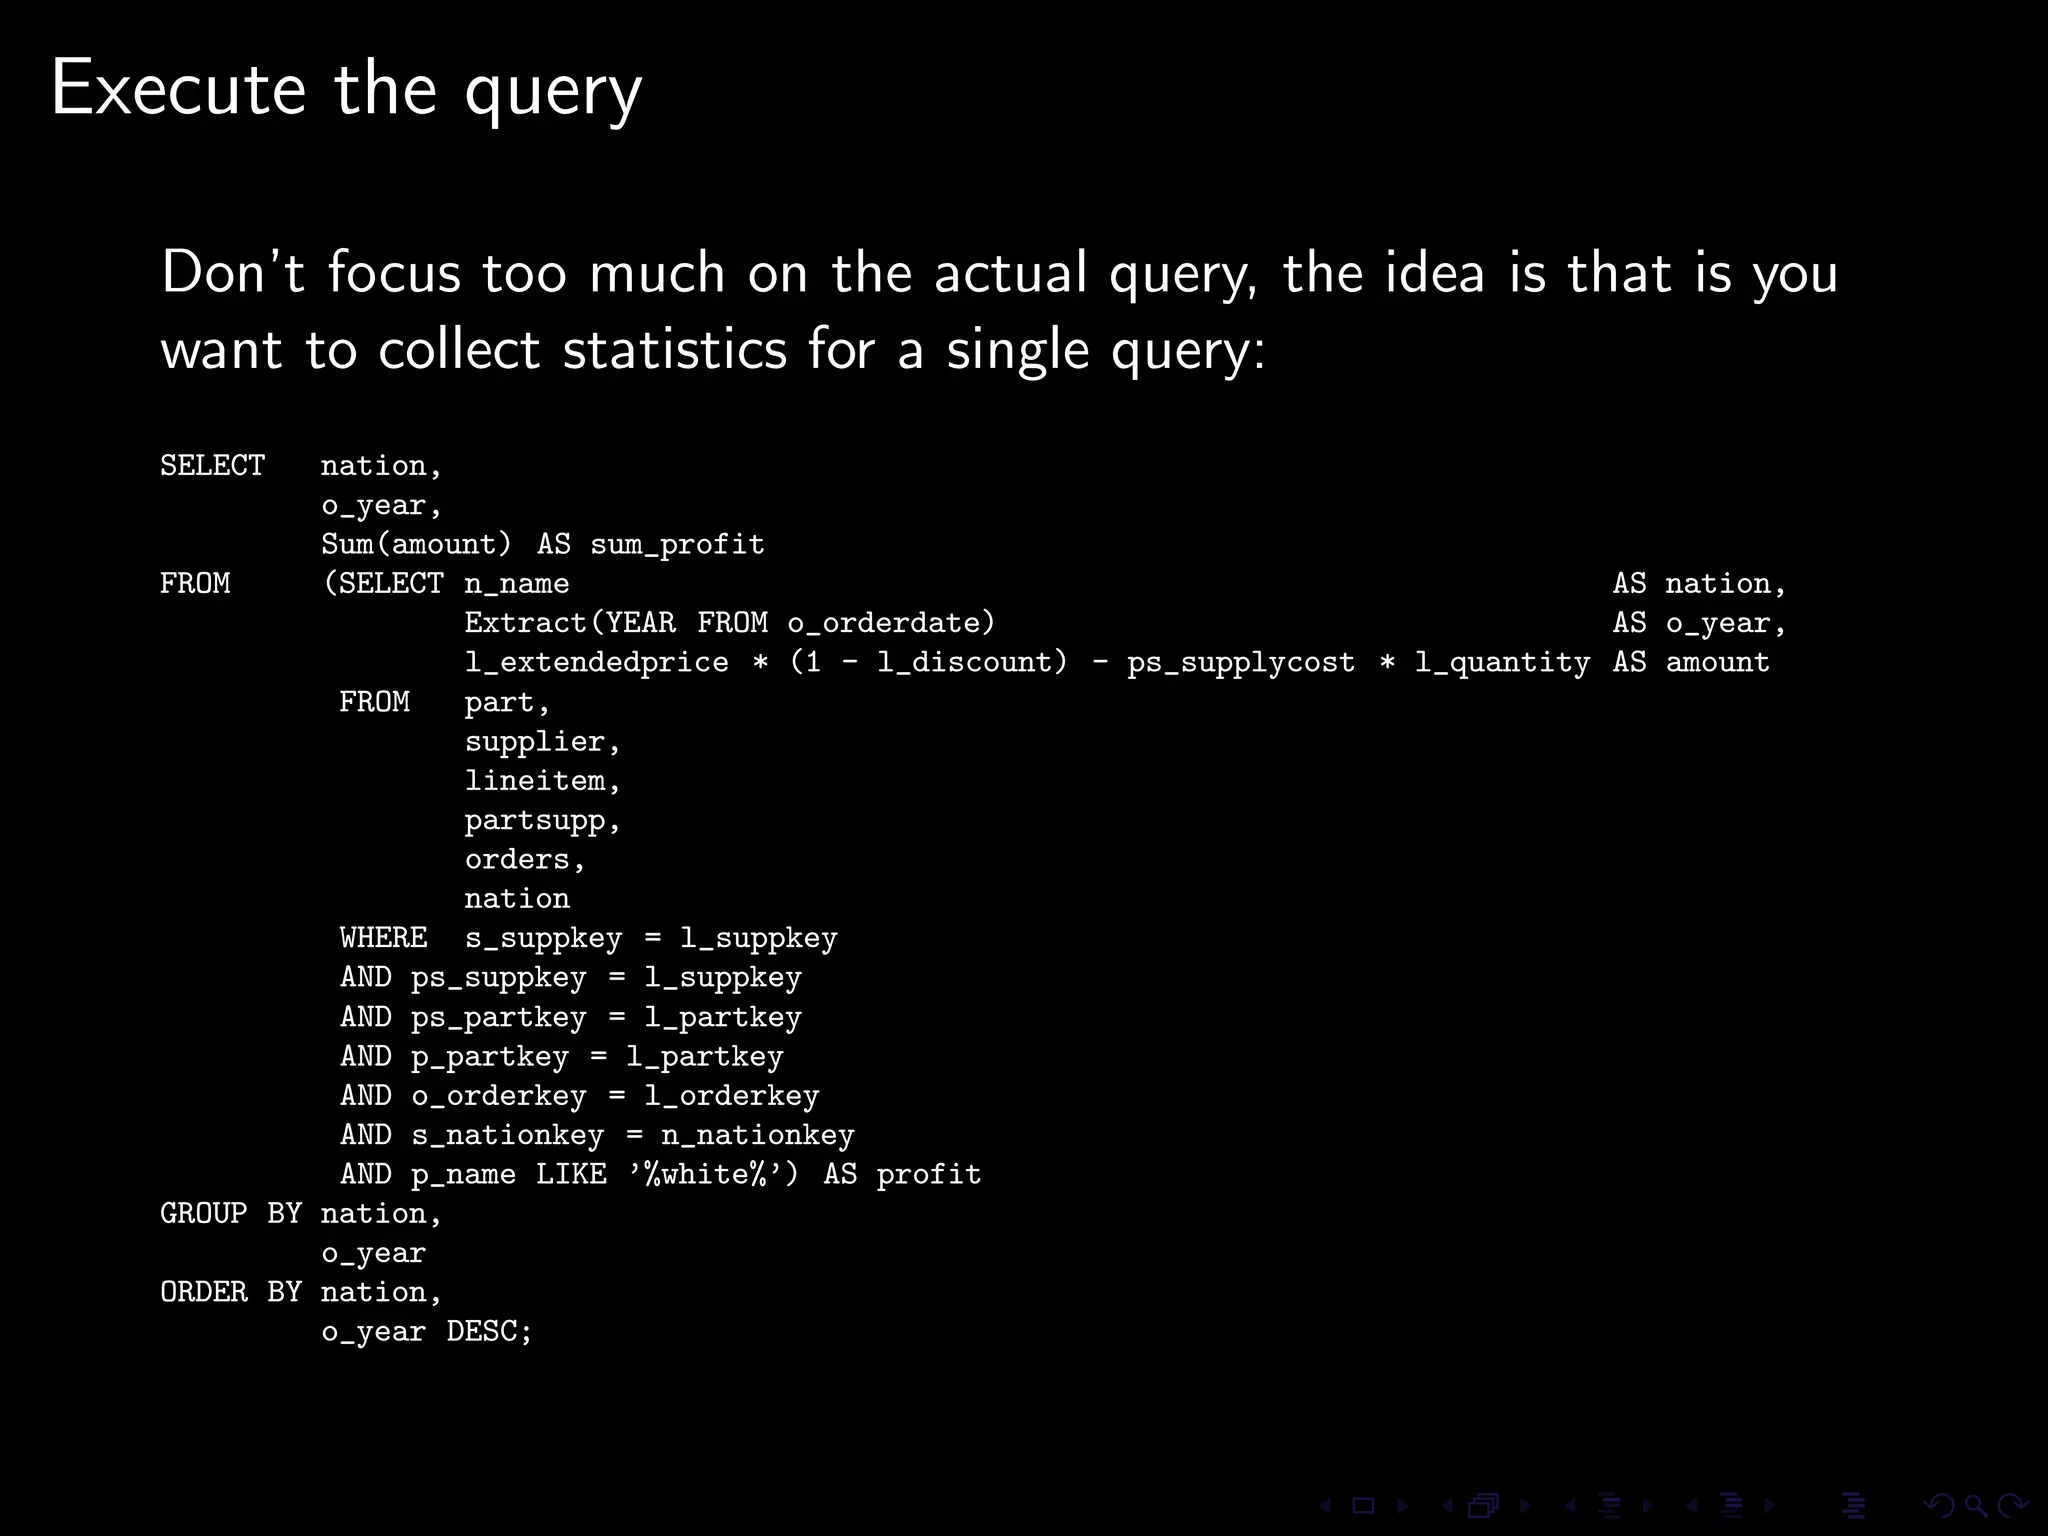
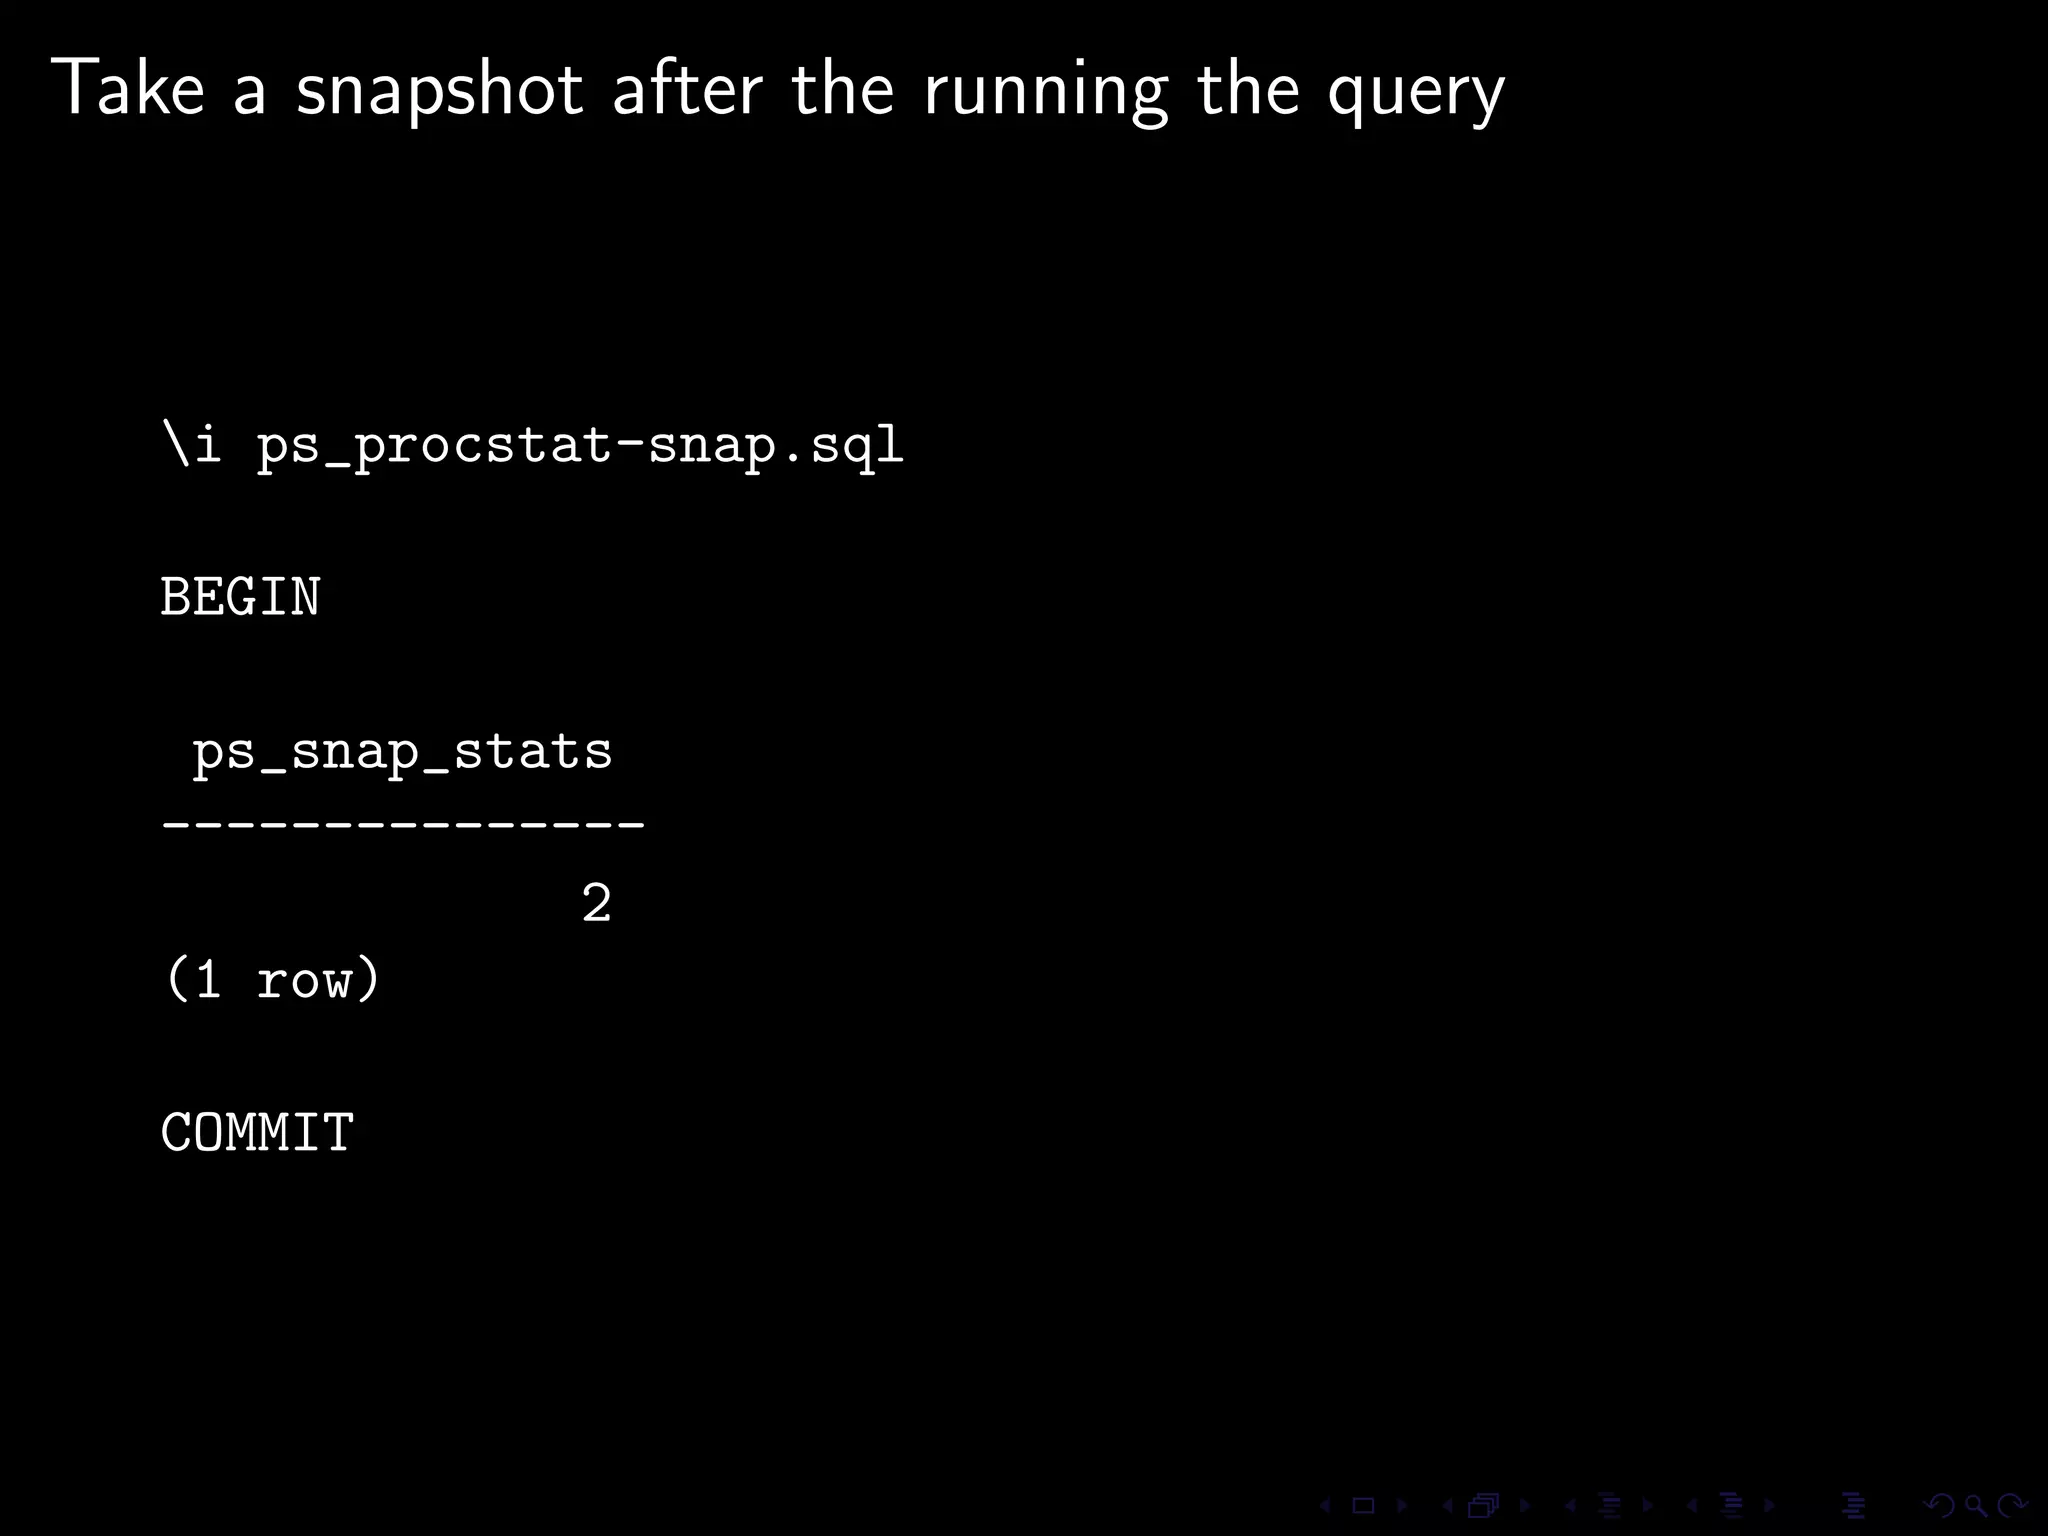
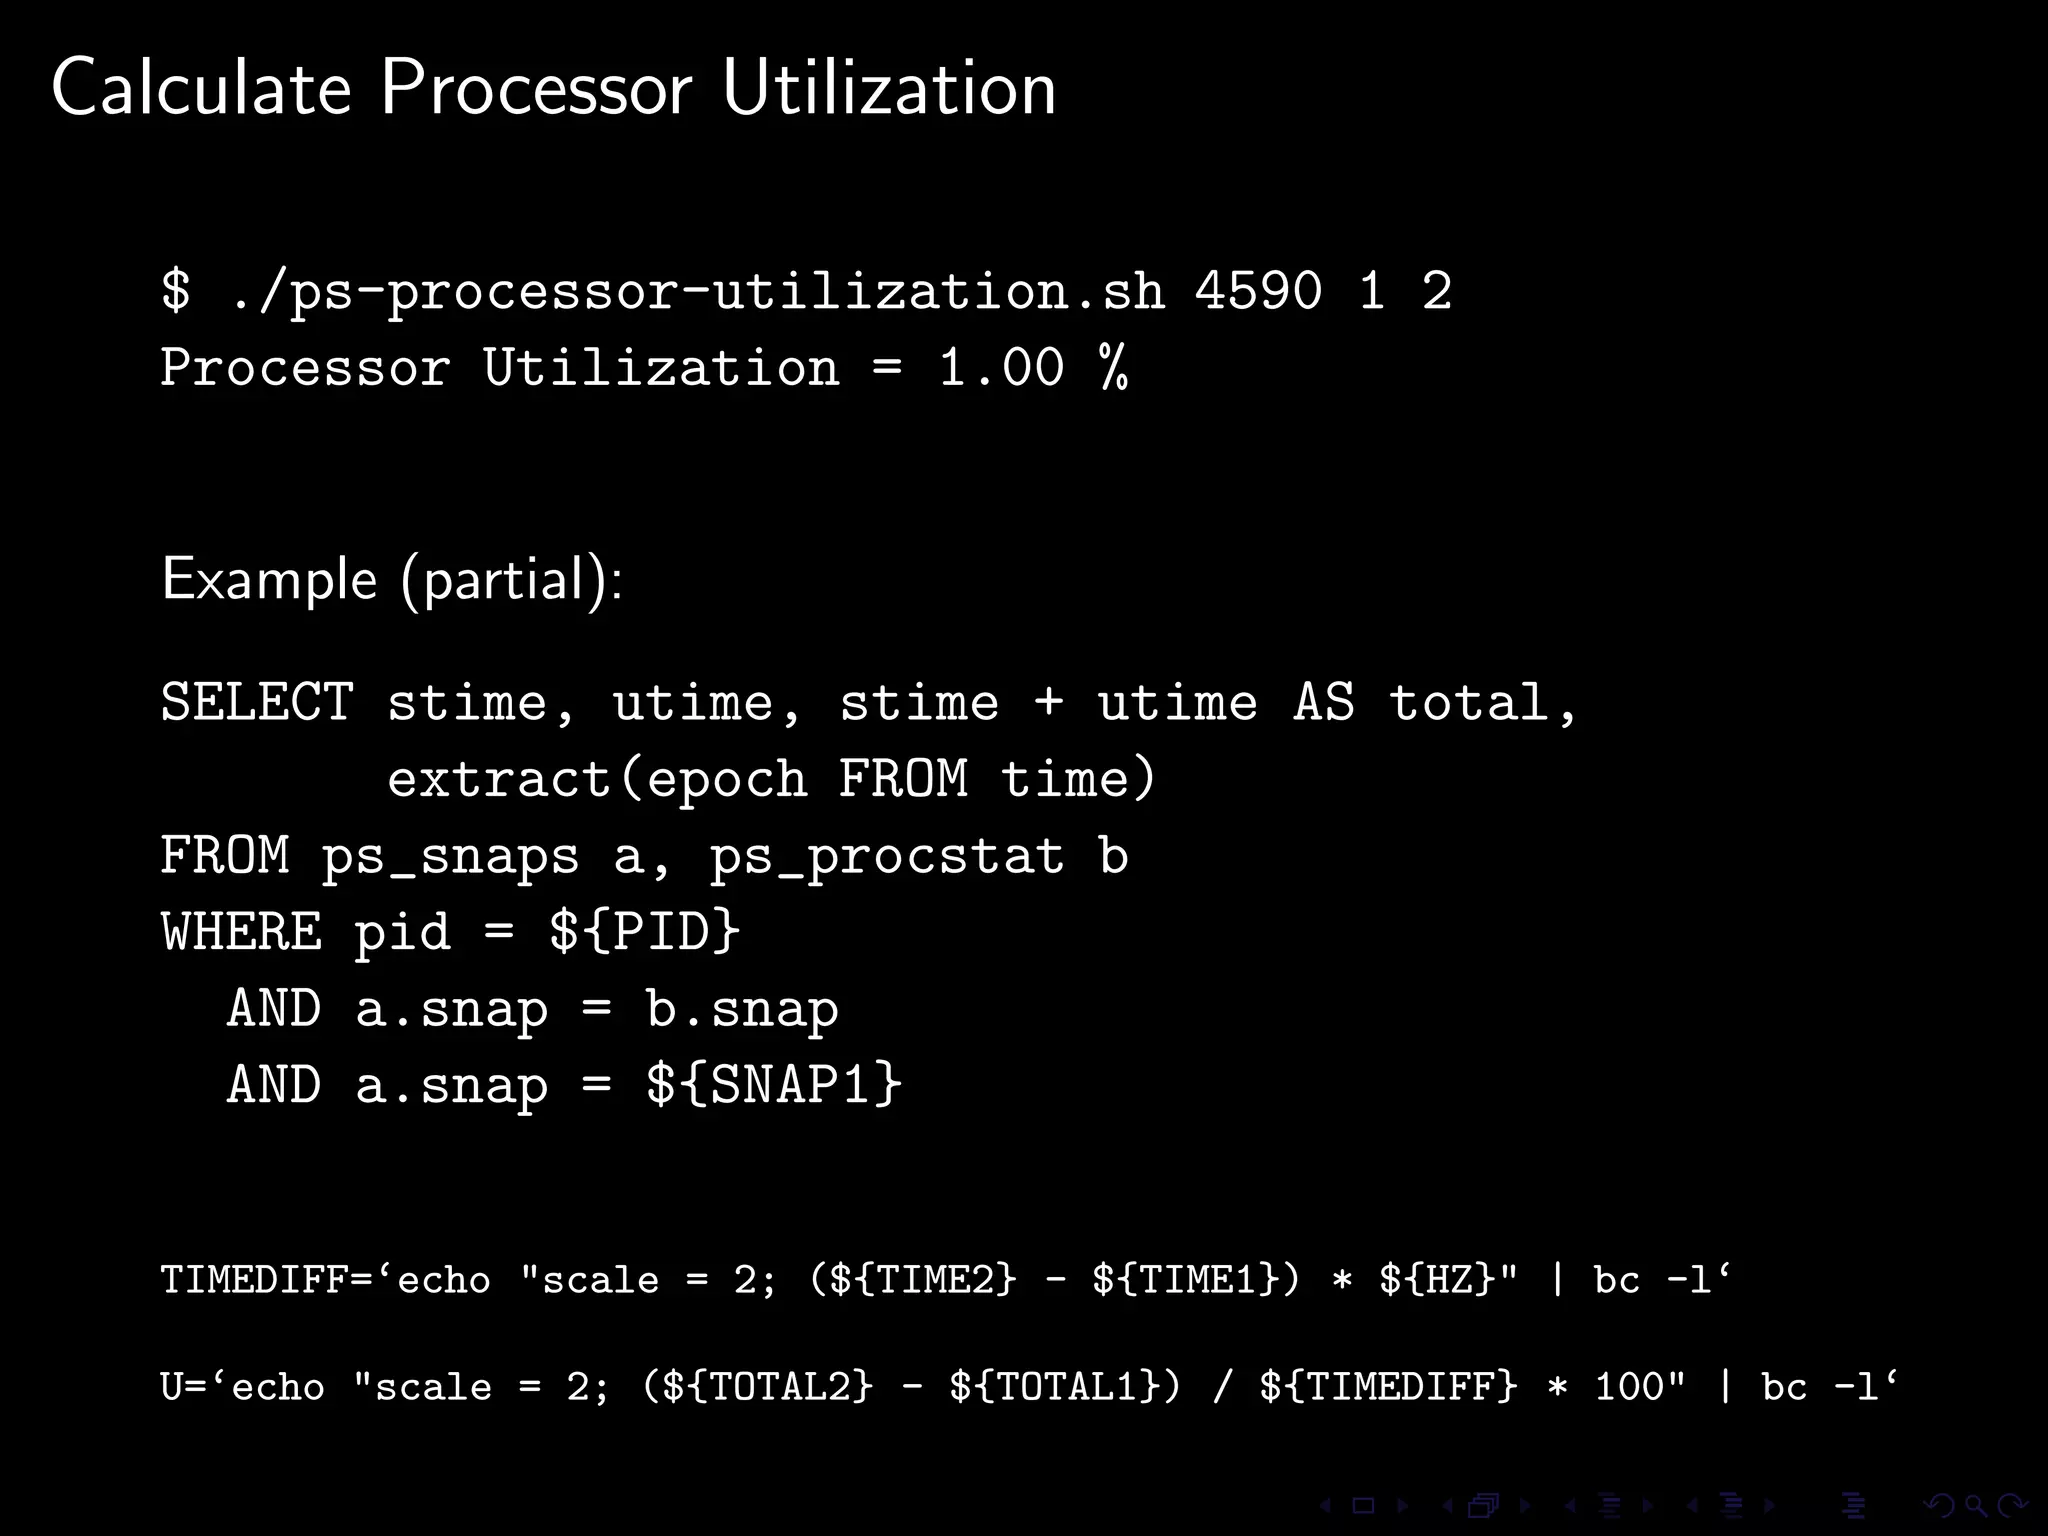
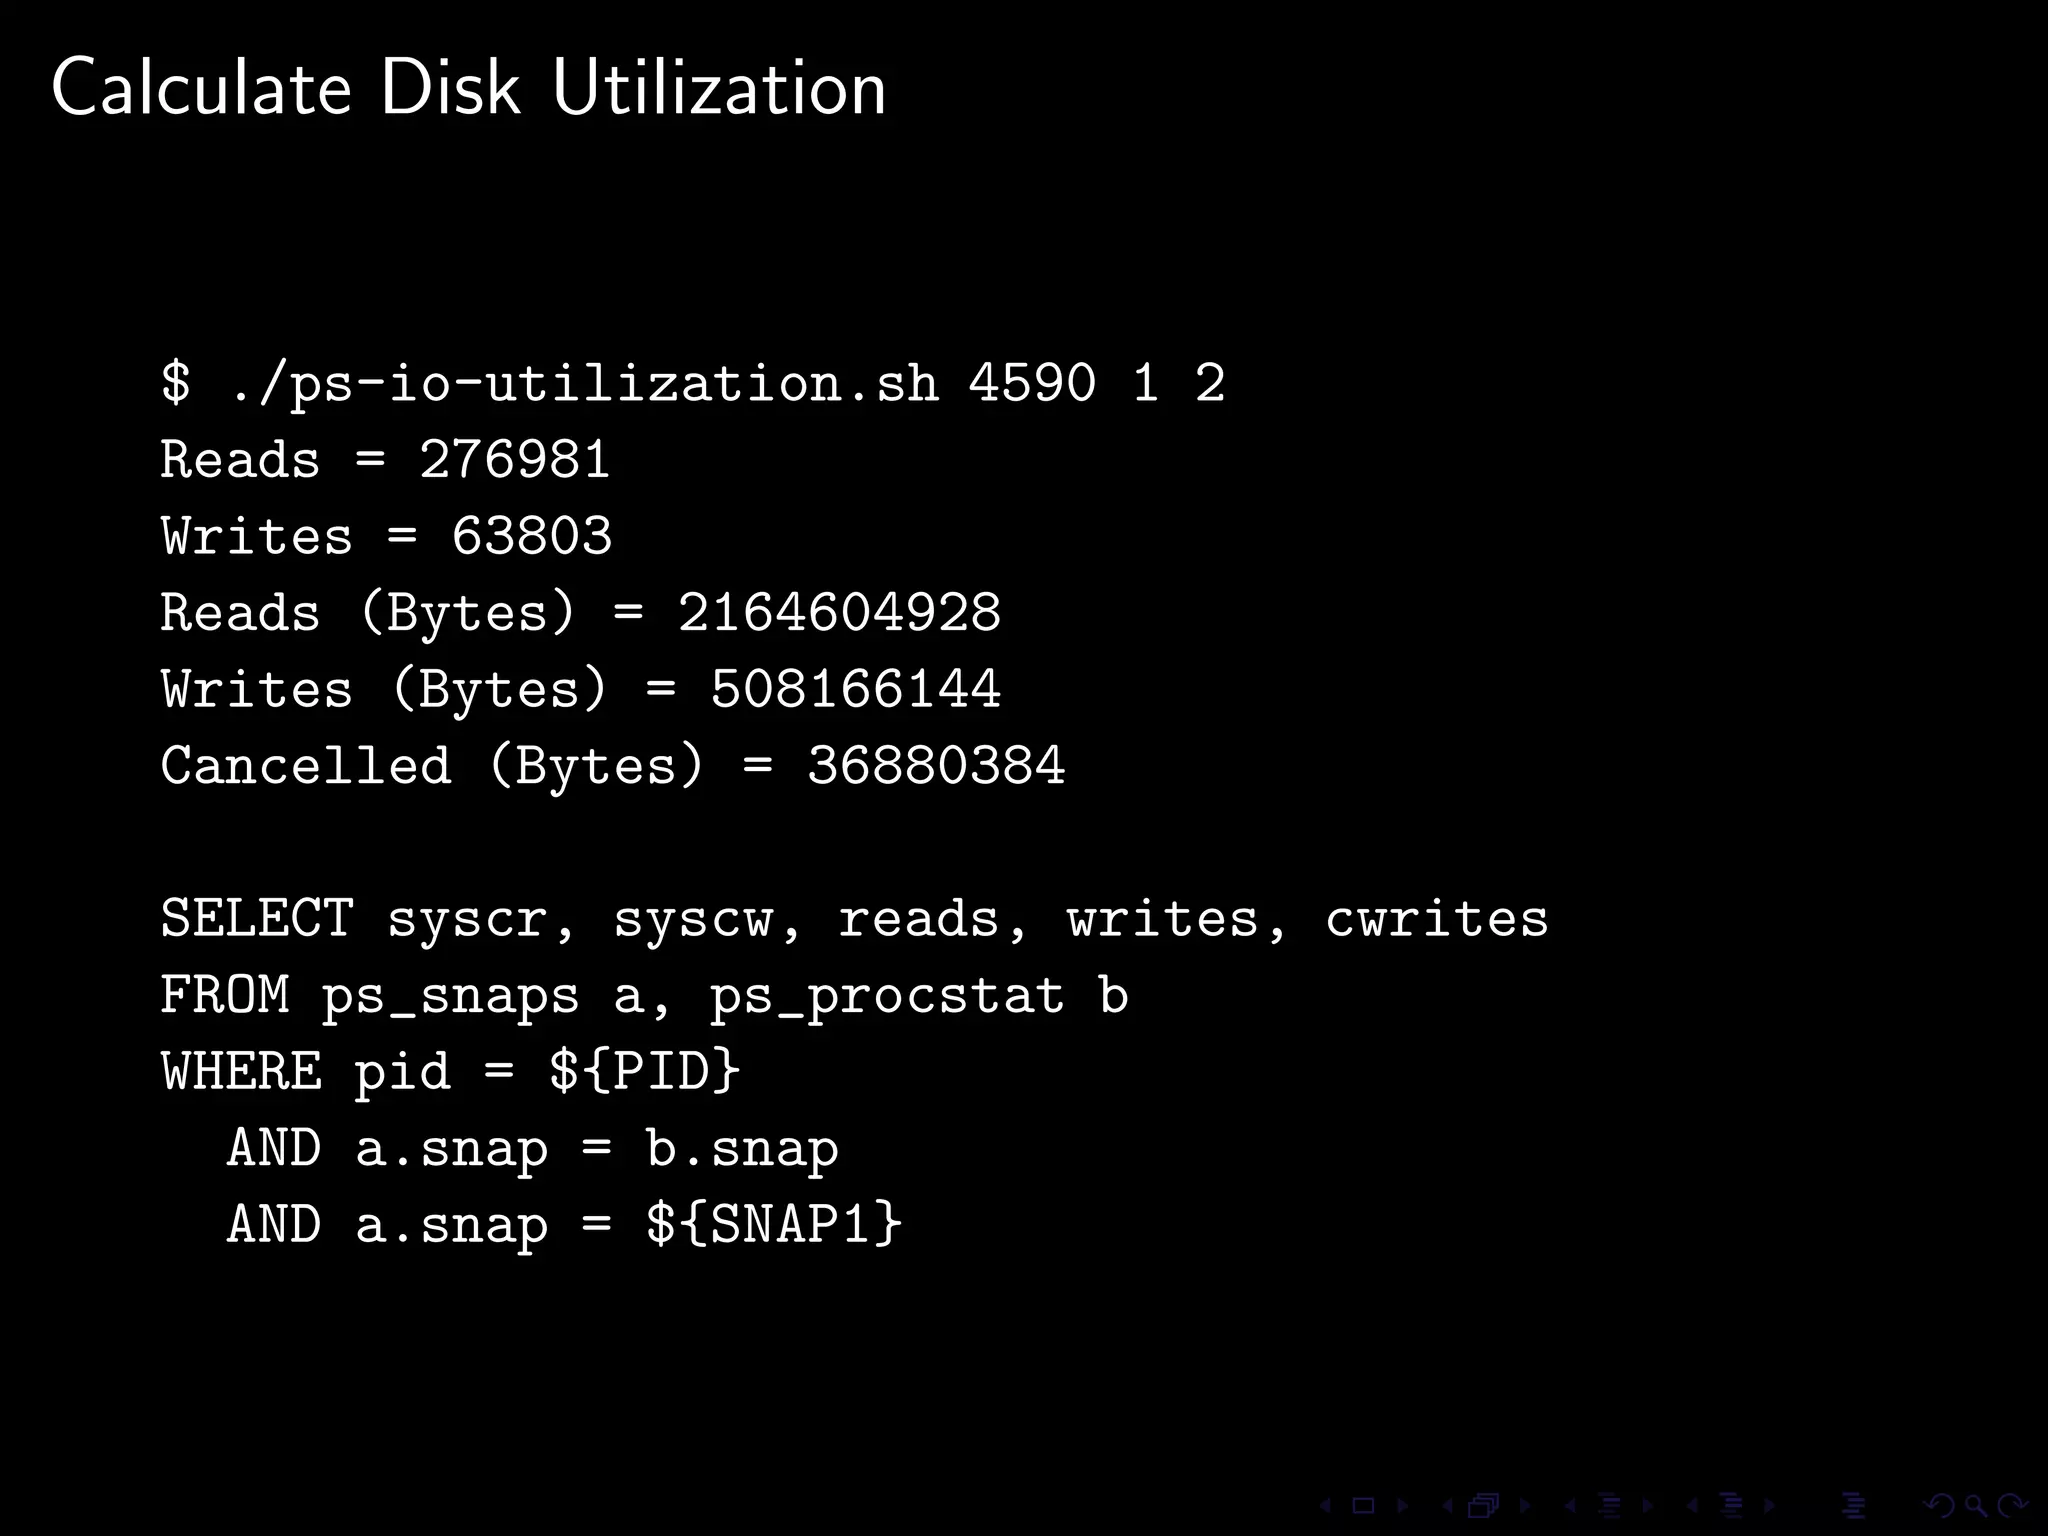
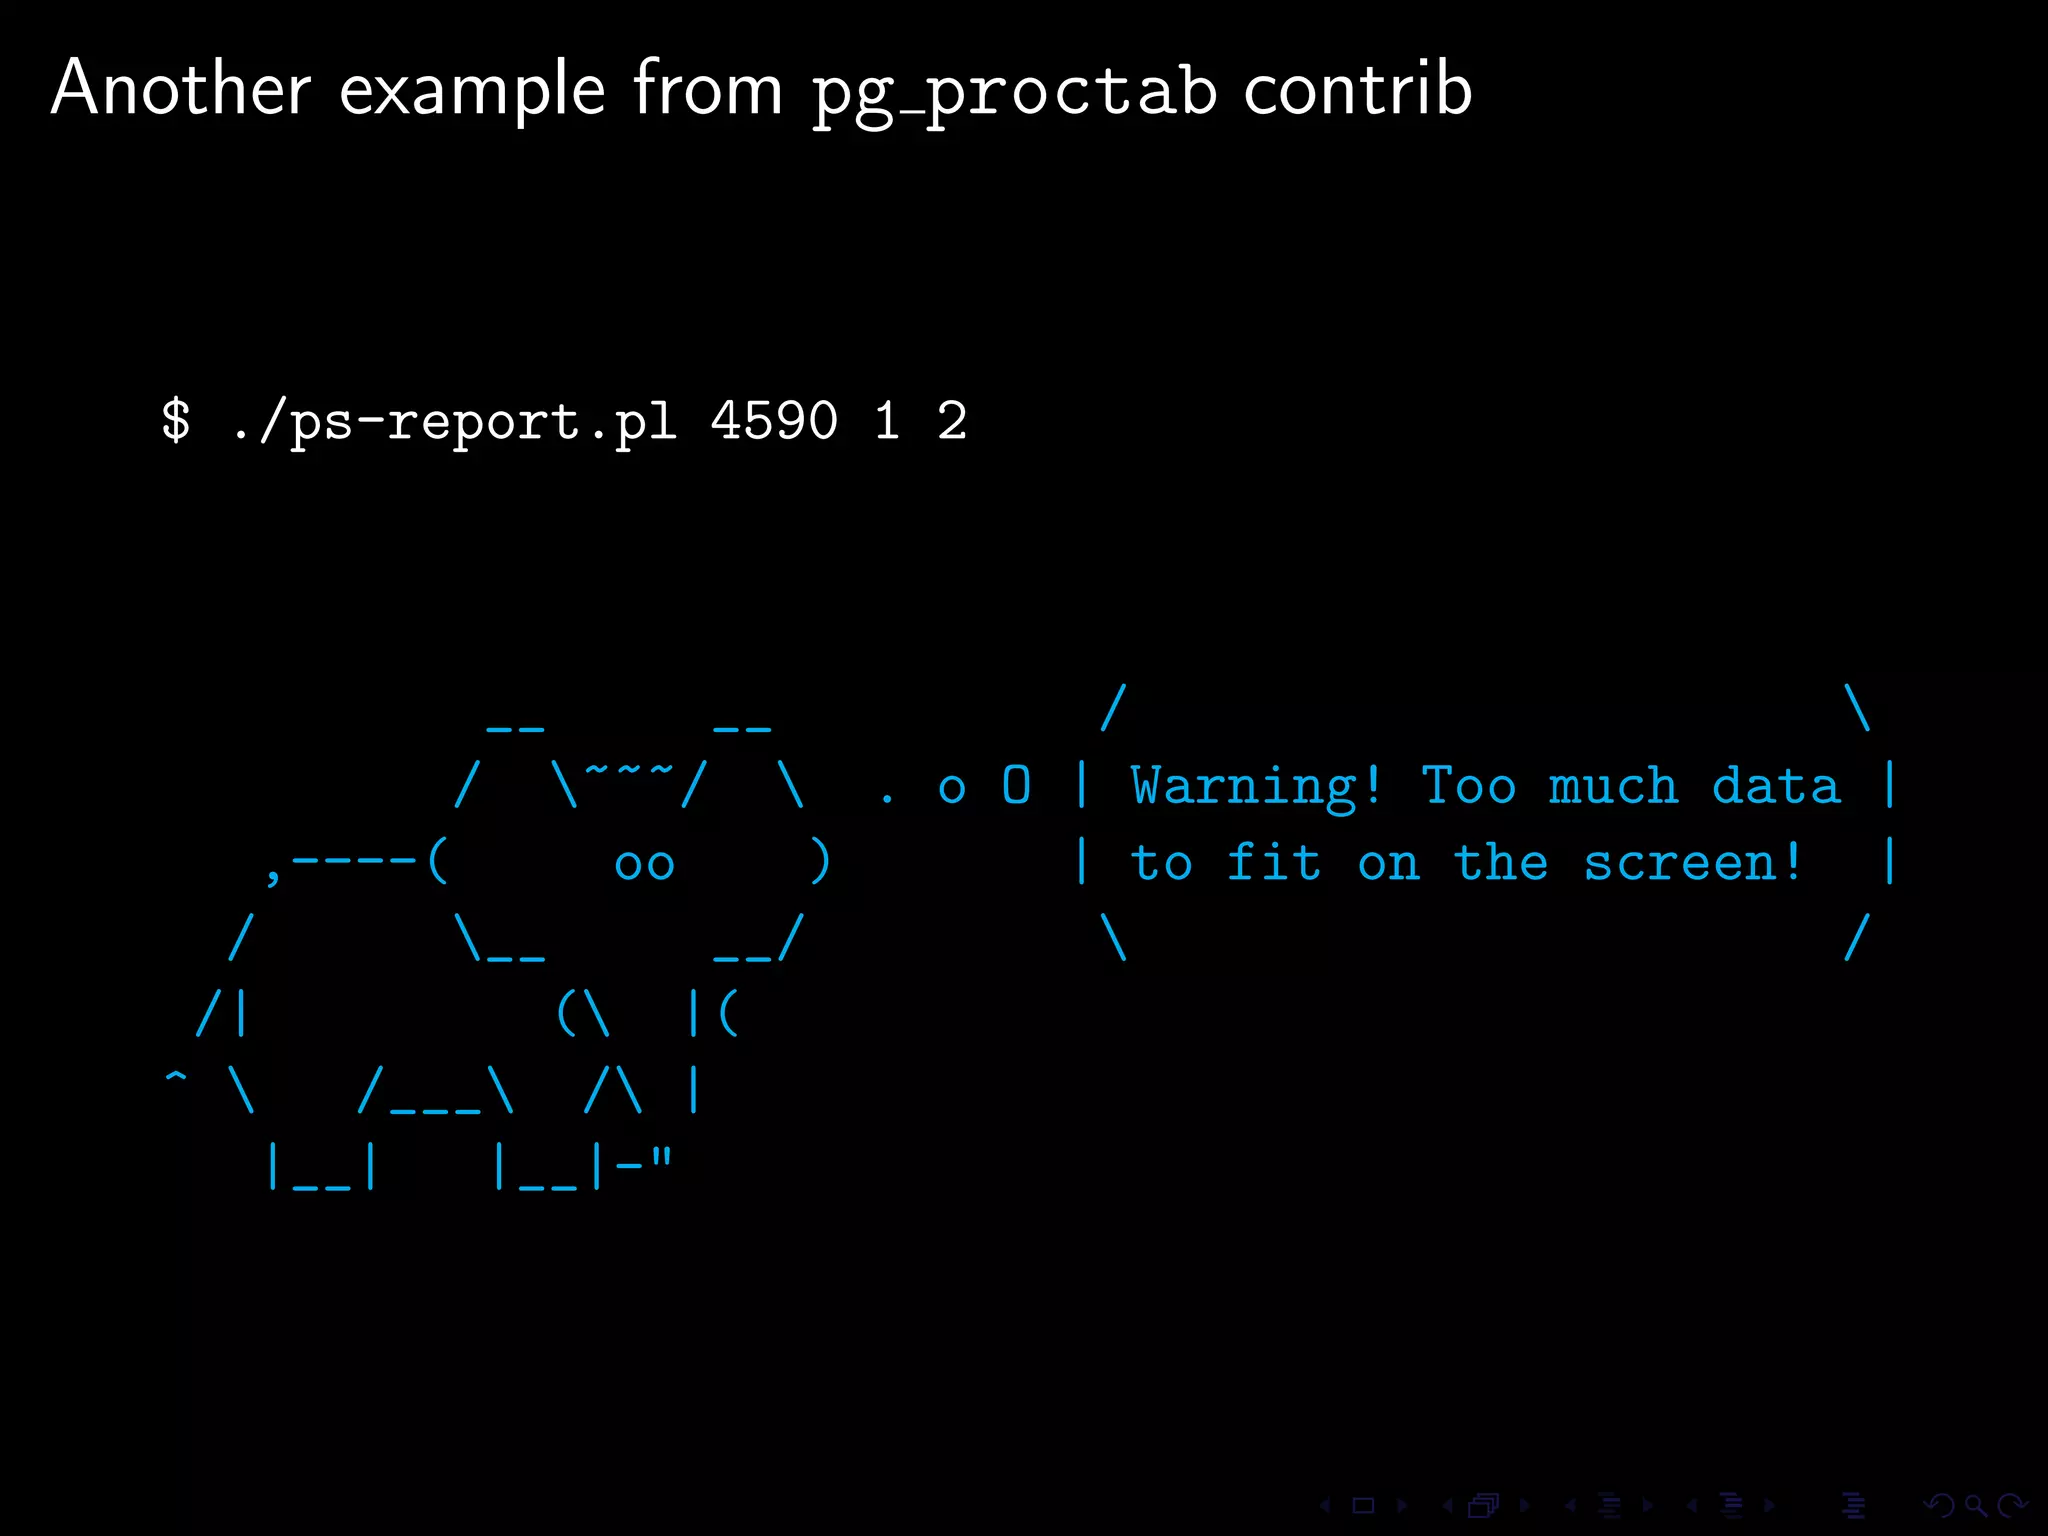
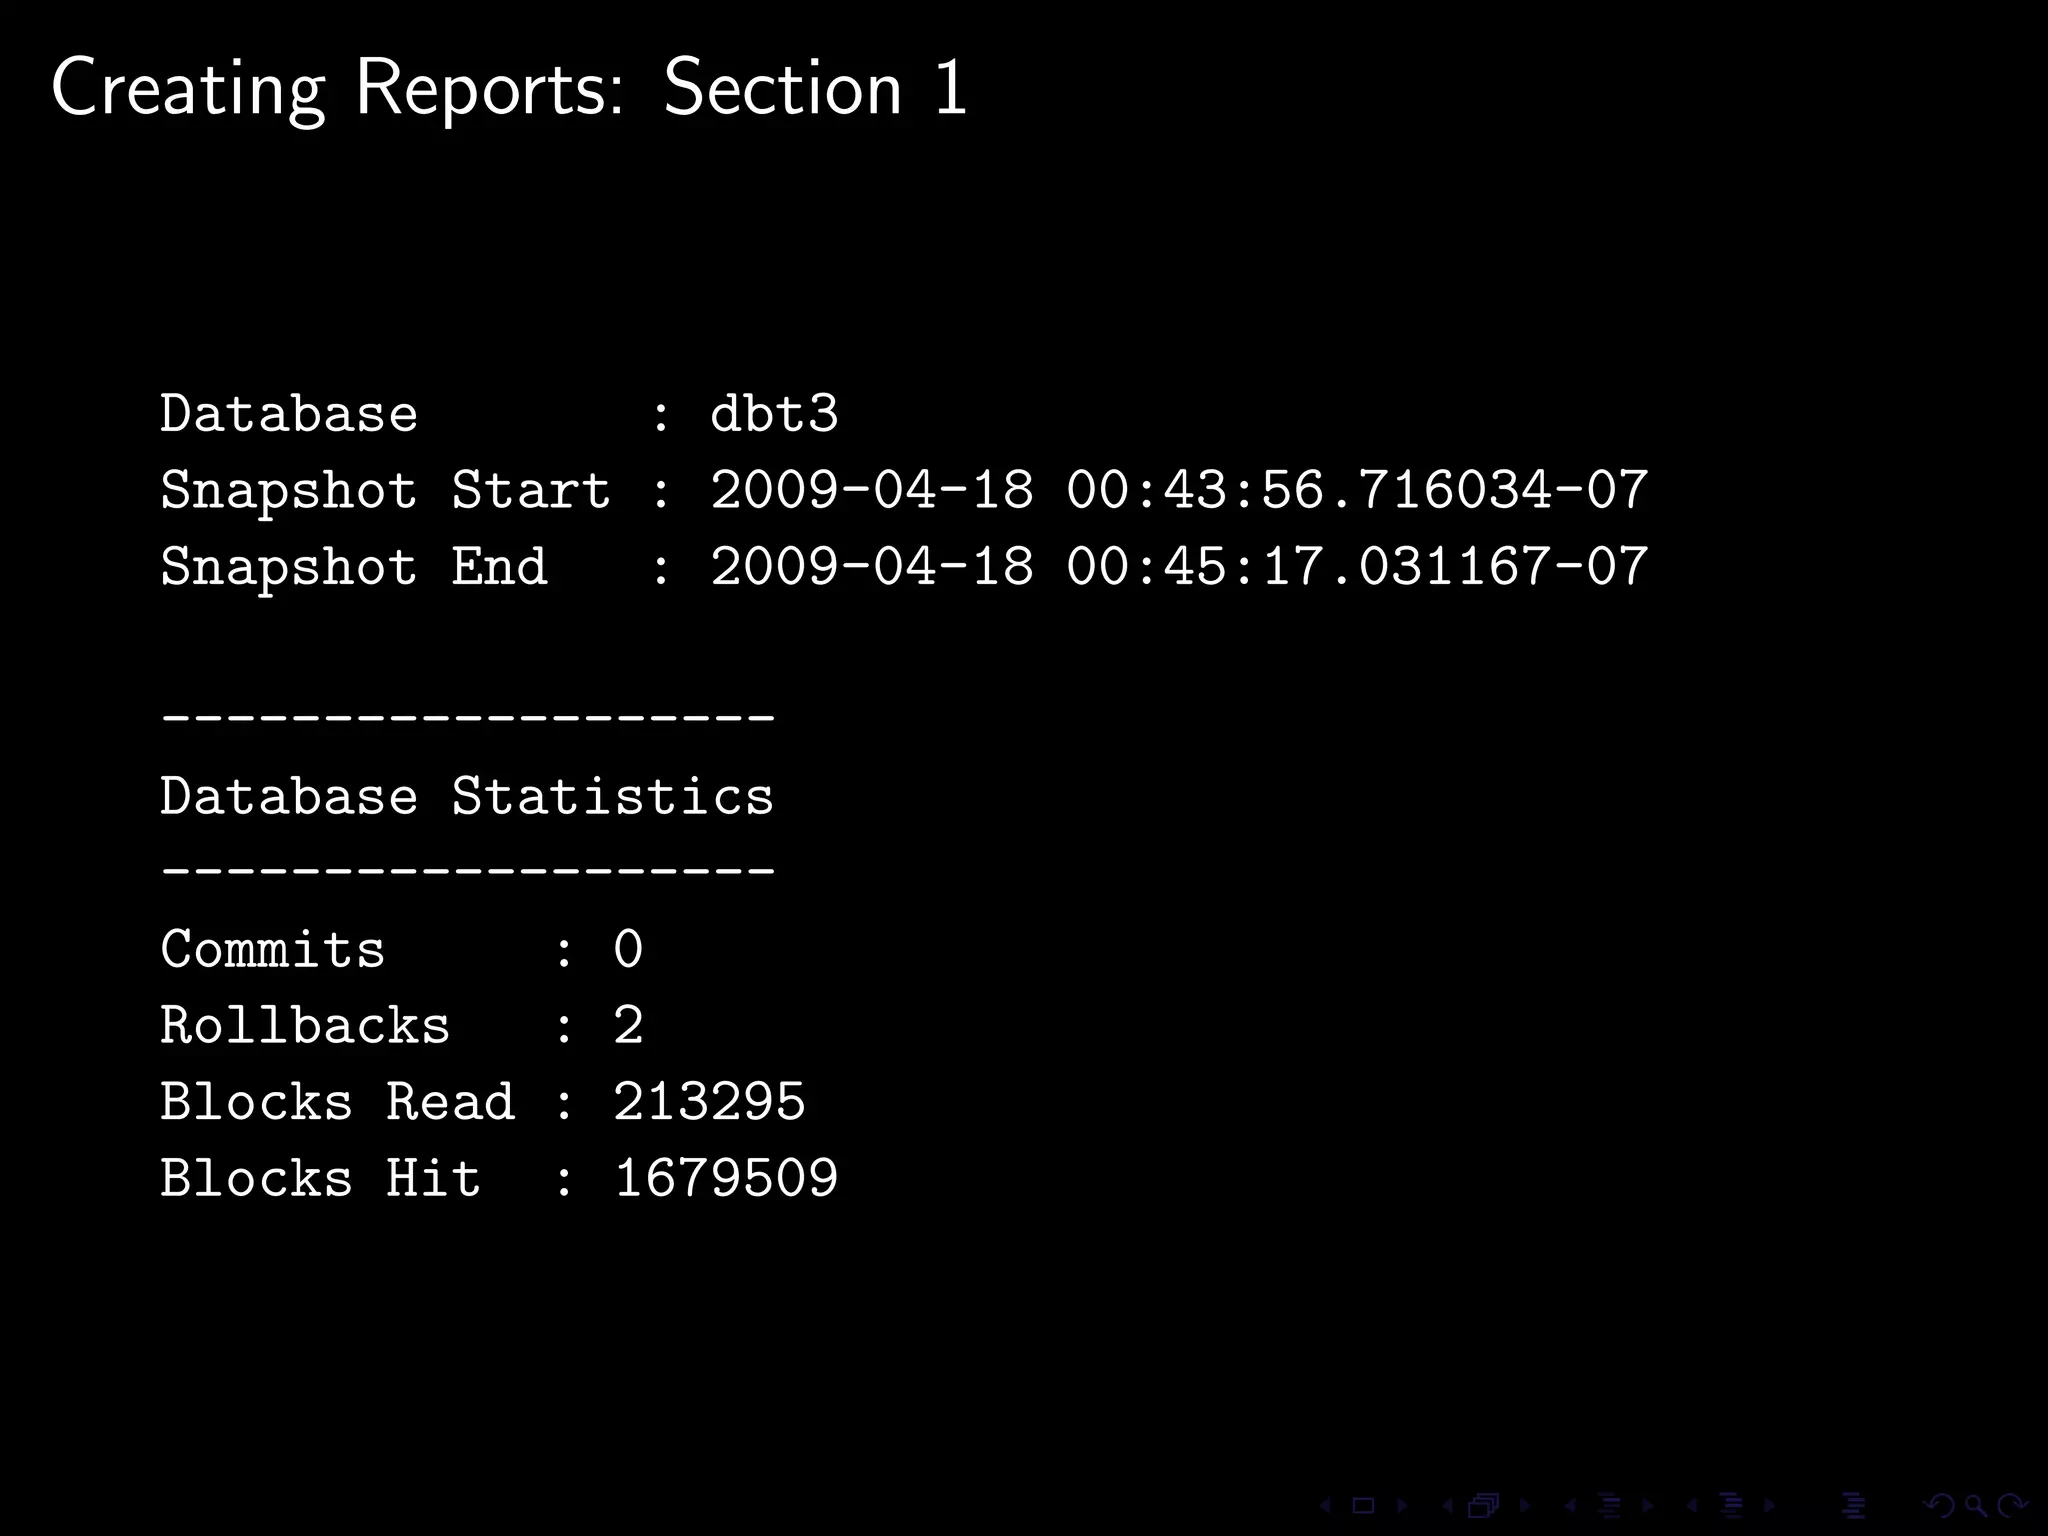
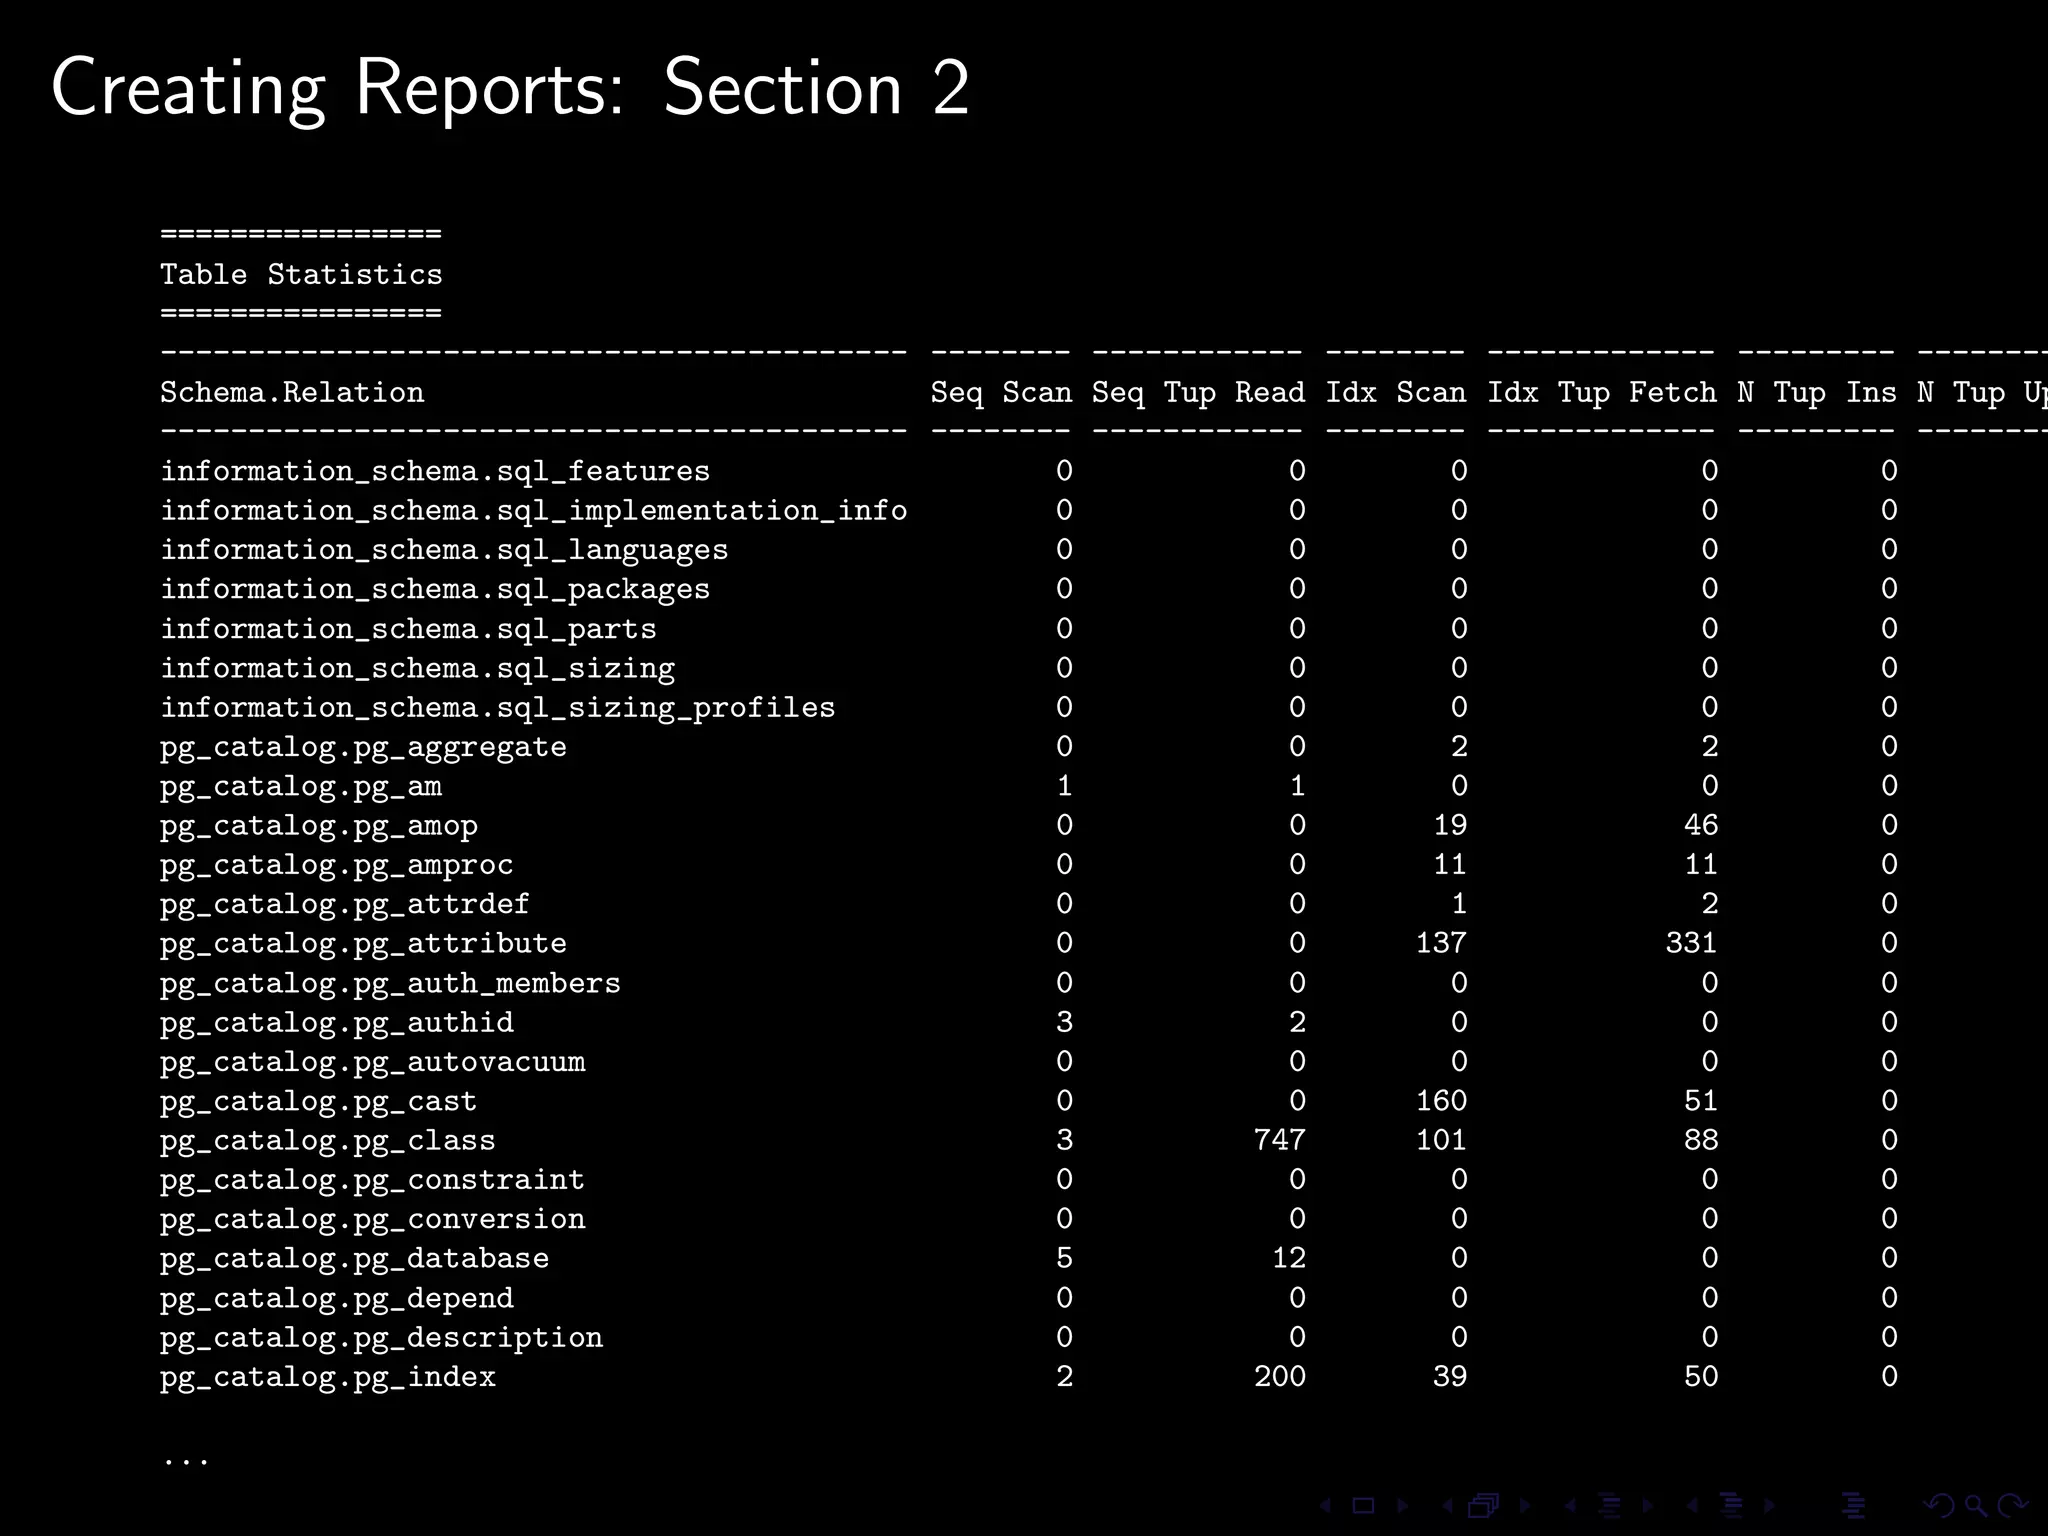
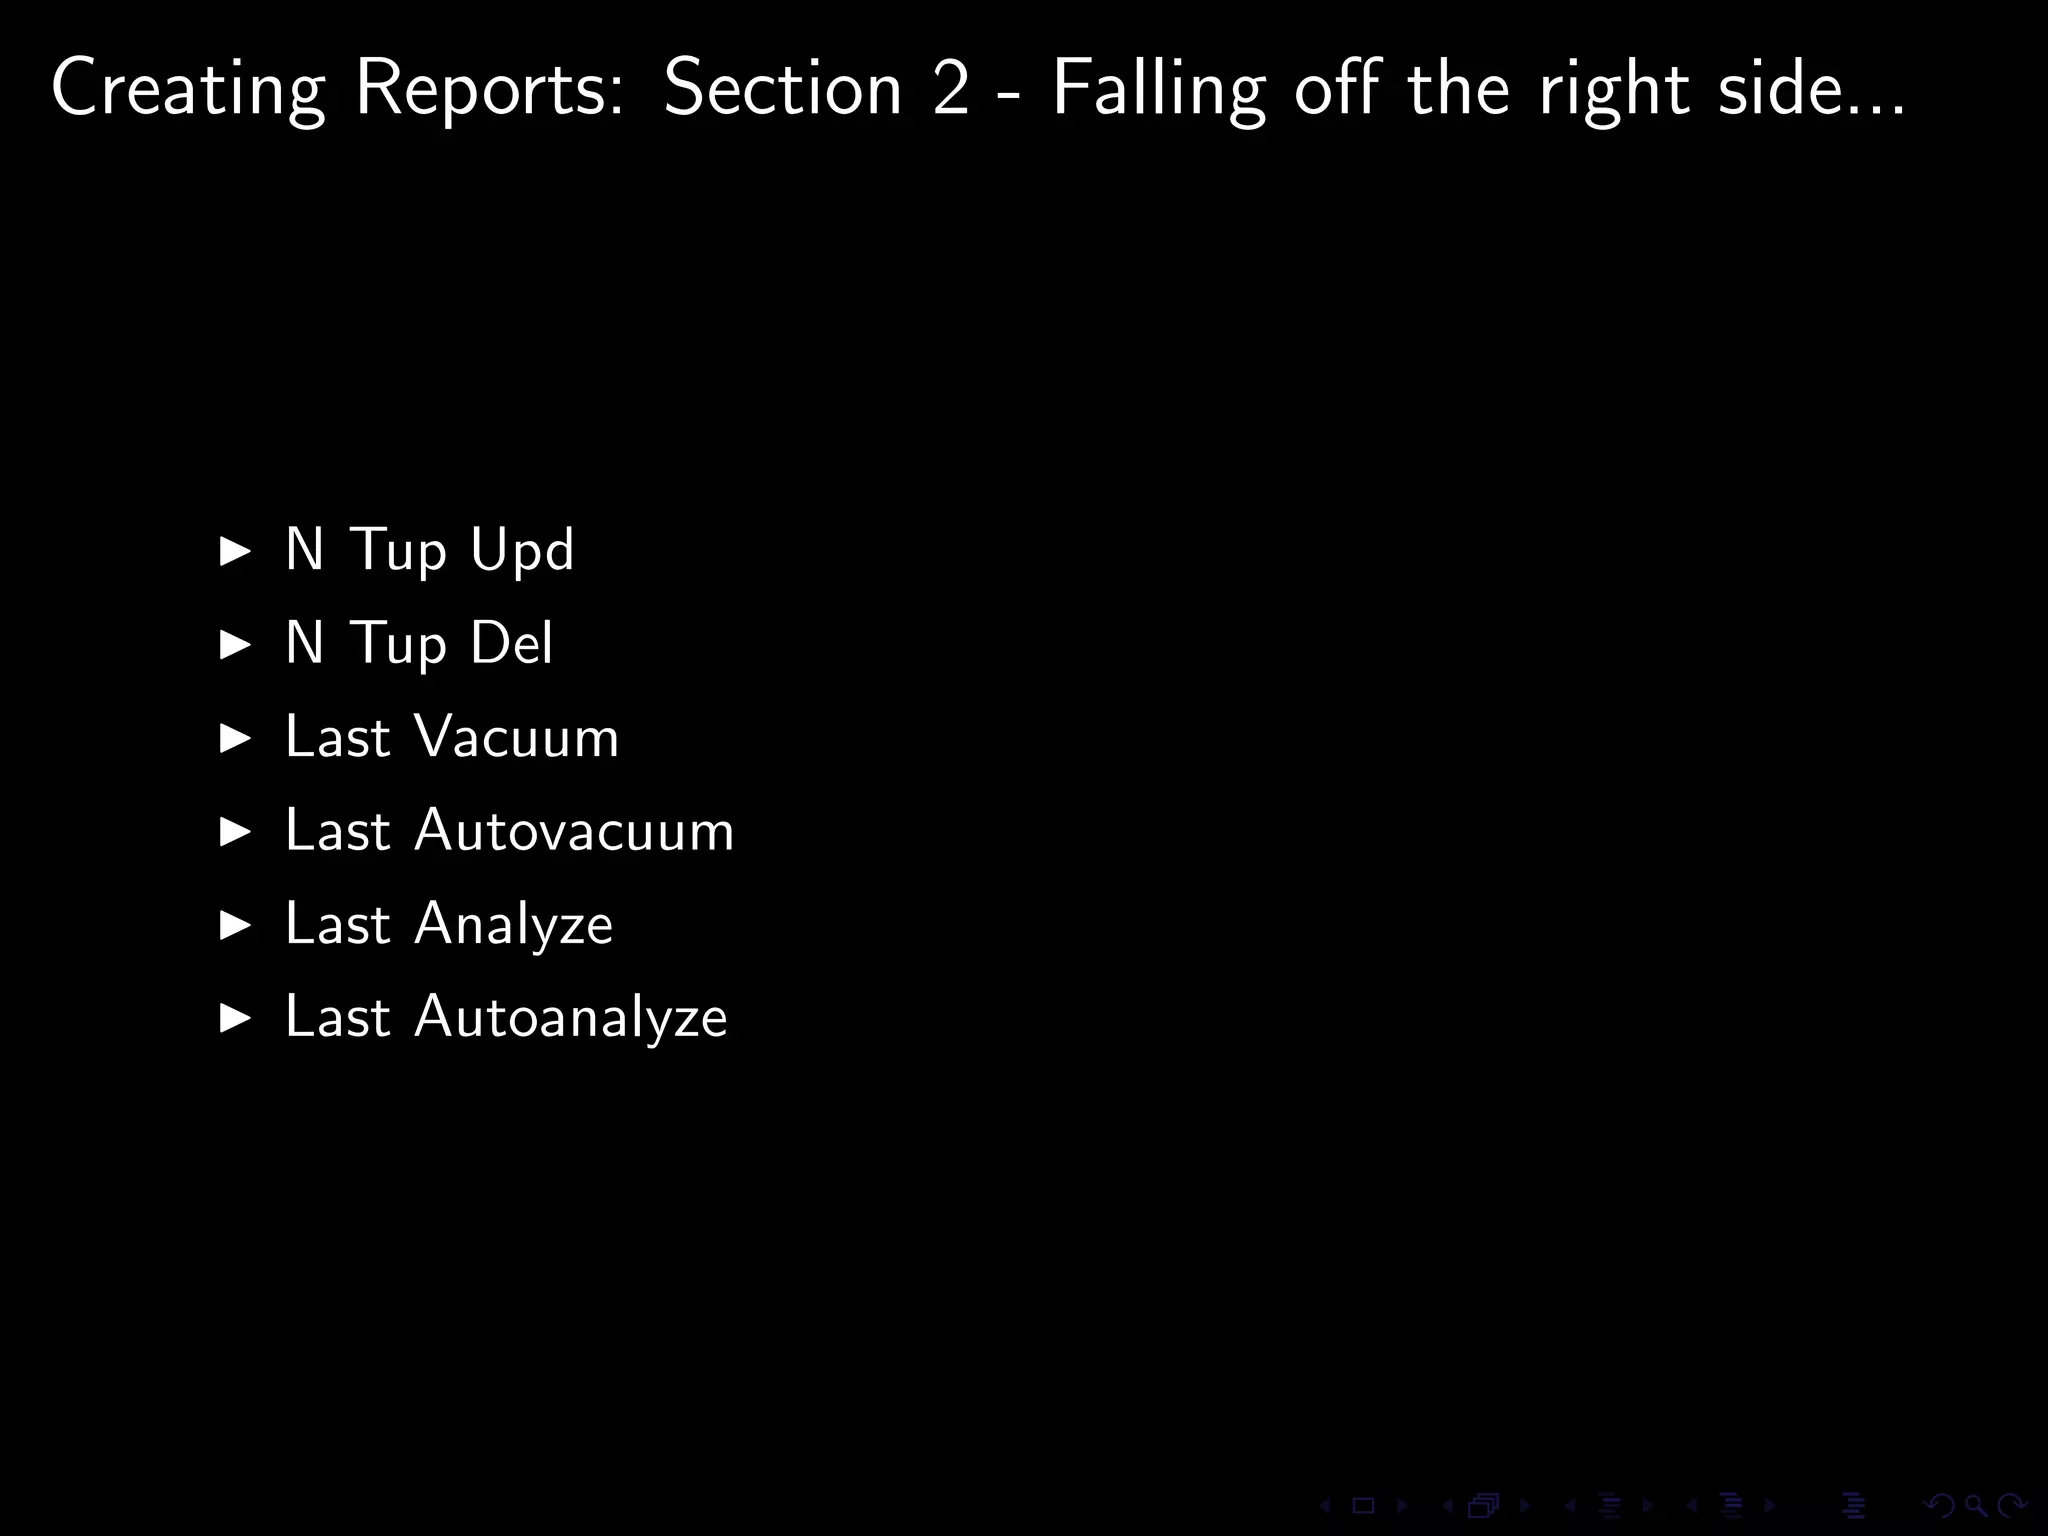
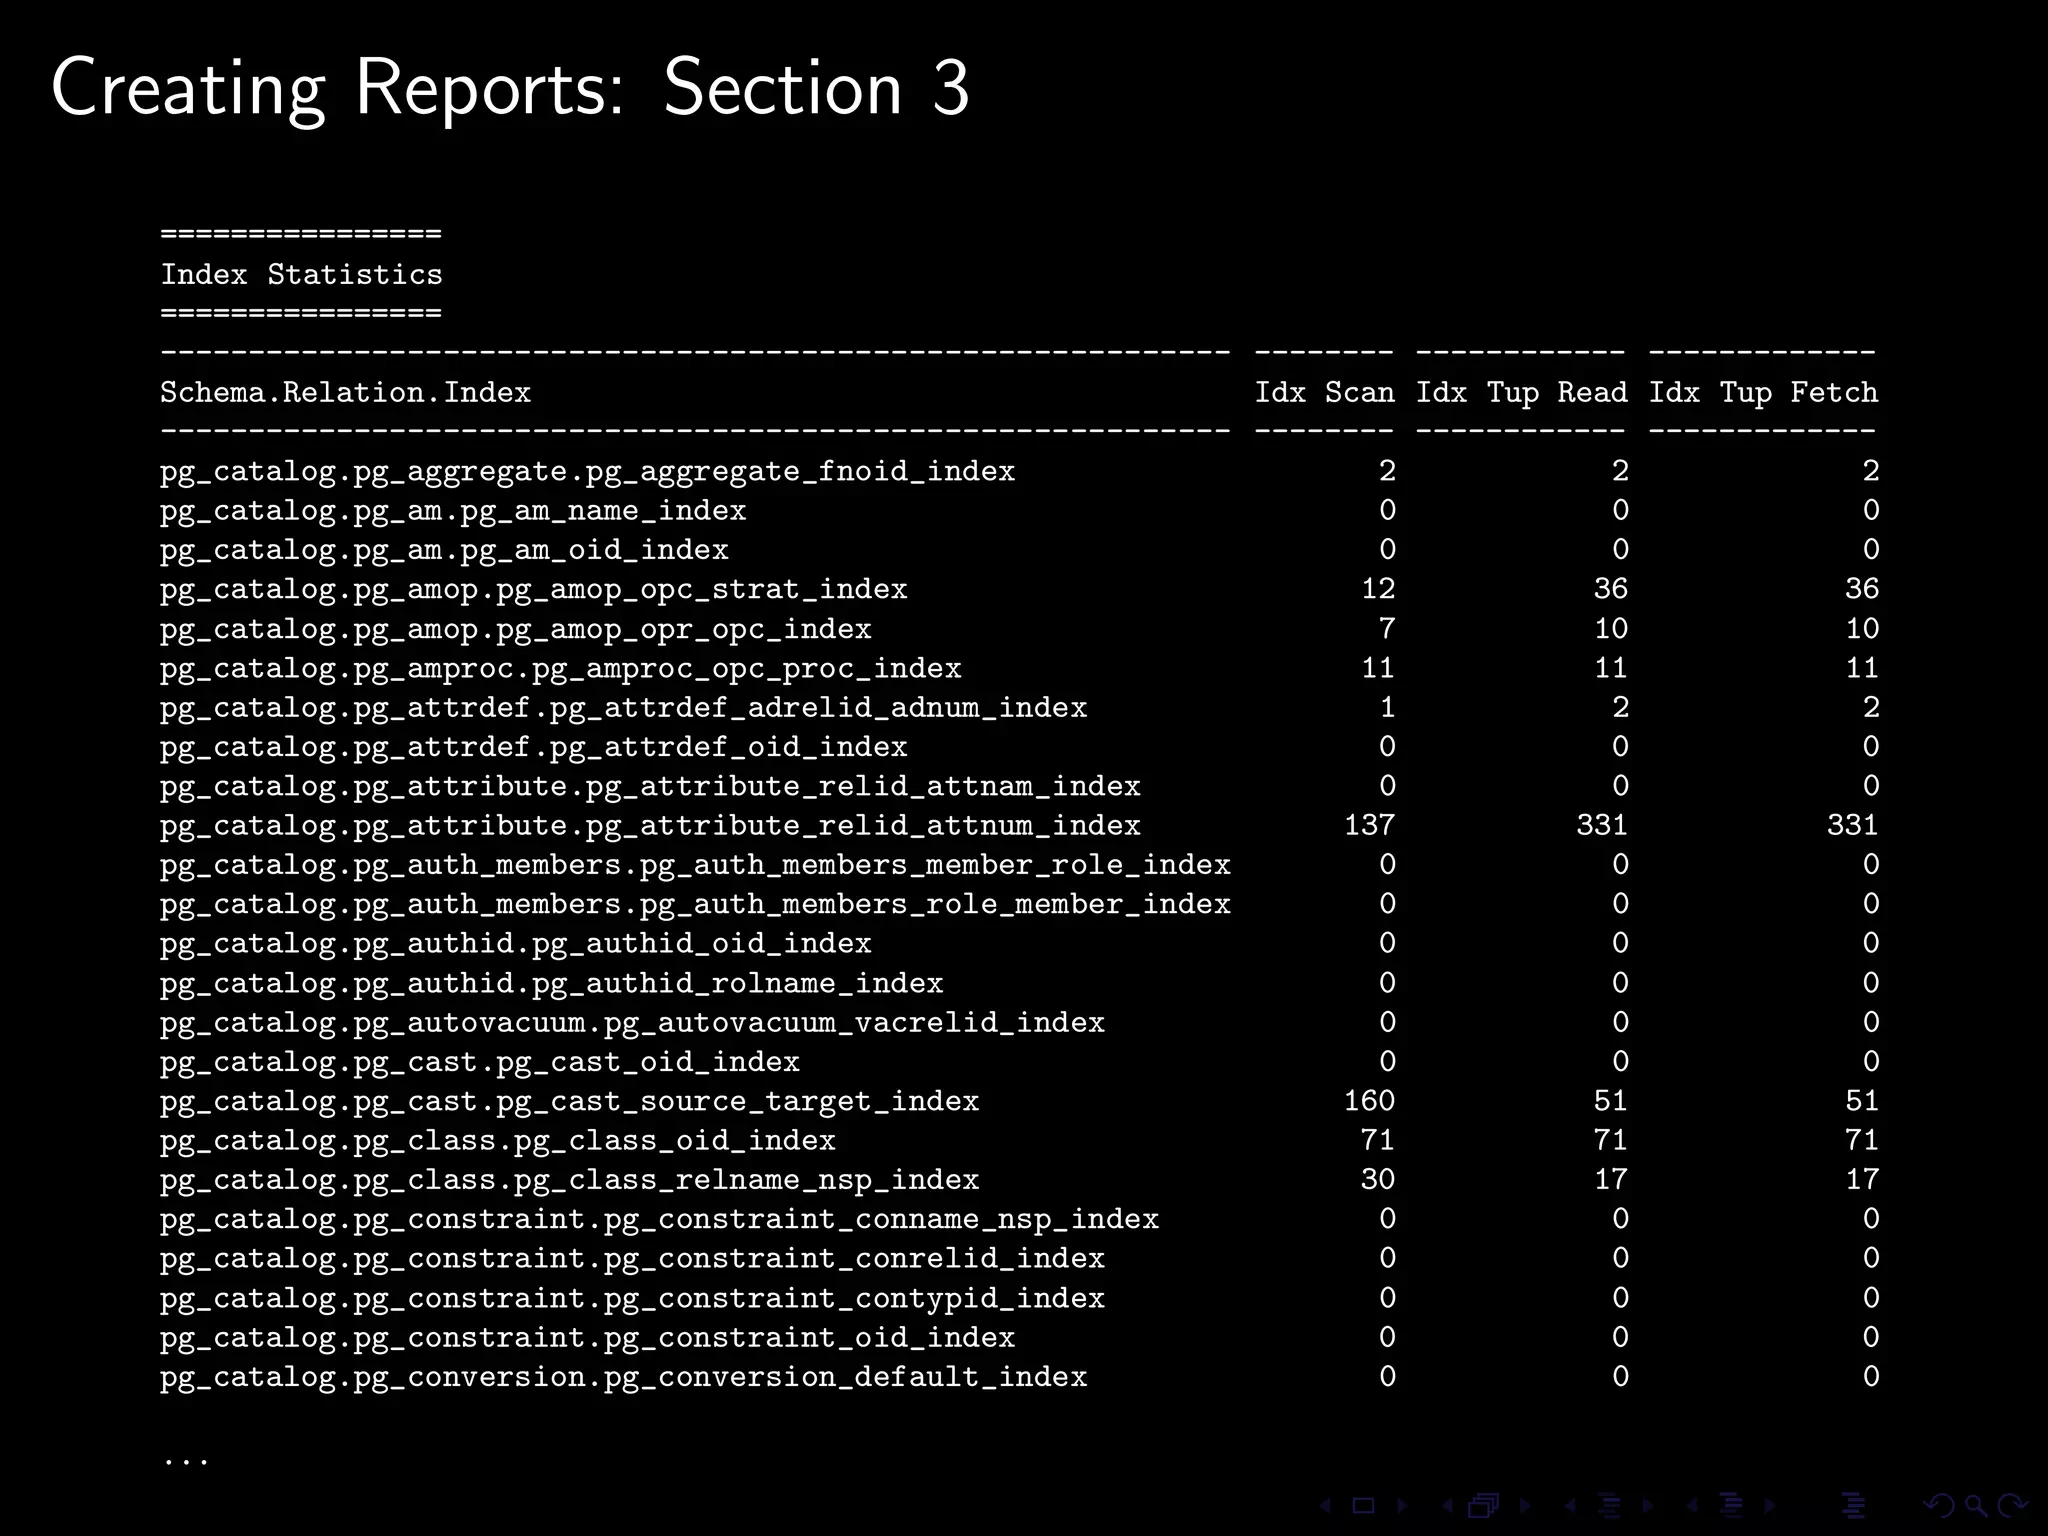
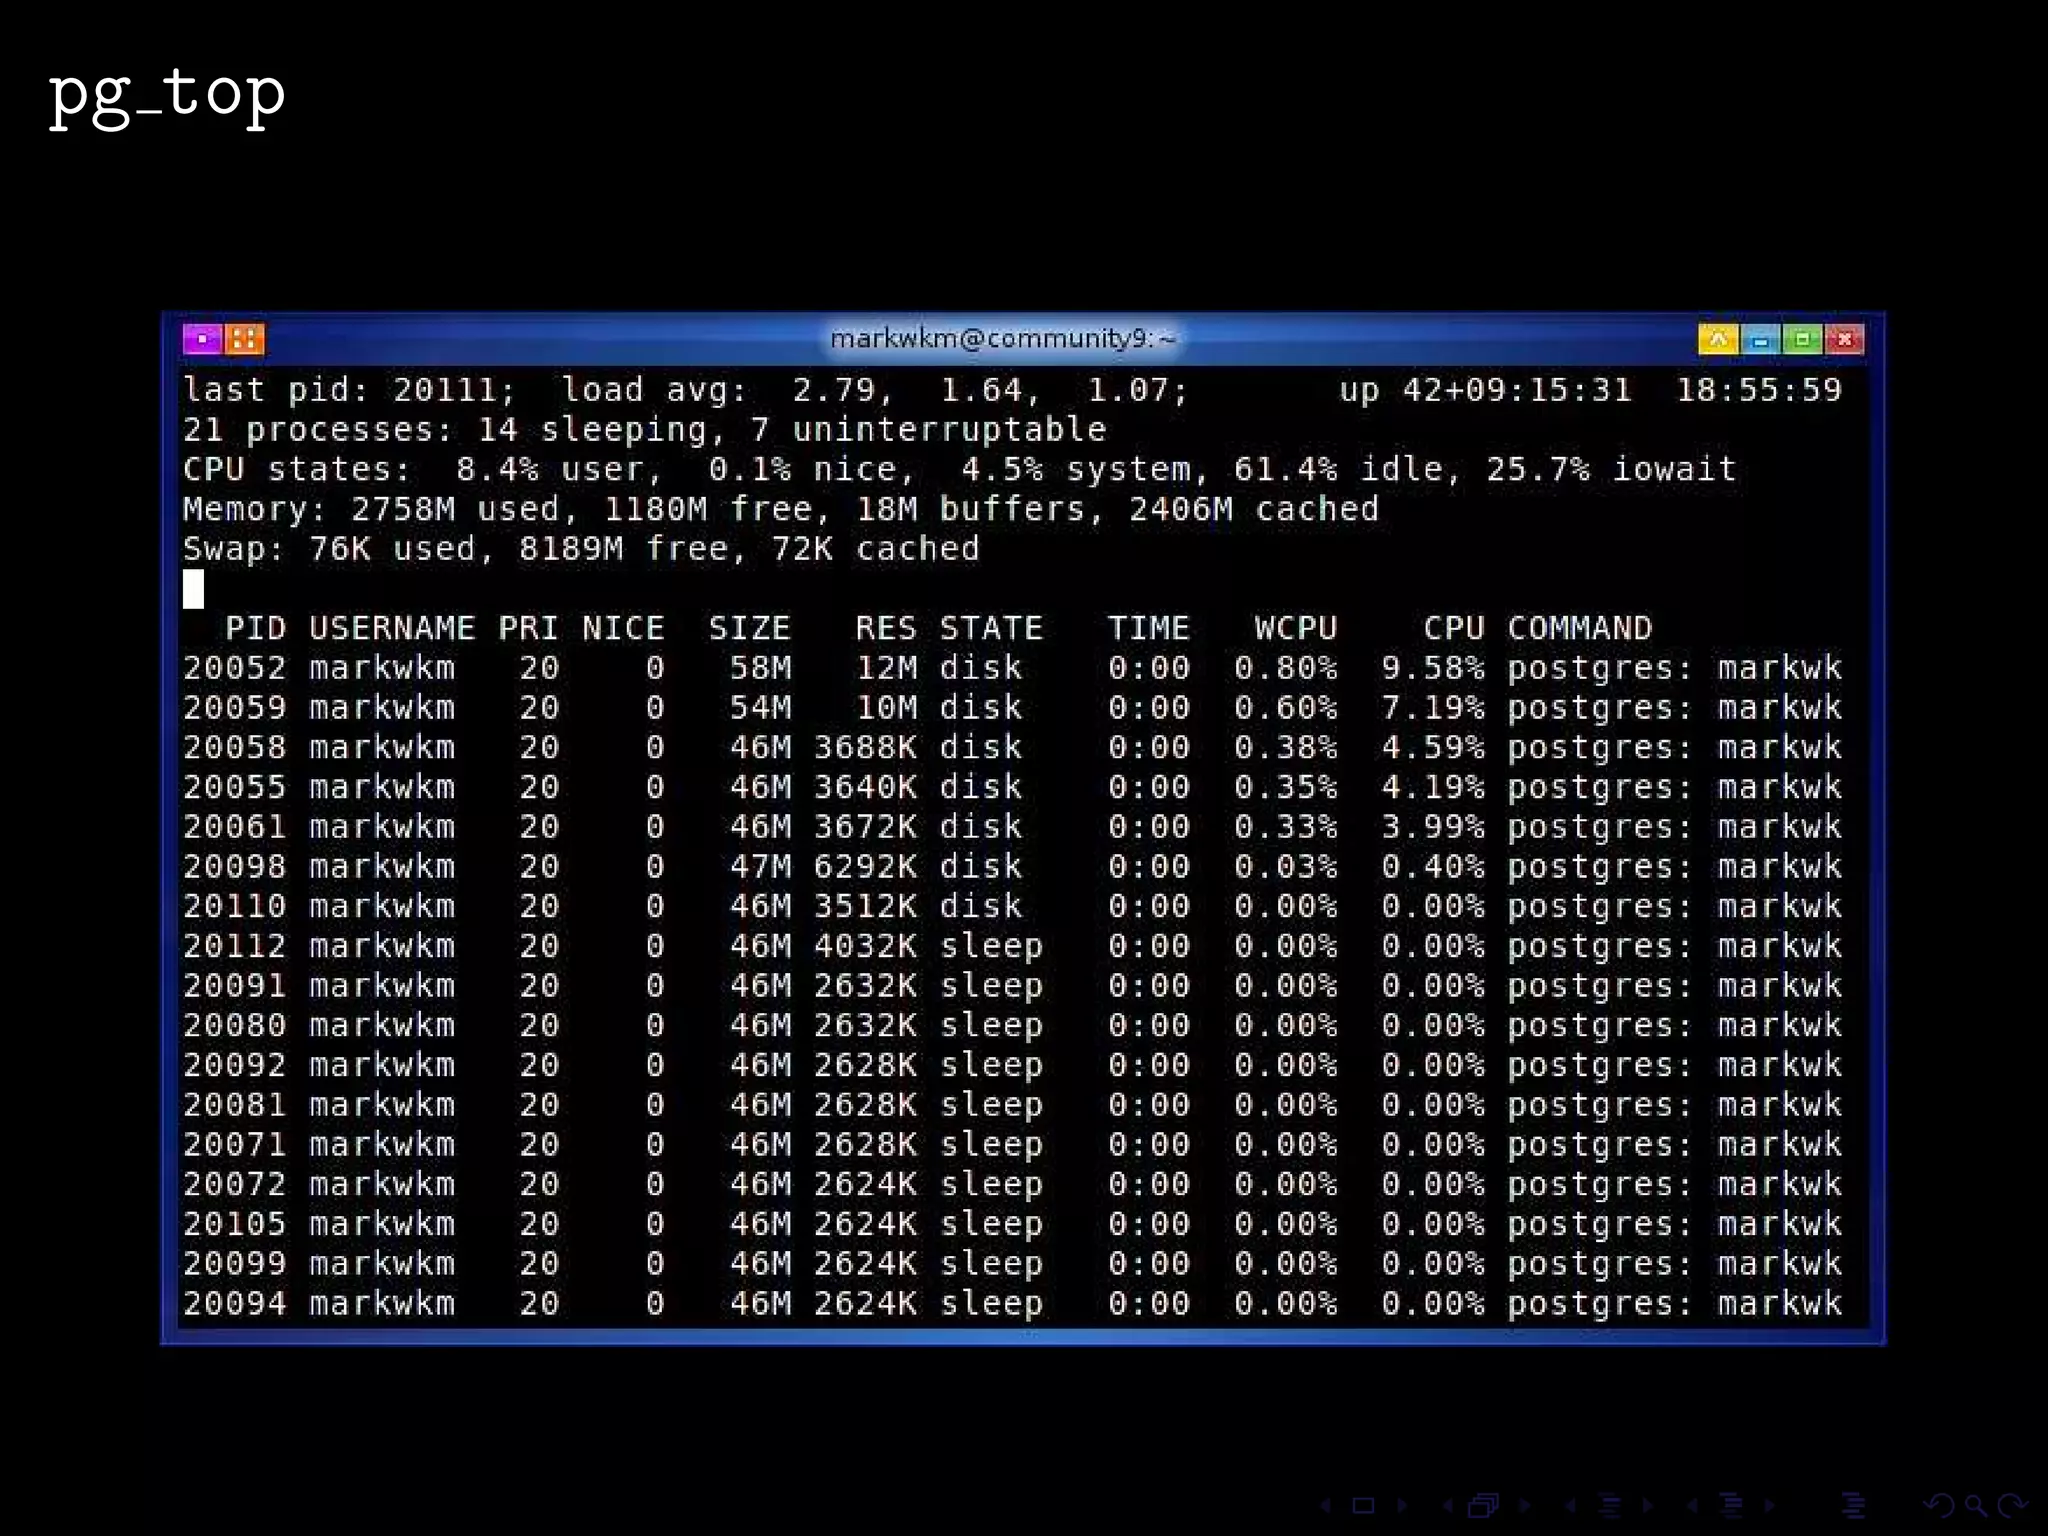

The document provides an overview of pg_proctab, a collection of C stored functions for accessing system statistics in PostgreSQL, including processor time, memory usage, and load averages. It includes examples of SQL queries using pg_proctab functions such as pg_cputime, pg_loadavg, and pg_memusage to retrieve system data. Additionally, it explains how to collect statistics for queries, create custom reports, and monitor remote databases using pg_top.