This document provides guidance on tuning and monitoring SQL queries in Tibero. It describes how to view SQL execution results using SQL trace files generated by setting the SQL_TRACE parameter or using the SET_SQL_TRACE_IN_SESSION procedure. It also explains how to use the tbPROF command to analyze the output trace files and view statistics on query parsing, execution and fetching. Additional topics covered include using AUTOTRACE in tbSQL, the V$SQL_PLAN view, SQL_TRACE_DEST parameter and privilege requirements for AUTOTRACE.
![Tuning and Monitoring
Better Technology, Better Tomorrow
5
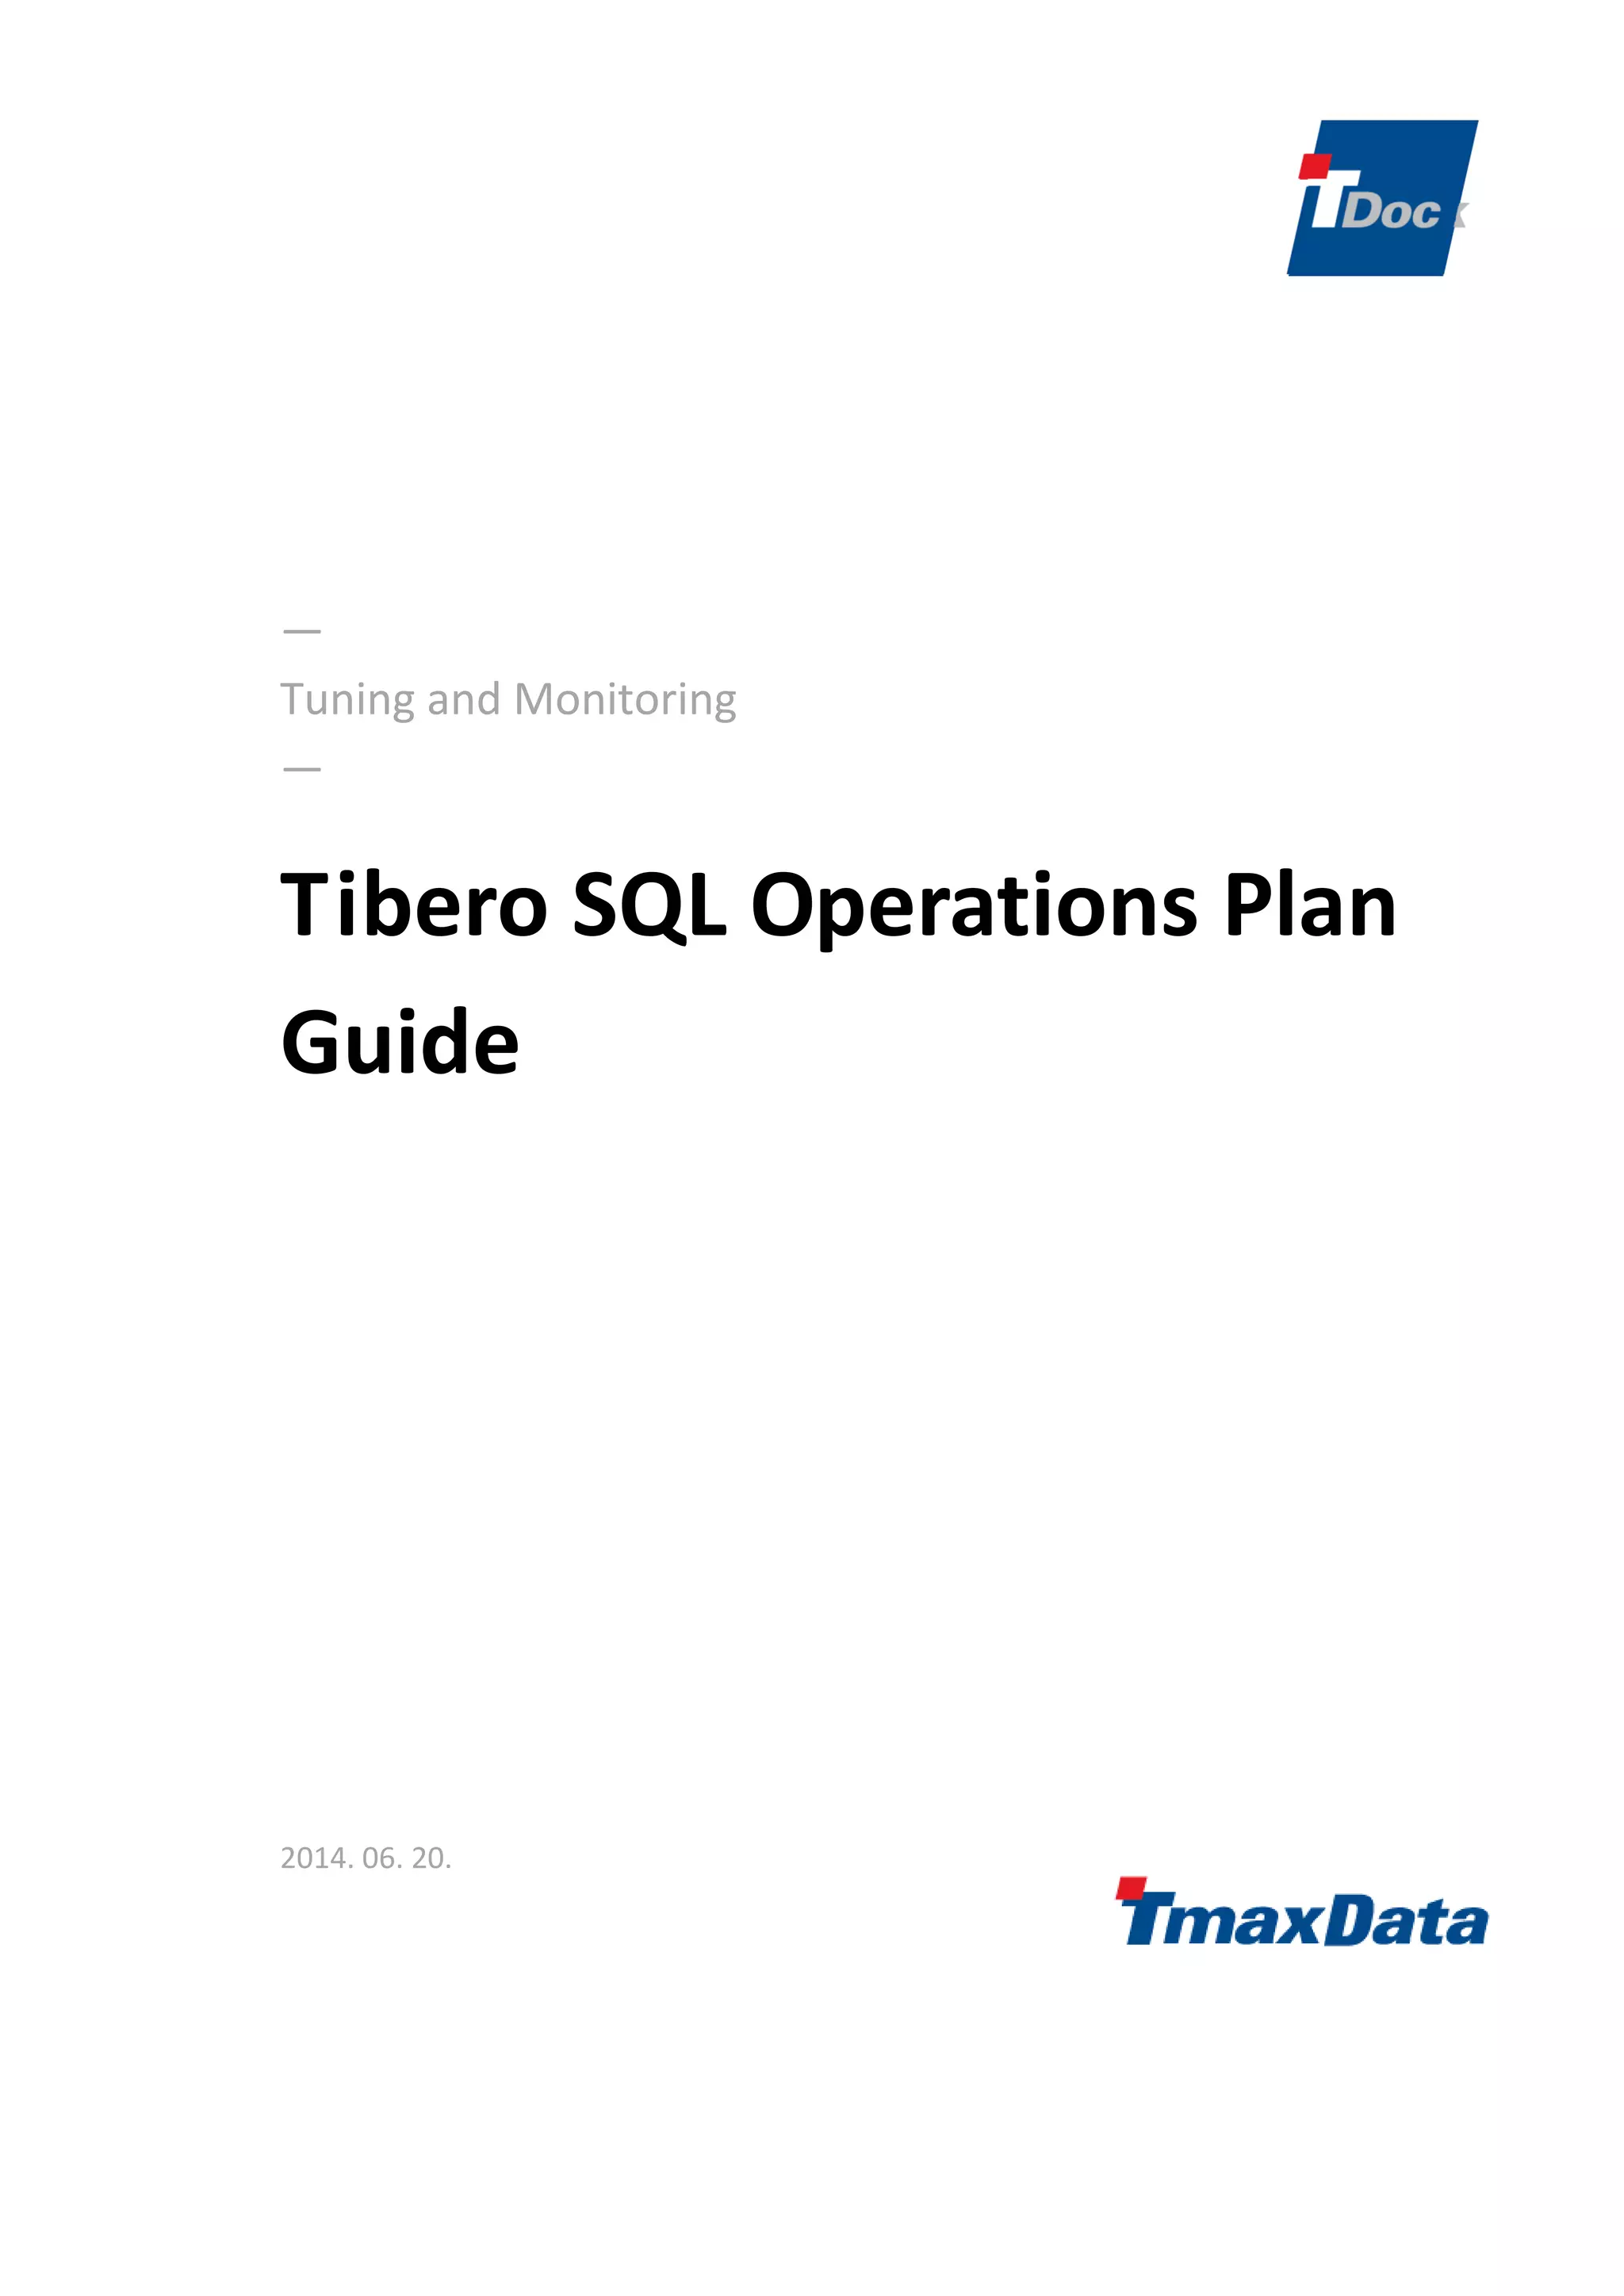
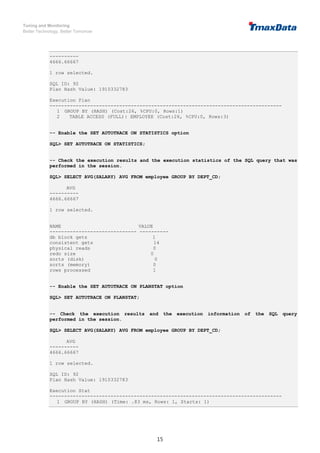
1.1.2. Verifying the Created SQL Trace File
The trace file is placed in the following directory with the '.trc' extension.
File Location: $TB_HOME/instance/$TB_SID/log/sqltrace
File Naming Rule
- A file name is created using the PID, SID, and serial# of the session.
E.g., tb_sqltrc_PID_SID_serial#.trc
- The PID, SID, and serial# information can be queried using the v$session view.
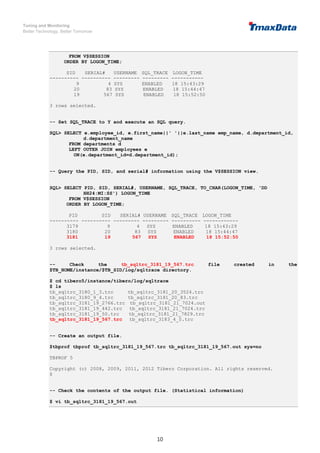
-- Query the PID, SID, and serial# information using the V$SESSION view.
SQL> SELECT PID, SID, SERIAL#, USERNAME, SQL_TRACE, TO_CHAR(LOGON_TIME, 'DD
HH24:MI:SS') LOGON_TIME
FROM V$SESSION
ORDER BY LOGON_TIME;
PID SID SERIAL# USERNAME SQL_TRACE LOGON_TIME
---------- ---------- --------- --------- ---------- ------------
3179 9 4 SYS ENABLED 18 15:43:29
3180 20 83 SYS ENABLED 18 15:44:47
3181 19 567 SYS ENABLED 18 15:52:50
3 rows selected.
-- Check the tb_sqltrc_3181_19_567.trc file created in the
$TB_HOME/instance/$TB_SID/log/sqltrace directory.
$ cd tibero5/instance/tibero/log/sqltrace
$ ls
tb_sqltrc_3180_1_3.trc tb_sqltrc_3181_20_3524.trc
tb_sqltrc_3180_9_4.trc tb_sqltrc_3181_20_83.trc
tb_sqltrc_3181_19_2766.trc tb_sqltrc_3181_21_7024.out
tb_sqltrc_3181_19_442.trc tb_sqltrc_3181_21_7024.trc
tb_sqltrc_3181_19_50.trc tb_sqltrc_3181_21_7829.trc
tb_sqltrc_3181_19_567.trc tb_sqltrc_3183_4_0.trc
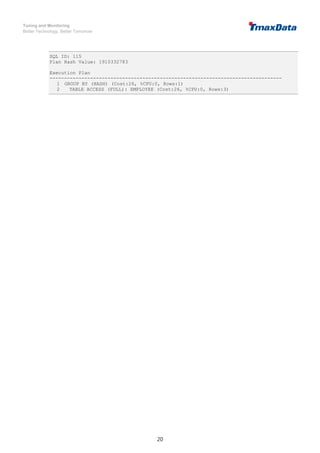
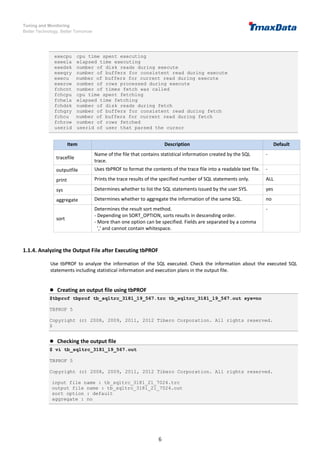
1.1.3. Executing the tbPROF Command
This command provides the information about the SQL in the parse, execution, and fetch stages. It sorts the
result of the user-specified field to display the result.
The following is an example of checking the tbPROF parameters and executing the tbPROF command.
Checking the tbPROF parameter
$ tbprof
Usage: tbprof tracefile outputfile [print= ] [sort= ] [aggregate= ]
print=integer List only the first 'integer' SQL statements.
sys=yes|no Filter SQL statements that 'SYS' user executes.
aggregate=yes|no Aggregate statistics of same SQL statements.
sort=option Set of zero or more of the following sort options:
prscnt number of times parse was called
prscpu cpu time parsing
prsela elapsed time parsing
prsdsk number of disk reads during parse
prsqry number of buffers for consistent read during parse
prscu number of buffers for current read during parse
execnt number of execute was called](https://image.slidesharecdn.com/tiberosqlexecutionplanguideen-220110085628/85/Tibero-sql-execution-plan-guide-en-5-320.jpg)
![Tuning and Monitoring
Better Technology, Better Tomorrow
12
-----------------------------------------------------------------------------
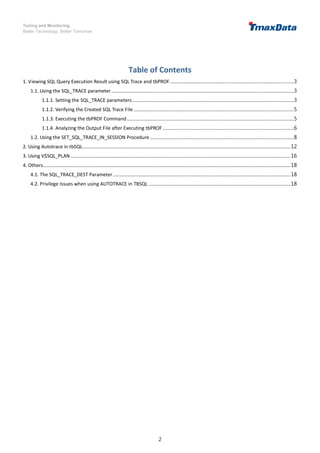
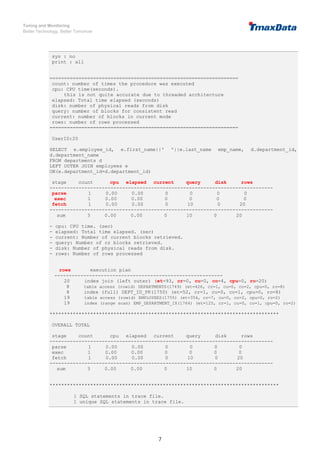
sum 3 0.00 0.00 0 10 0 20
*******************************************************************************
1 SQL statements in trace file.
1 unique SQL statements in trace file.
16 lines in trace file.
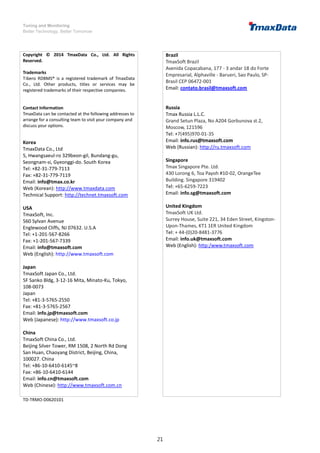
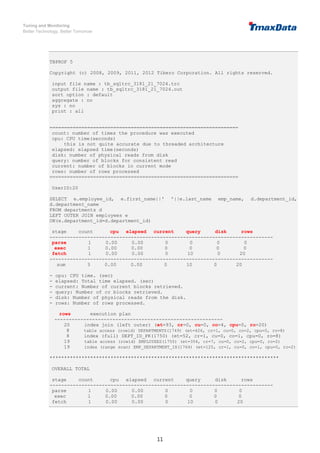
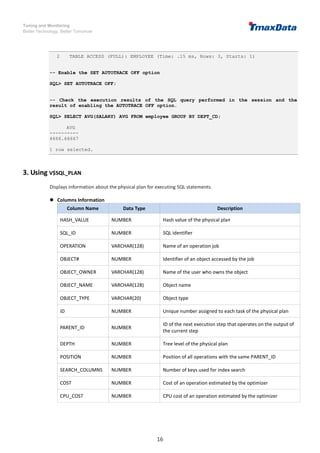
2. Using Autotrace in tbSQL
SQL Syntax
- SET AUTOT[RACE] {OFF|ON|TRACE[ONLY]} [EXP[LAIN]] [STAT[ISTICS]] [PLANS[TAT]]
Setting Description
SET AUTOTRACE OFF AUTOTRACE is not performed. (Default value)
SET AUTOTRACE ON
Shows the execution plan, execution results, and execution
statistics of the SQL statement.
SET AUTOTRACE TRACEONLY
Shows both the execution plan and the execution statistics of
the SQL statement. Fast processing.
SET AUTOTRACE ON EXPLAIN
Shows the execution results and the execution plan of the SQL
statement.
SET AUTOTRACE ON STATISTICS
Shows the execution results and the execution statistics of the
SQL statement.
SET AUTOTRACE ON PLANSTAT
Shows the execution results of the SQL statement and the
query executions per node.
(Time spent executing, number of rows processed, number of
executions)
- When AUTOTRACE is used, OFF, ON, or TRACE[ONLY] must be specified.
- [EXP[LAIN]] [STAT[ISTICS]] [PLANS[TAT]] shows the execution plan, execution statistics, and query
executions in each node, respectively. Execution information includes execution time, number of rows
processed, and number of executions. All, some, or none of the options can be selected.
- AUTOTRACE allows users to selectively view execution results, execution plans, or execution statistics
according to the option.
- Execution results and execution statistics are the results of query executions, and the execution plan
contains estimated values.
Privilege - DBA privilege or the PLUSTRACE role are required.
Shows Execution Result/Execution Plan/Execution Statistics/Execution Information
Category Description
SQL Query SQL> SELECT AVG(SALARY) AVG FROM employee GROUP BY DEPT_CD;
Execution Result
AVG
----------
4666.66667
1 row selected.](https://image.slidesharecdn.com/tiberosqlexecutionplanguideen-220110085628/85/Tibero-sql-execution-plan-guide-en-12-320.jpg)
![Tuning and Monitoring
Better Technology, Better Tomorrow
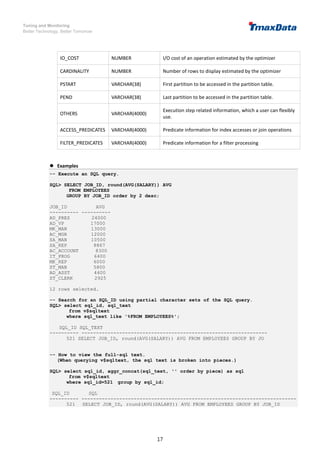
19
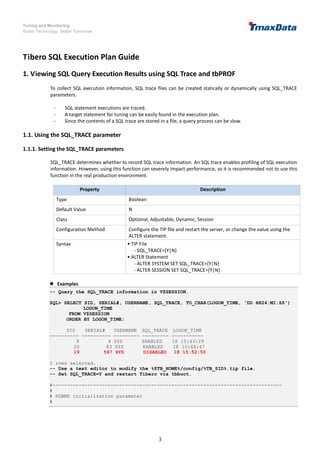
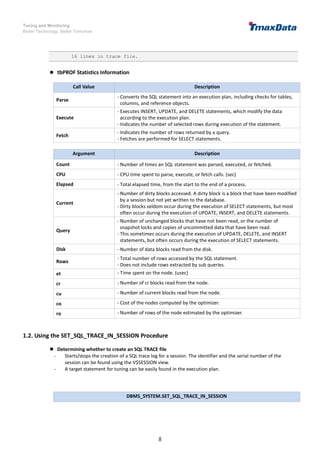
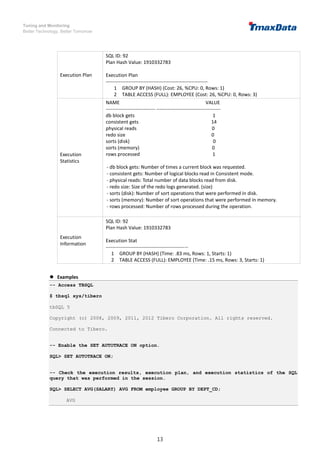
-- The following message occurs when an SQL query is performed in the session without
the PLUSTRACE role.
SQL> SELECT AVG(SALARY) AVG FROM employee GROUP BY DEPT_CD;
AVG
----------
4666.66667
1 row selected.
[B]TBR-8033: Specified schema object was not found.
at line 1, column 424:
"Execution Plan" FROM (SELECT * FROM V$SQL_PLAN WHERE SQL_ID = 115 AND HASH_V
^
TBS-70035: Unable to display plan: check PLUSTRACE role.
[B]TBR-8033: Specified schema object was not found.
at line 1, column 98:
RS AS "Remote SQL Information" FROM V$SQL_PLAN WHERE SQL_ID = 115 AND
^
TBS-70035: Unable to display plan: check PLUSTRACE role.
[B]TBR-8033: Specified schema object was not found.
at line 1, column 66:
with x as (select id, access_predicates, filter_predicates from v$sql_plan where
^
TBS-70035: Unable to display plan: check PLUSTRACE role.
-- Create the PLUSTRACE role.
SQL> @plustrace.sql
TBR-7070: Specified role 'PLUSTRACE' was not found.
Role 'PLUSTRACE' created.
Granted.
Granted.
Granted.
Granted.
File finished.
-- Run an SQL query to check the SQL execution plan of the query.
SQL> SELECT AVG(SALARY) AVG FROM employee GROUP BY DEPT_CD;
AVG
----------
4666.66667
1 row selected.](https://image.slidesharecdn.com/tiberosqlexecutionplanguideen-220110085628/85/Tibero-sql-execution-plan-guide-en-19-320.jpg)