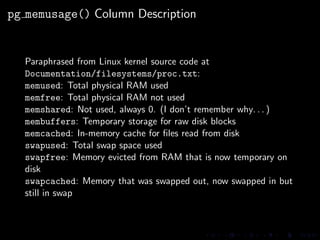
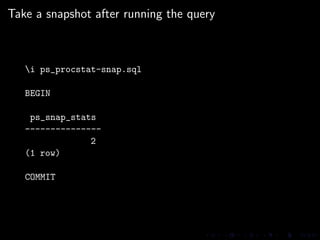
Download as PDF, PPTX

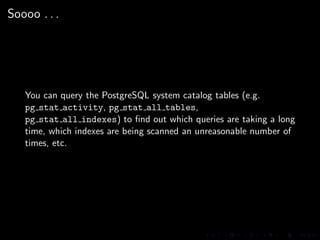


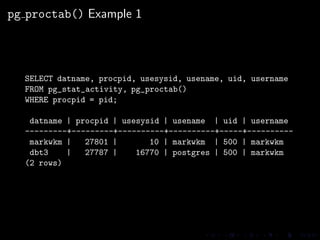
![pg proctab() Example 2
SELECT datname, procpid, processor, state, fullcomm
FROM pg_stat_activity, pg_proctab()
WHERE procpid = pid;
datname | procpid | processor | state | fullcomm
---------+---------+-----------+-------+------------------------------------------
markwkm | 27801 | 0 | R | postgres: markwkm markwkm [local] SELECT
dbt3 | 29325 | 3 | R | postgres: markwkm dbt3 [local] SELECT
dbt3 | 29327 | 0 | R | postgres: markwkm dbt3 [local] SELECT
dbt3 | 29333 | 3 | R | postgres: markwkm dbt3 [local] SELECT
dbt3 | 29328 | 2 | R | postgres: markwkm dbt3 [local] SELECT
dbt3 | 29329 | 0 | R | postgres: markwkm dbt3 [local] SELECT
dbt3 | 29324 | 3 | R | postgres: markwkm dbt3 [local] SELECT
dbt3 | 29331 | 0 | R | postgres: markwkm dbt3 [local] SELECT
dbt3 | 27787 | 1 | S | postgres: postgres dbt3 [local] idle
(9 rows)](https://image.slidesharecdn.com/lfnw2009-pg-091018010107-phpapp02-101008165208-phpapp01/85/pg_proctab-Accessing-System-Stats-in-PostgreSQL-14-320.jpg)
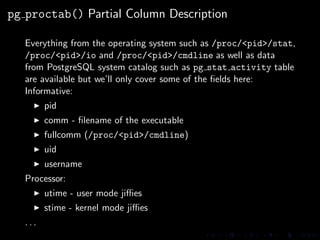


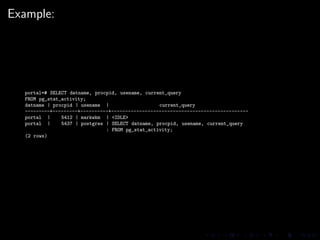
![Calculate Processor Utilization
$ ./ps-processor-utilization.sh [pid] [before] [after]
$ ./ps-processor-utilization.sh 4590 1 2
Processor Utilization = 1.00 %
What’s going on (partially):
SELECT stime, utime, stime + utime AS total,
extract(epoch FROM time)
FROM ps_snaps a, ps_procstat b
WHERE pid = ${PID}
AND a.snap = b.snap
AND a.snap = ${SNAP1}
TIMEDIFF=‘echo "scale = 2; (${TIME2} - ${TIME1}) * ${HZ}" | bc -l‘
U=‘echo "scale = 2; (${TOTAL2} - ${TOTAL1}) / ${TIMEDIFF} * 100" | bc -l‘](https://image.slidesharecdn.com/lfnw2009-pg-091018010107-phpapp02-101008165208-phpapp01/85/pg_proctab-Accessing-System-Stats-in-PostgreSQL-25-320.jpg)


The document discusses using pg_proctab, a PostgreSQL extension that provides functions to query operating system process and statistics tables from within PostgreSQL. It demonstrates how to use pg_proctab to monitor CPU and memory usage, I/O, and other process-level metrics for queries. The document also shows how to generate custom reports on database activity and performance by taking snapshots before and after queries and analyzing the differences.