Download to read offline

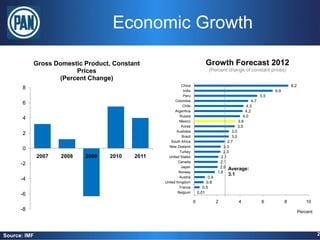
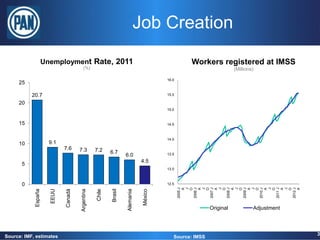
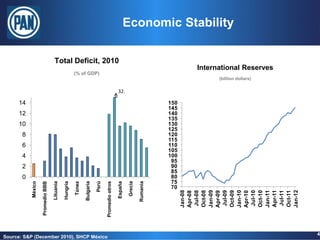
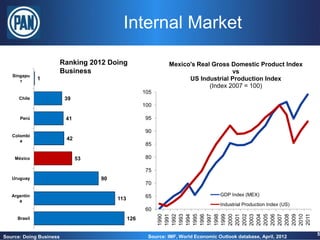
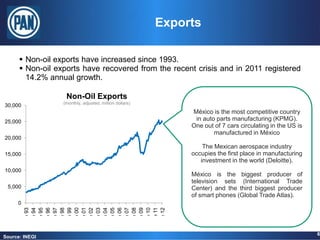
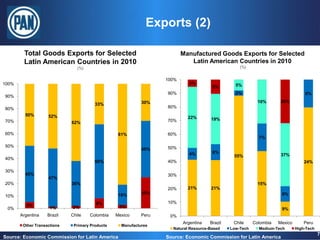

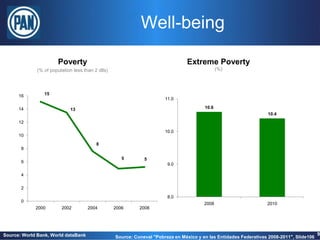
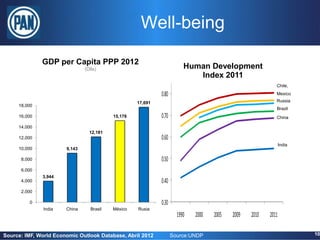
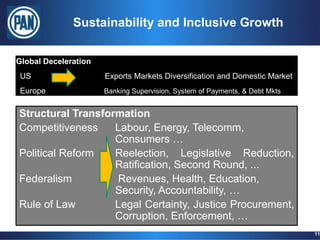
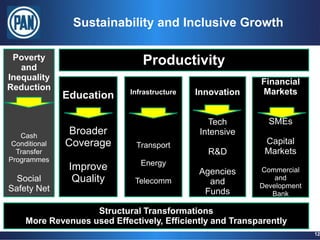


The document analyzes the economic outlook of various countries in June 2012, highlighting GDP growth forecasts, job creation, and international trade. It emphasizes Mexico's competitiveness in manufacturing and exports, particularly in the automotive and aerospace sectors. Additionally, it addresses economic stability, health coverage, poverty rates, and necessary reforms for sustainable and inclusive growth.


![{[American Airlines Student Discount ]}★ Booking Guide 2026.pptx](https://cdn.slidesharecdn.com/ss_thumbnails/americanairlinesstudentdiscountbookingguide2026-260131065509-90065aae-thumbnail.jpg?width=640&height=640&fit=bounds)
