
Download as PDF, PPTX

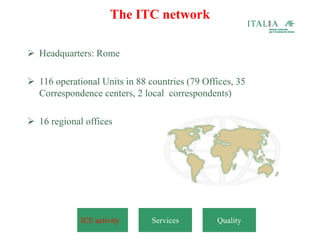


The Italian Trade Commission (ITC) promotes trade between Italy and other countries by supporting small and medium Italian companies seeking to expand internationally. It has over 116 operational units in 88 countries, including 79 offices and 35 correspondence centers. The ITC carries out promotional initiatives in 70 countries each year for 90 different trade sectors, involving thousands of Italian and foreign companies. It also trains young professionals and entrepreneurs to help them internationalize.


