Download to read offline


![9JUNE 2014
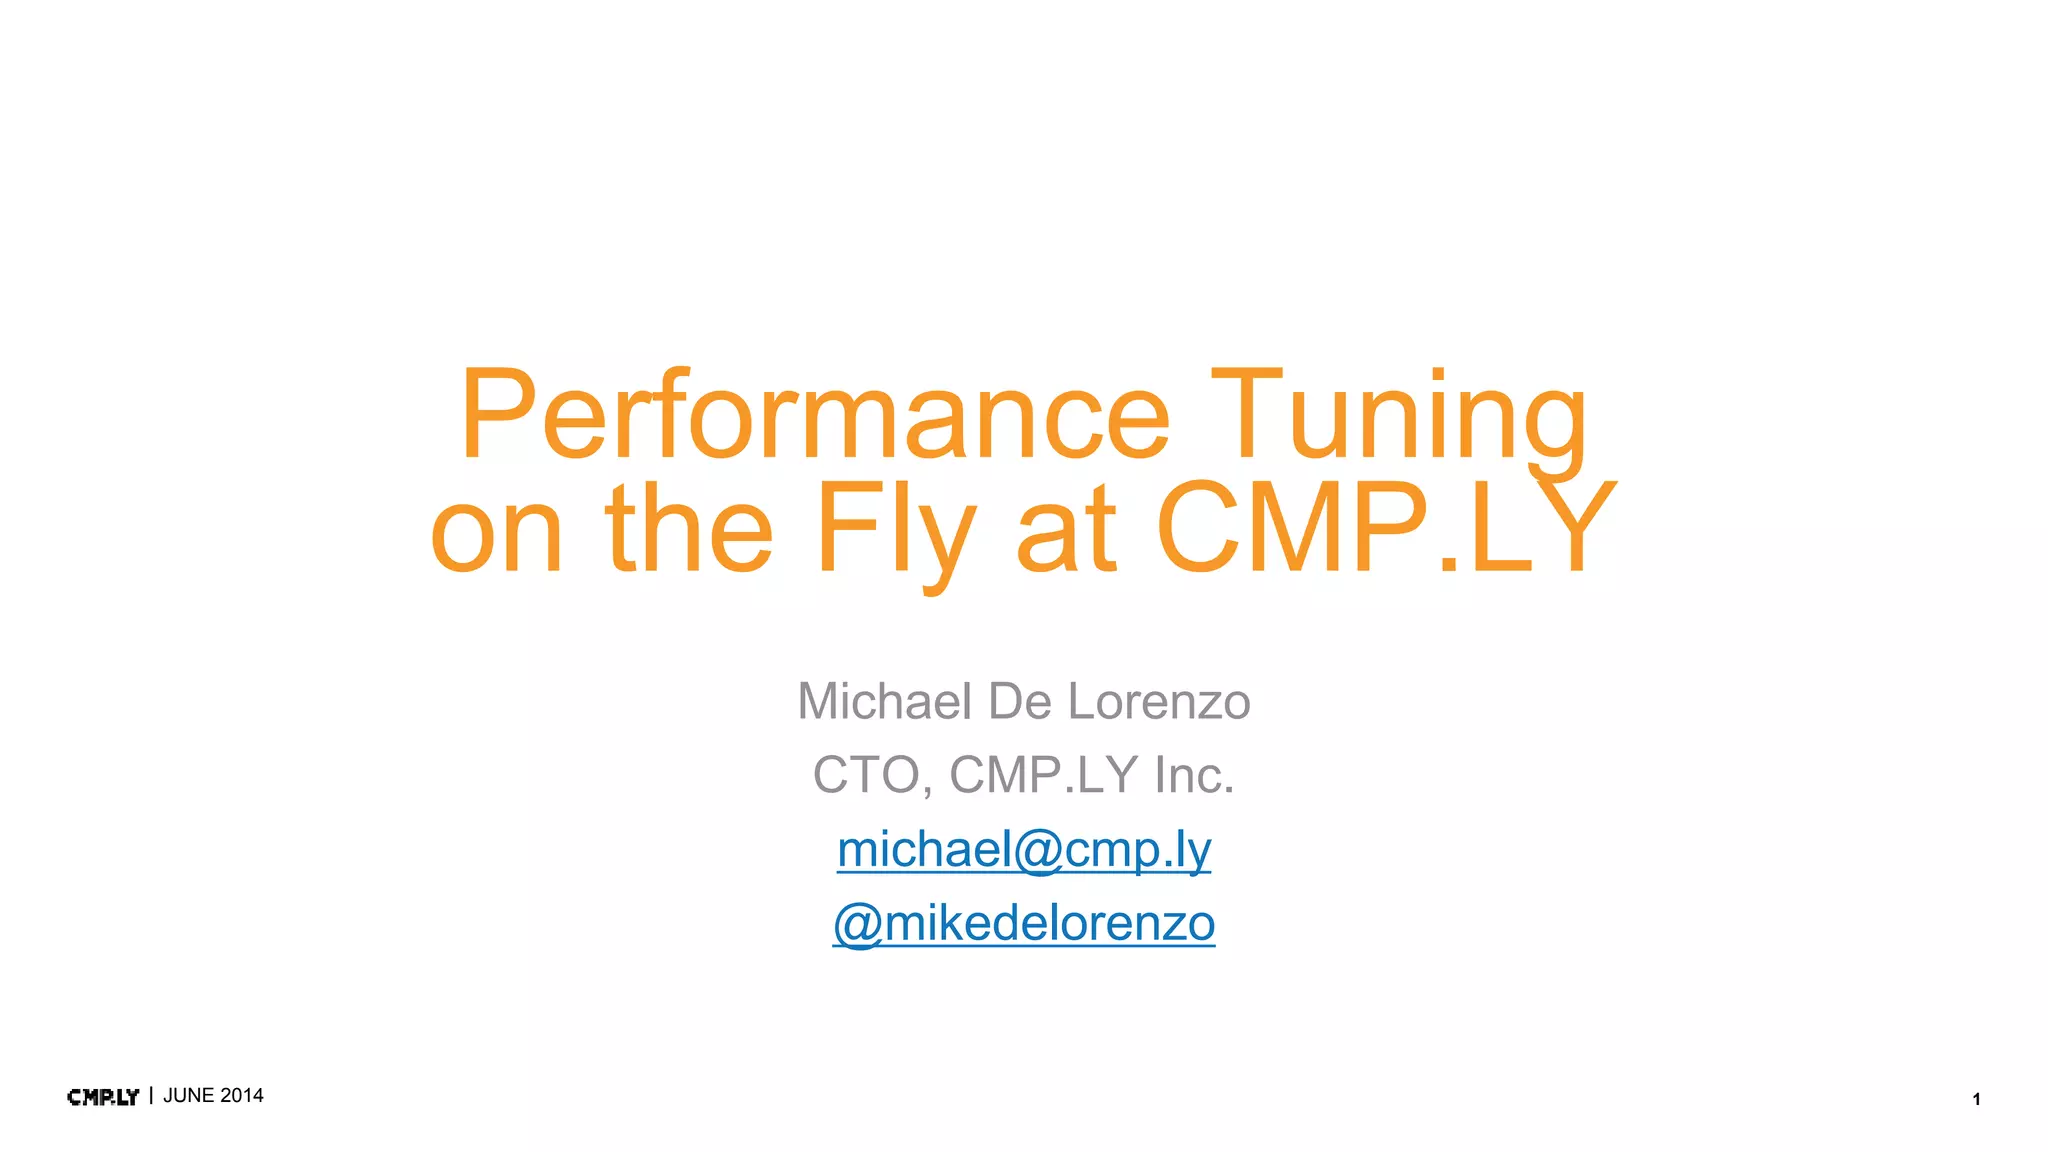
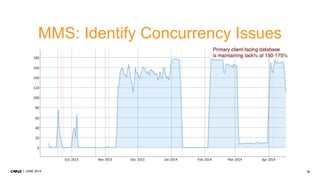
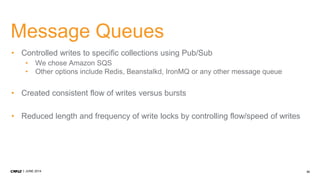
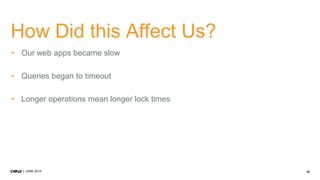
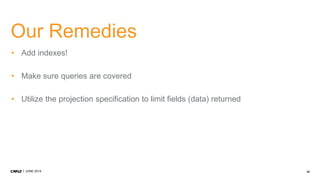
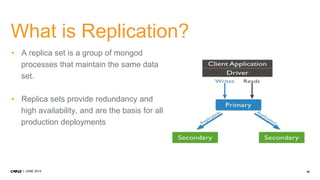
How To Do Performance Tuning?
• Assess the problem and establish acceptable behavior.
• Measure the performance before modification.
• Identify the bottleneck.
• Remove the bottleneck.
• Measure performance after modification to confirm.
• Keep it or revert it and repeat.
Adapted from [http://en.wikipedia.org/wiki/Performance_tuning]](https://image.slidesharecdn.com/muc6oeuqceew4ezzdujy-signature-1fff2c55bcb3dde9a35194ae2b283f3e1bcf0b42460983f225b77971d17f867d-poli-140707152440-phpapp02/85/Performance-Tuning-on-the-Fly-at-CMP-LY-9-320.jpg)


![21JUNE 2014
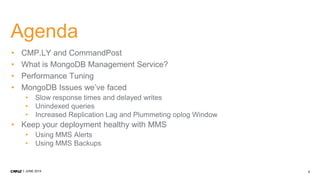
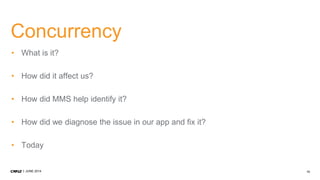
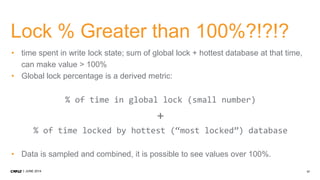
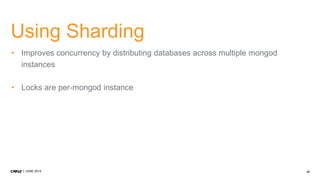
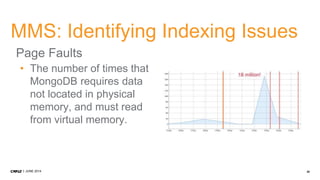
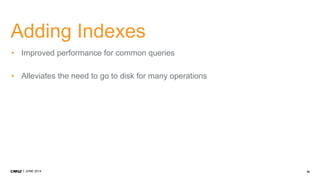
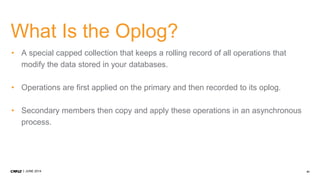
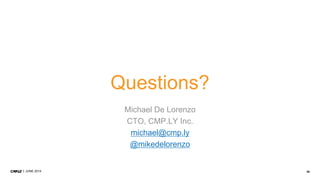
Modeling for Atomic Operations
Document
{
_id: 123456789,
title: "MongoDB: The Definitive Guide",
author: [ "Kristina Chodorow", "Mike Dirolf"
],
published_date: ISODate("2010-09-24"),
pages: 216,
language: "English",
publisher_id: "oreilly",
available: 3,
checkout: [ { by: "joe", date:
ISODate("2012-10-15") } ]
}
Update Operation
db.books.update (
{ _id: 123456789, available: { $gt: 0 } },
{
$inc: { available: -1 },
$push: { checkout: { by: "abc", date: new
Date() } }
}
)
Result
WriteResult({ "nMatched" : 1, "nUpserted" : 0,
"nModified" : 1 })](https://image.slidesharecdn.com/muc6oeuqceew4ezzdujy-signature-1fff2c55bcb3dde9a35194ae2b283f3e1bcf0b42460983f225b77971d17f867d-poli-140707152440-phpapp02/85/Performance-Tuning-on-the-Fly-at-CMP-LY-21-320.jpg)


![28JUNE 2014
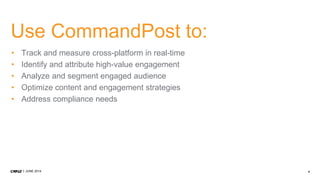
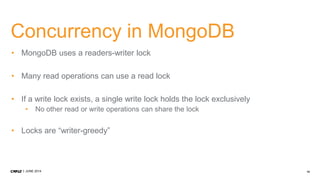
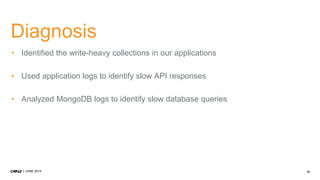
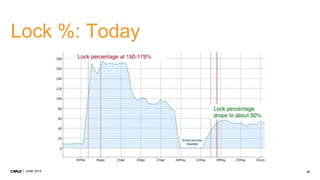
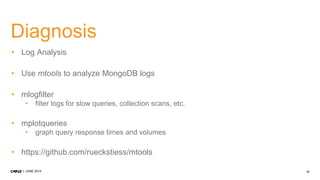
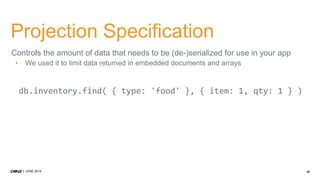
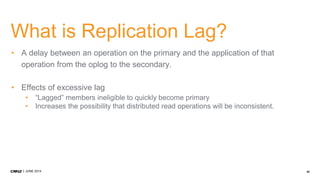
Indexing with MongoDB
• Support for efficient execution of queries
• Without indexes, MongoDB must scan every document
• Example
Wed Jul 17 13:40:14 [conn28600] query x.y [snip] ntoreturn:16 ntoskip:0
nscanned:16779 scanAndOrder:1 keyUpdates:0 numYields: 906 locks(micros)
r:46877422 nreturned:16 reslen:6948 38172ms
38 seconds! Scanned 17k documents, returned 16
• Create indexes to cover all queries, especially support common and user-facing
• Collection scans can push entire working set out of RAM](https://image.slidesharecdn.com/muc6oeuqceew4ezzdujy-signature-1fff2c55bcb3dde9a35194ae2b283f3e1bcf0b42460983f225b77971d17f867d-poli-140707152440-phpapp02/85/Performance-Tuning-on-the-Fly-at-CMP-LY-28-320.jpg)


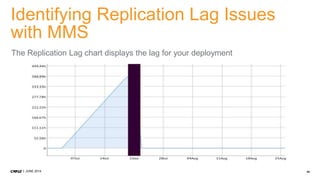
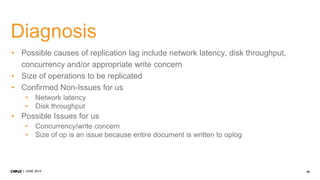
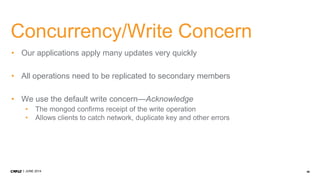
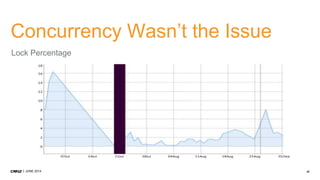
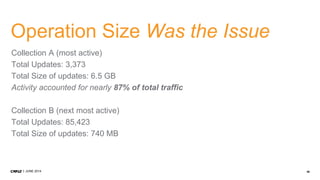
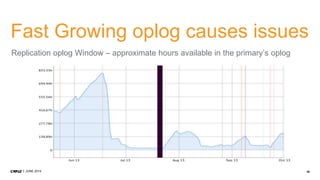
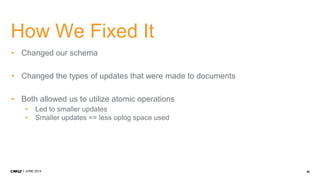
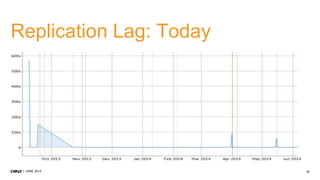
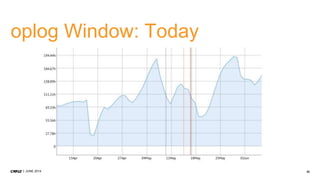


1. CMP.LY is a venture-funded startup that offers social media monitoring, measurement, and compliance solutions for Fortune 100 companies. Their tool, CommandPost, allows users to track, measure, analyze, and optimize social media engagement and address compliance needs. 2. The presentation discusses performance tuning of MongoDB deployments. Common issues addressed include concurrency, unindexed queries, increasing replication lag, and a plummeting oplog window. MongoDB Management Service (MMS) helps identify and diagnose these issues. 3. Solutions to the issues included schema changes, message queues, sharding, adding appropriate indexes, and making updates smaller to reduce replication lag and improve the oplog window. MMS alerts and backups


![MongoDB .local San Francisco 2020: Powering the new age data demands [Infosys]](https://cdn.slidesharecdn.com/ss_thumbnails/315pminfosysfinalsfoversionvocalpart1-200120221508-thumbnail.jpg?width=640&height=640&fit=bounds)


![Getting Started with Apache Spark: Big Data Made Simple [Free Meetup]](https://cdn.slidesharecdn.com/ss_thumbnails/apachesparkgettingstarted-260203175547-8361bcc3-thumbnail.jpg?width=640&height=640&fit=bounds)


