Download as PDF, PPTX


![Example
// use aggregation to differentiate ops
> db.system.profile.aggregate({ $group : { _id :"$op",
count:{$sum:1},
"max response time":{$max:"$millis"},
"avg response time":{$avg:"$millis"}
}});
{
"result" : [
{ "_id" : "command", "count" : 1, "max response time" : 0, "avg response time" : 0 },
{ "_id" : "query", "count" : 12, "max response time" : 571, "avg response time" : 5 },
{ "_id" : "update", "count" : 842, "max response time" : 111, "avg response time" : 40 },
{ "_id" : "insert", "count" : 1633, "max response time" : 2, "avg response time" : 1 }
],
"ok" : 1
}
● contrast how many of an item vs response time
● contrast average response time vs max
● prioritize op type](https://image.slidesharecdn.com/115682791-mongosv-2012-mongo-performance-tuning-31-121217141833-phpapp01/85/MongoDB-Performance-Tuning-6-320.jpg)
![Example
// use aggregation to differentiate collections
>db.system.profile.aggregate(
{$group : { _id :"$ns", count:{$sum:1}, "max response time":{$max:"$millis"},
"avg response time":{$avg:"$millis"} }},
{$sort: { "max response time":-1}}
);
{
"result" : [
{ "_id" : "game.players","count" : 787, "max response time" : 111, "avg response time" : 0},
{"_id" : "game.games","count" : 1681,"max response time" : 71, "avg response time" : 60},
{"_id" : "game.events","count" : 841,"max response time" : 1,"avg response time" : 0},
....
],
"ok" : 1
}
● keep this data over time!
● contrast how many of an item vs response time
● contrast average response time vs max
● more examples: https://gist.github.
com/995a3aa5b35e92e5ab57](https://image.slidesharecdn.com/115682791-mongosv-2012-mongo-performance-tuning-31-121217141833-phpapp01/85/MongoDB-Performance-Tuning-7-320.jpg)


![Example
{ "ts" : ISODate("2012-09-12T18:13:25.508Z"),
"op" : "update", // this is an update
"ns" : "game.players",
"query" : {"_id" : { "$in" : [ 37013, 13355 ] } }, // the query for the update
"updateobj" : { "$inc" : { "games_started" : 1 }}, // the update being performed
"nscanned" : 1,
"moved" : true, // document is moved
"nmoved" : 1,
"nupdated" : 1,
"keyUpdates" : 0, // at least no secondary indexes
"numYield" : 0,
"lockStats" : { "timeLockedMicros" : { "r" : NumberLong(0),"w" : NumberLong(206)},
"timeAcquiringMicros" : {"r" : NumberLong(0),"w" : NumberLong(163)}},
"millis" : 0,
"client" : "127.0.0.1",
"user" : ""
}](https://image.slidesharecdn.com/115682791-mongosv-2012-mongo-performance-tuning-31-121217141833-phpapp01/85/MongoDB-Performance-Tuning-10-320.jpg)
![Example
{
"ts" : ISODate("2012-09-12T18:13:26.562Z"),
"op" : "update",
"ns" : "game.players",
"query" : {"_id" : { "$in" : [ 27258, 4904 ] } },
"updateobj" : { "$inc" : { "games_started" : 1}},
"nscanned" : 40002, // opportunity
"moved" : true, // opportunity
"nmoved" : 1,
"nupdated" : 1,
"keyUpdates" : 2, // opportunity
"numYield" : 0,
....](https://image.slidesharecdn.com/115682791-mongosv-2012-mongo-performance-tuning-31-121217141833-phpapp01/85/MongoDB-Performance-Tuning-11-320.jpg)

![Example
> db.games.find({ "players" : 32071 }).explain()
{
"cursor" : "BtreeCursor players_1",
"isMultiKey" : true, // multikey type indexed array
"n" : 1, // 1 doc
"nscannedObjects" : 1,
"nscanned" : 1, // visited index
"nscannedObjectsAllPlans" : 1,
"nscannedAllPlans" : 1,
"scanAndOrder" : false,
"indexOnly" : false,
"nYields" : 0, // didn't have to yield
"nChunkSkips" : 0,
"millis" : 2, // fast
"indexBounds" : {"players" : [ [ 32071, 32071 ] ] }, // good, used index
}](https://image.slidesharecdn.com/115682791-mongosv-2012-mongo-performance-tuning-31-121217141833-phpapp01/85/MongoDB-Performance-Tuning-13-320.jpg)
![Example
// index only query
>db.events.find({ "user_id":35891},{"_id":0,"user_id":1}).explain()
{
"cursor" : "BtreeCursor user_id_1",
"isMultiKey" : false,
"n" : 2, // number of docs
"nscannedObjects" : 2,
"nscanned" : 2,
"nscannedObjectsAllPlans" : 2,
"nscannedAllPlans" : 2,
"scanAndOrder" : false, // if sorting, can index be used?
"indexOnly" : true, // Index only query
"nYields" : 0,
"nChunkSkips" : 0,
"millis" : 0,
"indexBounds" : { "user_id" : [ [ 35891, 35891 ] ] },
}](https://image.slidesharecdn.com/115682791-mongosv-2012-mongo-performance-tuning-31-121217141833-phpapp01/85/MongoDB-Performance-Tuning-14-320.jpg)
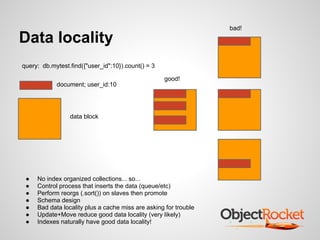
![Example;
Data Locality
> var arr=db.events.find(
{"user_id":35891},
{'$diskLoc':1, 'user_id':1}).limit(20).showDiskLoc()
> for(var i=0; i<arr.length(); i++) {
var b=Math.round(arr[i].$diskLoc.offset/512);
printjson(arr[i].user_id+" "+b);
}
"35891 354"
"35891 55674" // what is this stuff?
examples at:
https://gist.github.com/977336](https://image.slidesharecdn.com/115682791-mongosv-2012-mongo-performance-tuning-31-121217141833-phpapp01/85/MongoDB-Performance-Tuning-16-320.jpg)


This document discusses MongoDB performance tuning. It emphasizes that performance tuning is an obsession that requires planning schema design, statement tuning, and instance tuning in that order. It provides examples of using the MongoDB profiler and explain functions to analyze statements and identify tuning opportunities like non-covered indexes, unnecessary document scans, and low data locality. Instance tuning focuses on optimizing writes through fast update operations and secondary index usage, and optimizing reads by ensuring statements are tuned and data is sharded appropriately. Overall performance depends on properly tuning both reads and writes.


![MongoDB .local San Francisco 2020: Powering the new age data demands [Infosys]](https://cdn.slidesharecdn.com/ss_thumbnails/315pminfosysfinalsfoversionvocalpart1-200120221508-thumbnail.jpg?width=640&height=640&fit=bounds)