This document summarizes key aspects of evaluating information retrieval systems, including:
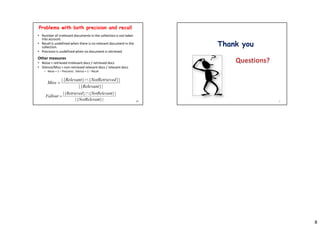
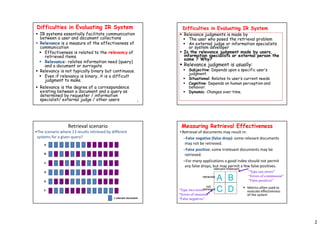
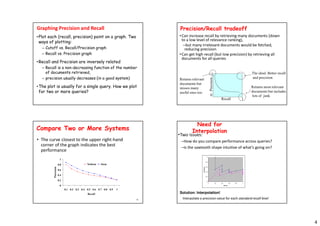
- Precision and recall are common performance measures, where precision measures the percentage of retrieved documents that are relevant and recall measures the percentage of relevant documents retrieved.
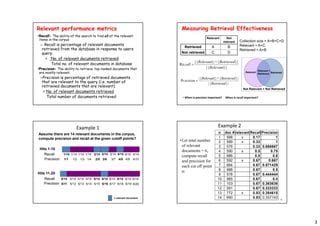
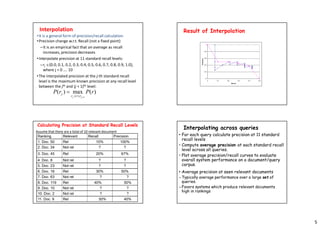
- Other measures include mean average precision (MAP), which averages precision scores across queries, and R-precision, which measures precision after R relevant documents are retrieved, where R is the total number of relevant documents.
- Precision and recall can be plotted on a graph to show their tradeoff, with interpolation used to calculate precision at standard recall levels for better comparison of systems.
- Relevance judgments can be subjective, situational, and dynamic, making evaluation of IR systems challenging.
![6
Single-valued measures
• Single value measures: may want a single value for each
query to evaluate performance
• Such single valued measures include:
– Average precision : Average precision is calculated by
averaging precision when recall increases.
– Mean average precision
– R-precision, etc.
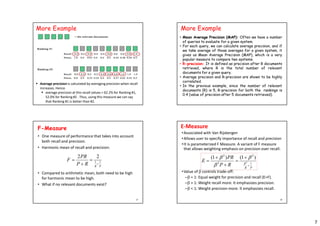
Average precision
• Average precision at each retrieved relevant document
–Relevant documents not retrieved contribute zero to
score
• Example: Assume total of 14 relevant documents,
compute mean average precision.
= relevant document
1/1 1/2 1/3 1/4 2/5 3/6 3/7 4/8 4/9 4/10
5/11 5/12 5/13 5/14 5/15 6/16 6/17 6/18 6/19
4/20
Precision
Precision
Hits 1-10
Hits 11-20
AP = 0.231
MAP (Mean Average Precision)
rij = rank of the j-th relevant
document for Qi
|Ri| = #rel. doc. for Qi
n = # test queries
i i
j
Q R
D ij
i r
j
R
n
MAP )
(
|
|
1
1
8
3
)]
8
2
4
1
(
2
1
)
10
3
5
2
1
1
(
3
1
[
2
1
MAP
• Computing mean average for more than one query
Relevant Docs.
retrieved
Query
1
Query
2
1st rel. doc. 1 4
2nd rel. doc. 5 8
3rd rel. doc. 10
• E.g. Assume that for query 1 and 2, there are 3 and 2 relevant
documents in the collection, respectively.
24
R- Precision
Precision at the R-th position in the ranking of
results for a query, where R is the total number
of relevant documents.
Calculate precision after R documents are seen
Can be averaged over all queries
n doc # relevant
1 588 x
2 589 x
3 576
4 590 x
5 986
6 592 x
7 984
8 988
9 578
10 985
11 103
12 591
13 772 x
14 990
R = # of relevant docs = 6
R-Precision = 4/6 = 0.67](https://image.slidesharecdn.com/chapter5-230522080511-e06988be/85/Chapter-5-Query-Evaluation-pdf-6-320.jpg)