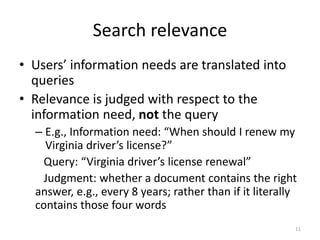
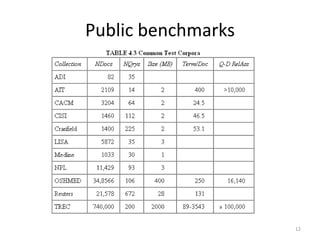
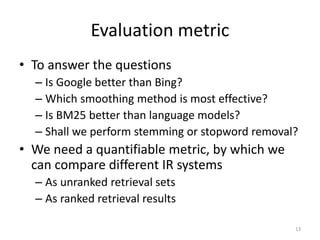
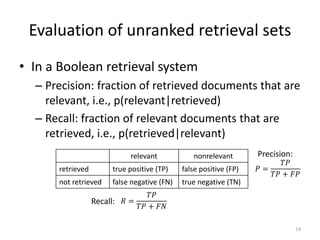
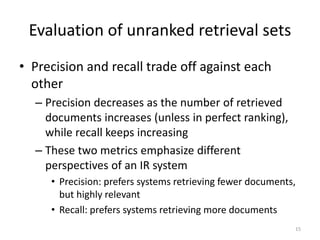
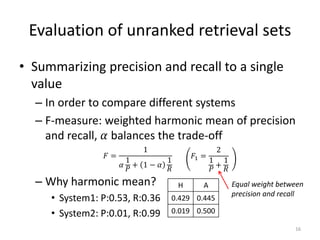
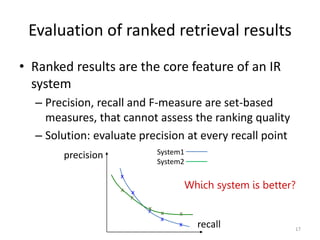
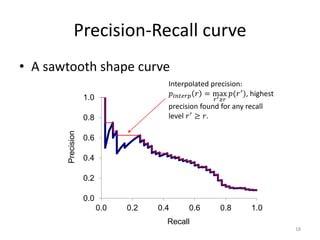
The document discusses retrieval evaluation in information retrieval systems, focusing on user preferences between search engines like Bing and Google based on criteria such as speed, document returns, and relevance. It highlights the importance of quantifying information retrieval quality through metrics like precision and recall, along with methods for assessing ranked results. Key evaluation techniques such as the mean average precision (MAP) are outlined to compare the effectiveness of different systems in satisfying user information needs.

![0
0.2
0.4
0.6
0.8
1
0 0.2 0.4 0.6 0.8 1
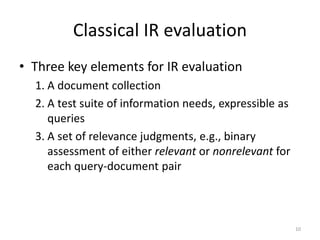
Precision
Recall
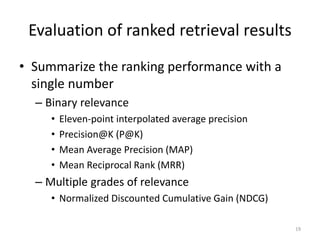
Eleven-point interpolated average precision
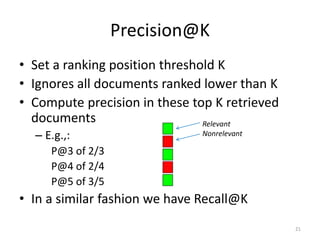
• At the 11 recall levels [0,0.1,0.2,…,1.0],
compute arithmetic mean of interpolated
precision over all the queries
20](https://image.slidesharecdn.com/lecture10-informationretrievalevaluation-240722092017-4fc7d608/85/Lecture-10-Information-Retrieval-Evaluation-pptx-20-320.jpg)