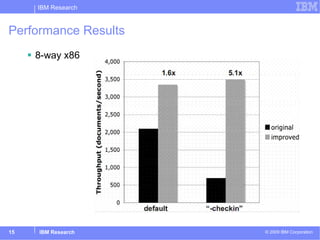
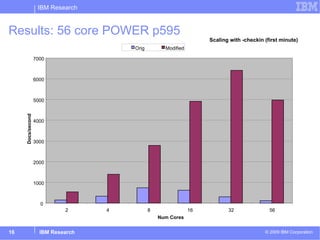
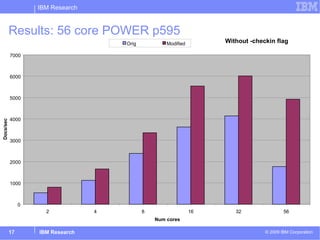
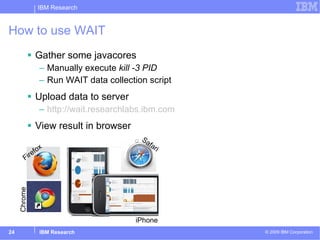
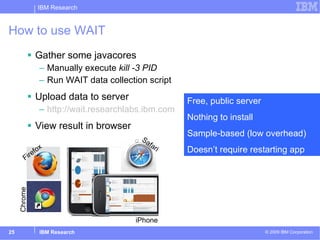
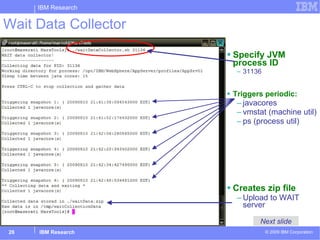
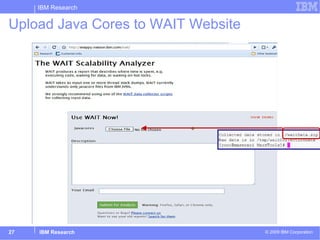
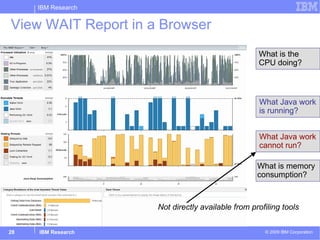
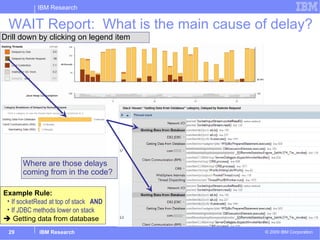
The document summarizes a performance analysis study of a large enterprise application called Zanzibar. The researchers initially struggled to get the application to scale even on modest hardware. Through analyzing javacores, they identified and addressed multiple bottlenecks, including lock contention, disk throughput issues, and inefficient Java code. These changes resulted in performance improvements of 1.4-5x. The researchers also developed the WAIT performance tool to help identify primary bottlenecks in deployed applications with low overhead. The tool uses standard OS and JVM data and has seen widespread adoption due to its ease of use.


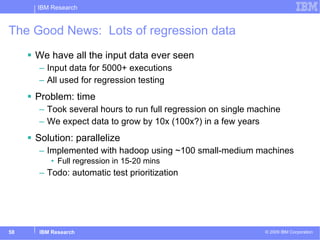
![Testimonial: Health Care System Crit-Sit April-May 2010: Tool team worked intensively on custom workload Batch, Java, Database Major health care provider Approximately 10x gain during that period Metric: Transactions per hour Others continued to use tool intensively through August – when performance goal achieved. 400+ WAIT reports over 4 months as part of standard performance testing script Result: 60x overall improvement 30 small, localized changes “ Tell your boss you have a tool I would buy.” "The [other] guys are still trying to figure out how to get the tracing installed on all the tiers." Crit-Sit = Critical Situation / Problem](https://image.slidesharecdn.com/ecoopsummerschoolwaitpublic-110806052625-phpapp02/85/Performance-Analysis-of-Idle-Programs-51-320.jpg)


![Getting Started with Apache Spark: Big Data Made Simple [Free Meetup]](https://cdn.slidesharecdn.com/ss_thumbnails/apachesparkgettingstarted-260203175547-8361bcc3-thumbnail.jpg?width=640&height=640&fit=bounds)


