Download as PDF, PPTX
![Programmer Nightmares
ClassCastException
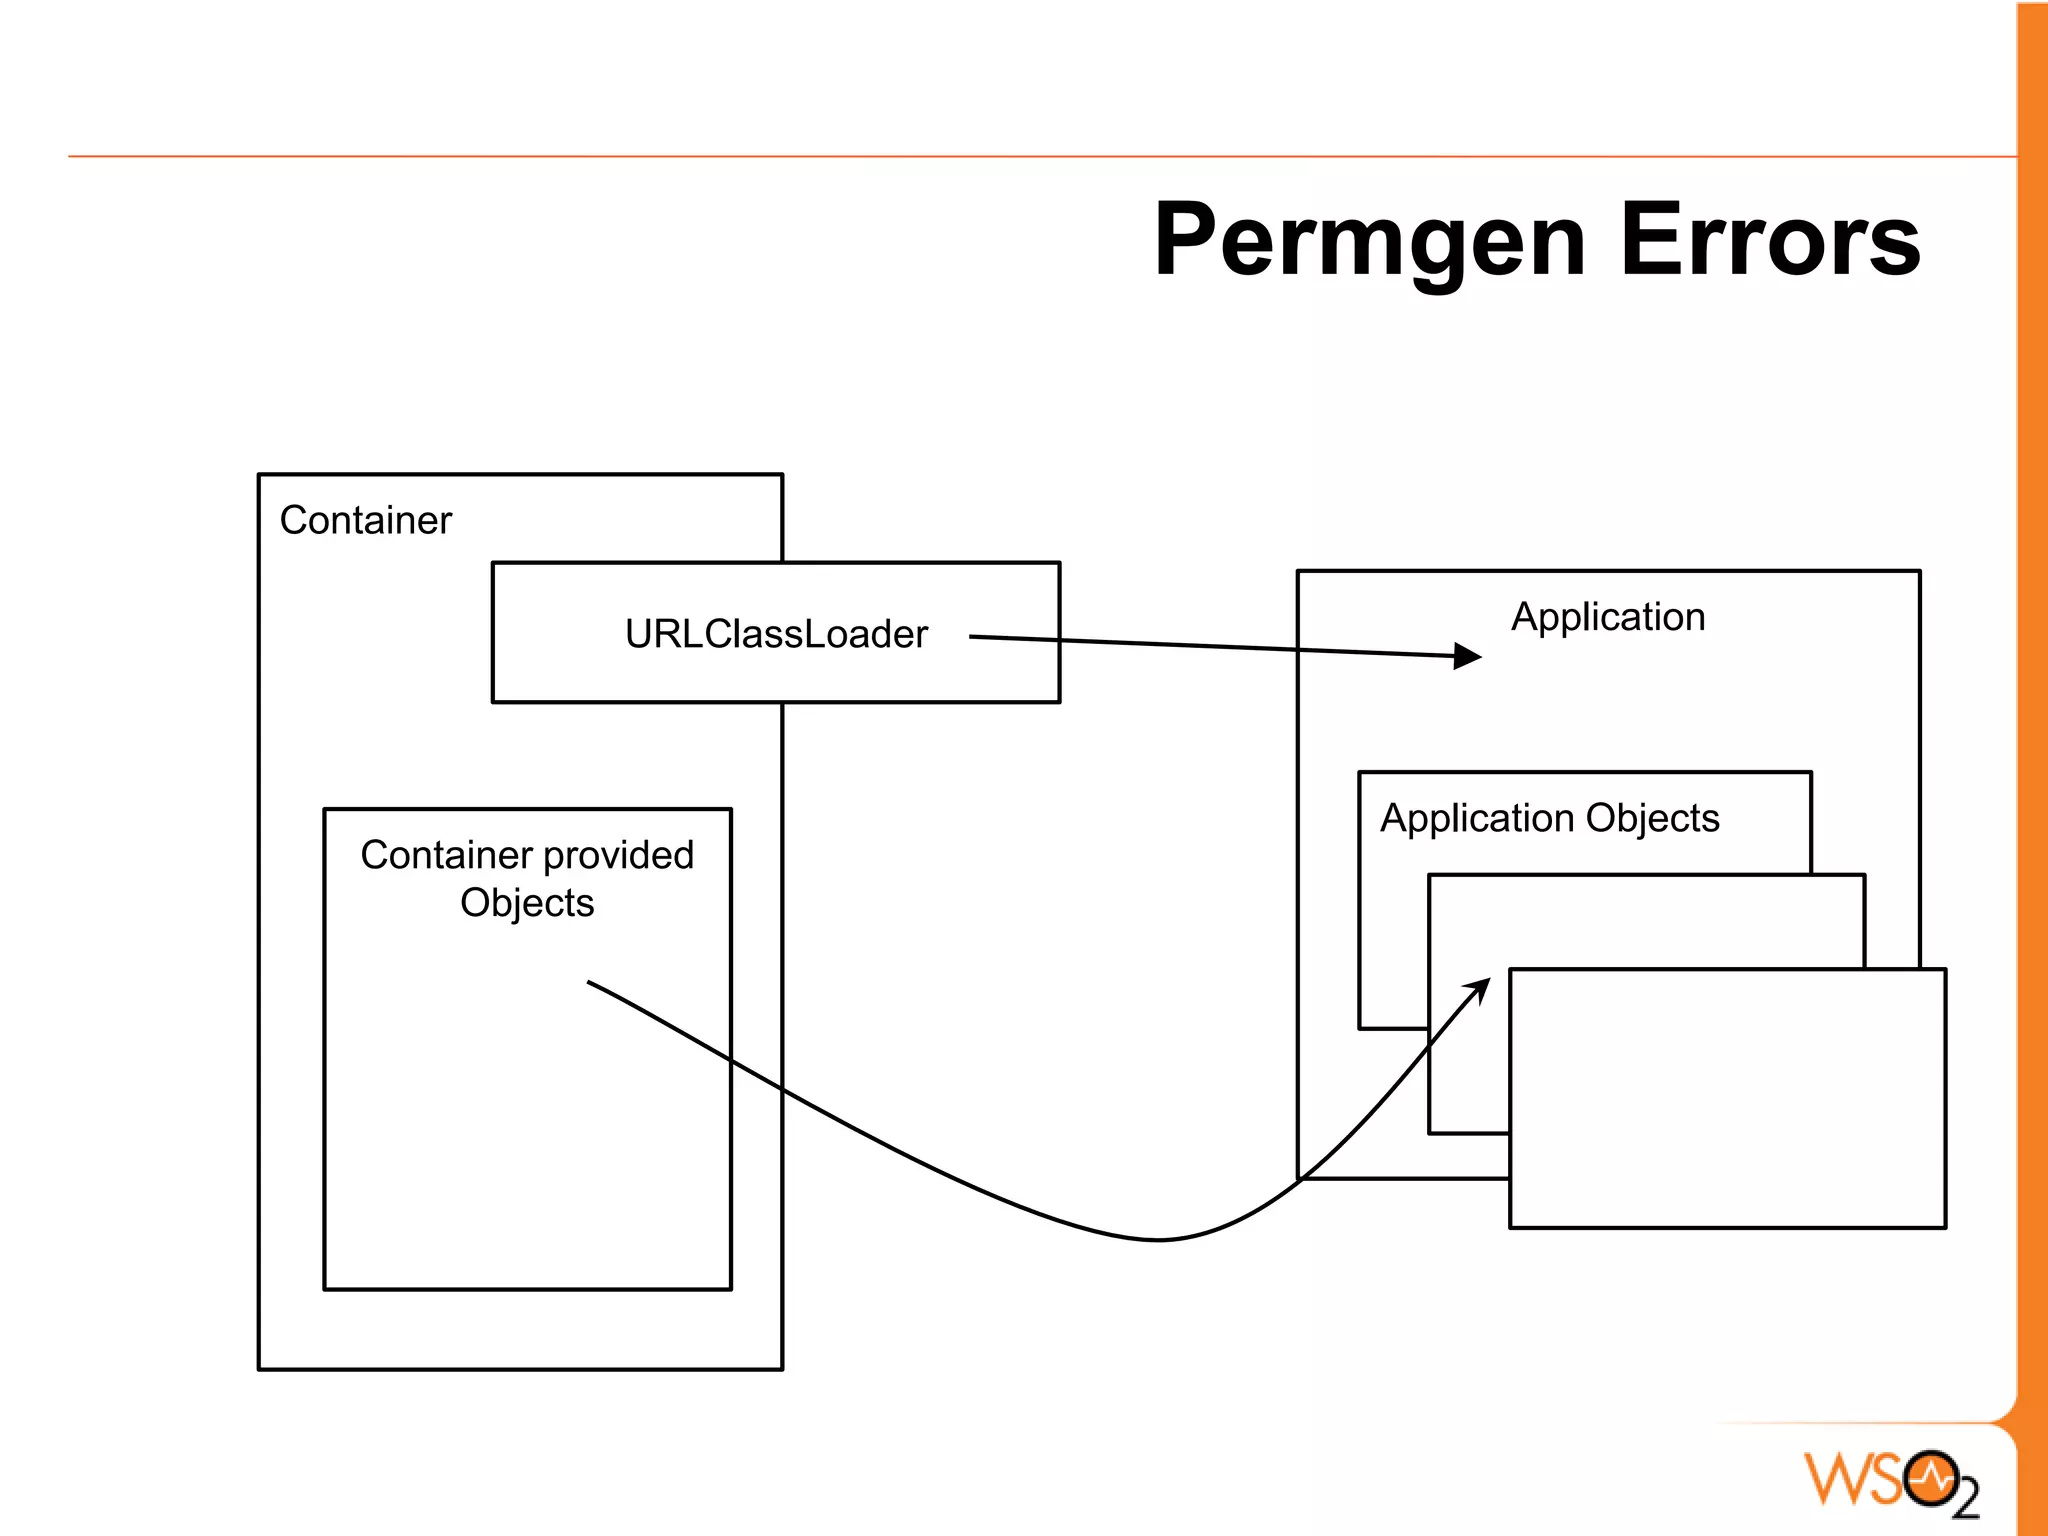
Permgen Errors
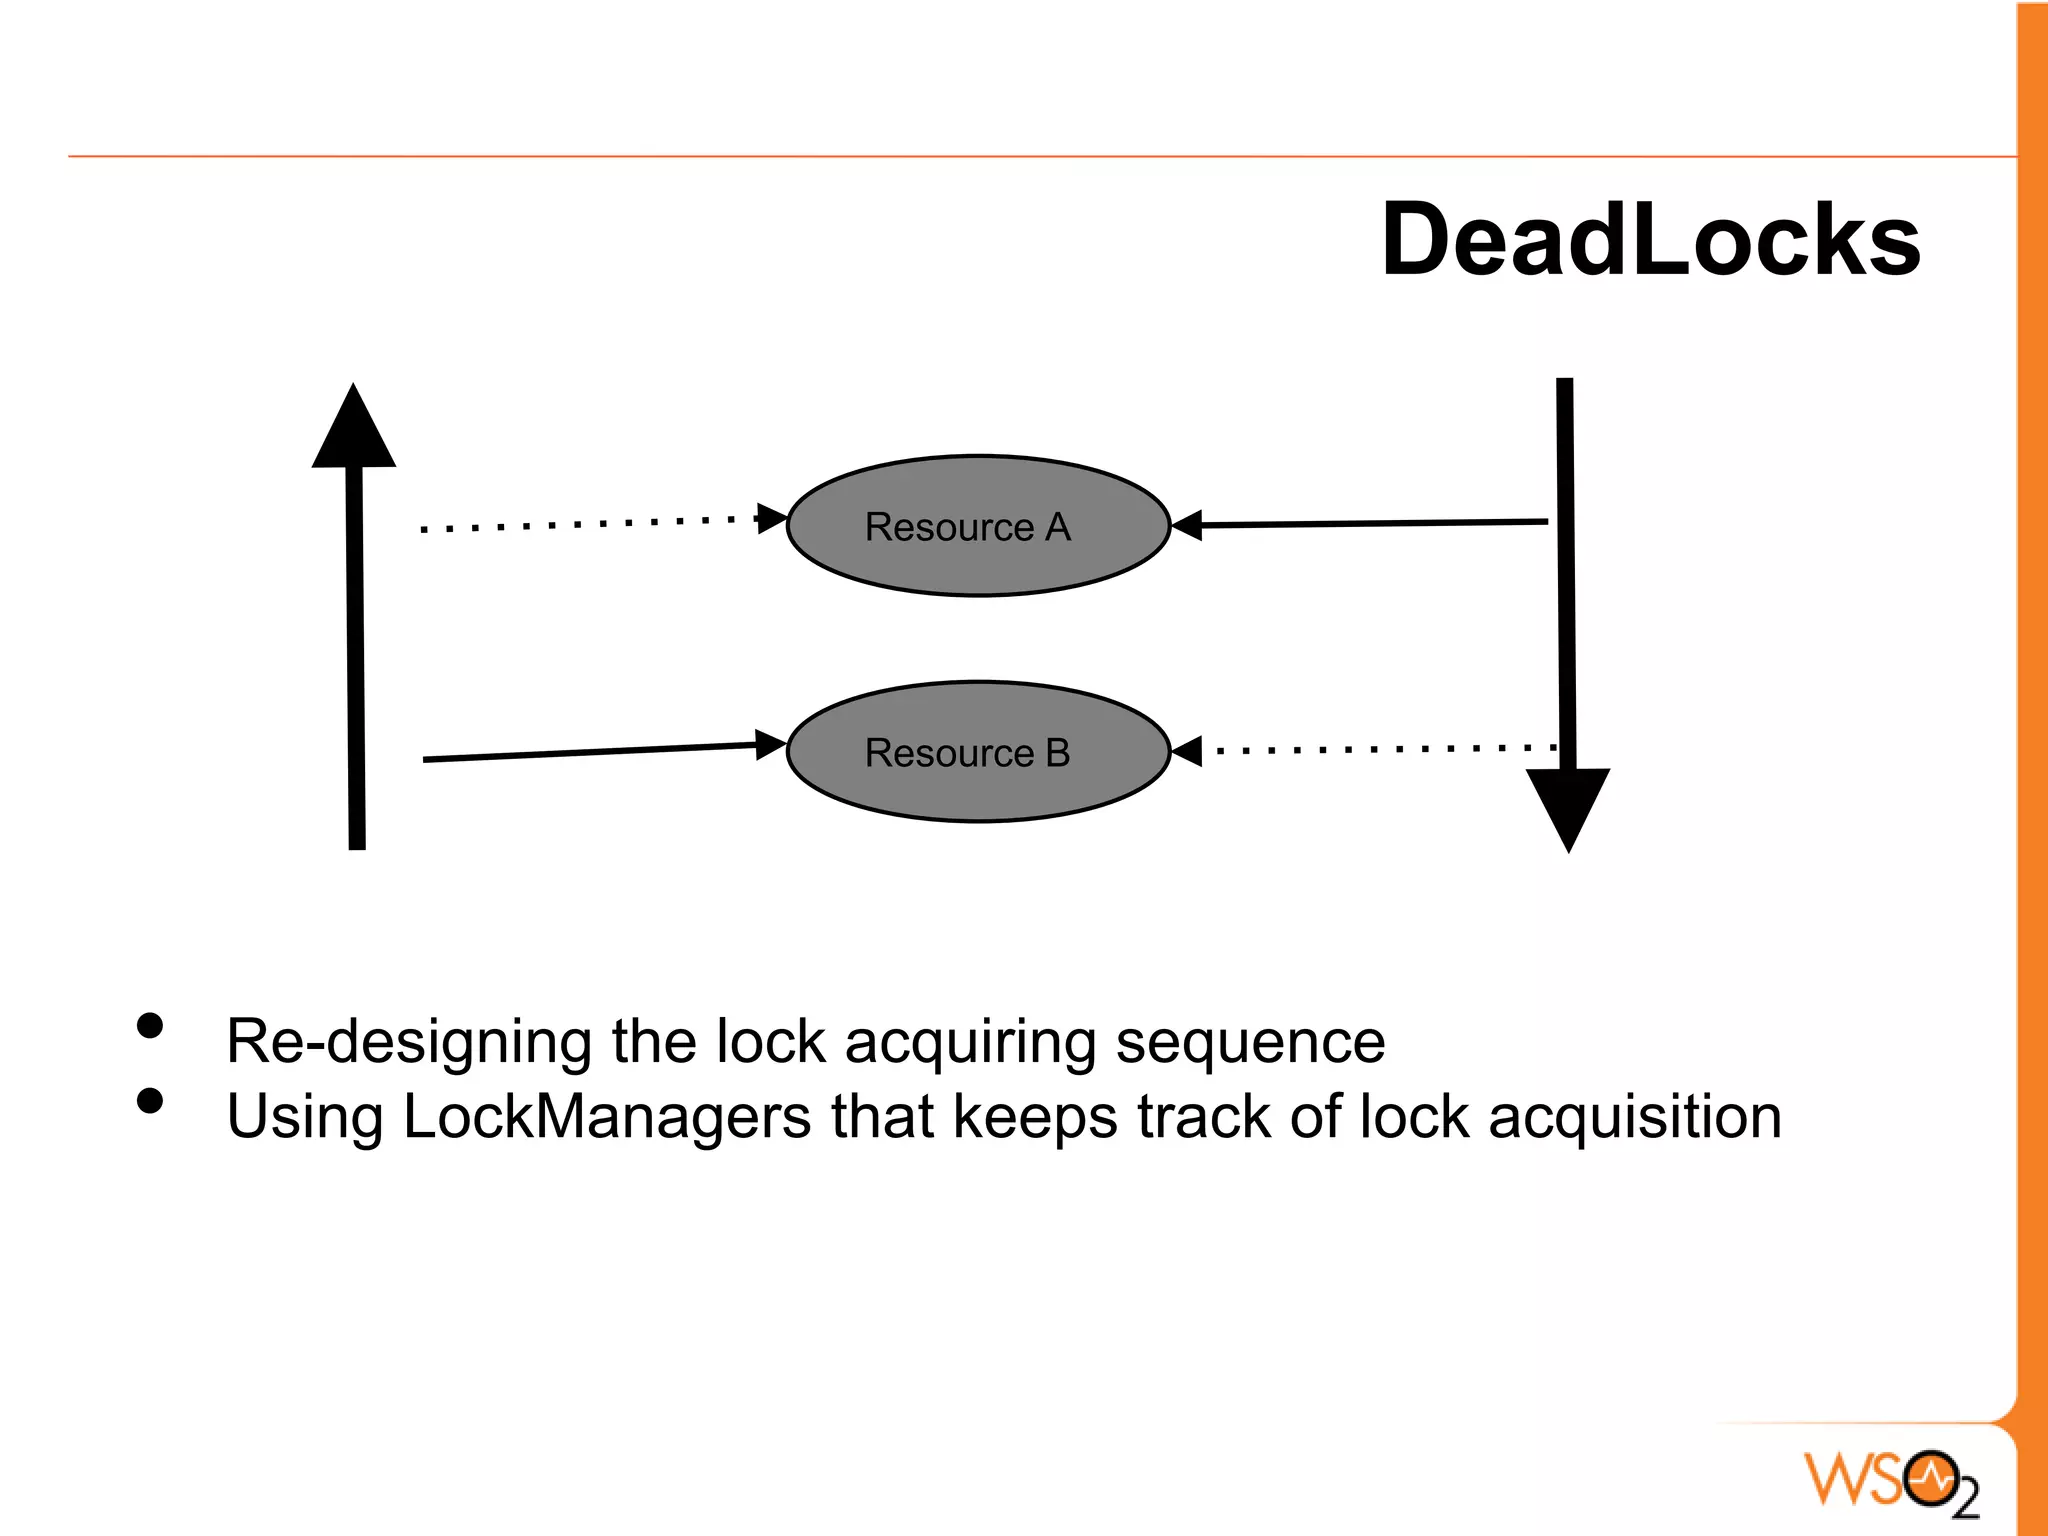
DeadLocks
NullPointer
Unacceptable Latency
CPU spin OutofMemoryException
ArrayIndexOutOfBoundsException
[image] http://www1.free-clipart.net/gallery2/clipart/Holidays/Halloween/Ghost_-_Boo.jpg](https://image.slidesharecdn.com/applicationprofilingformemoryandperformance-130326225102-phpapp02/75/Application-Profiling-for-Memory-and-Performance-9-2048.jpg)
![Right Tools...
• There are many commercial and open source tools
• We are going to use,
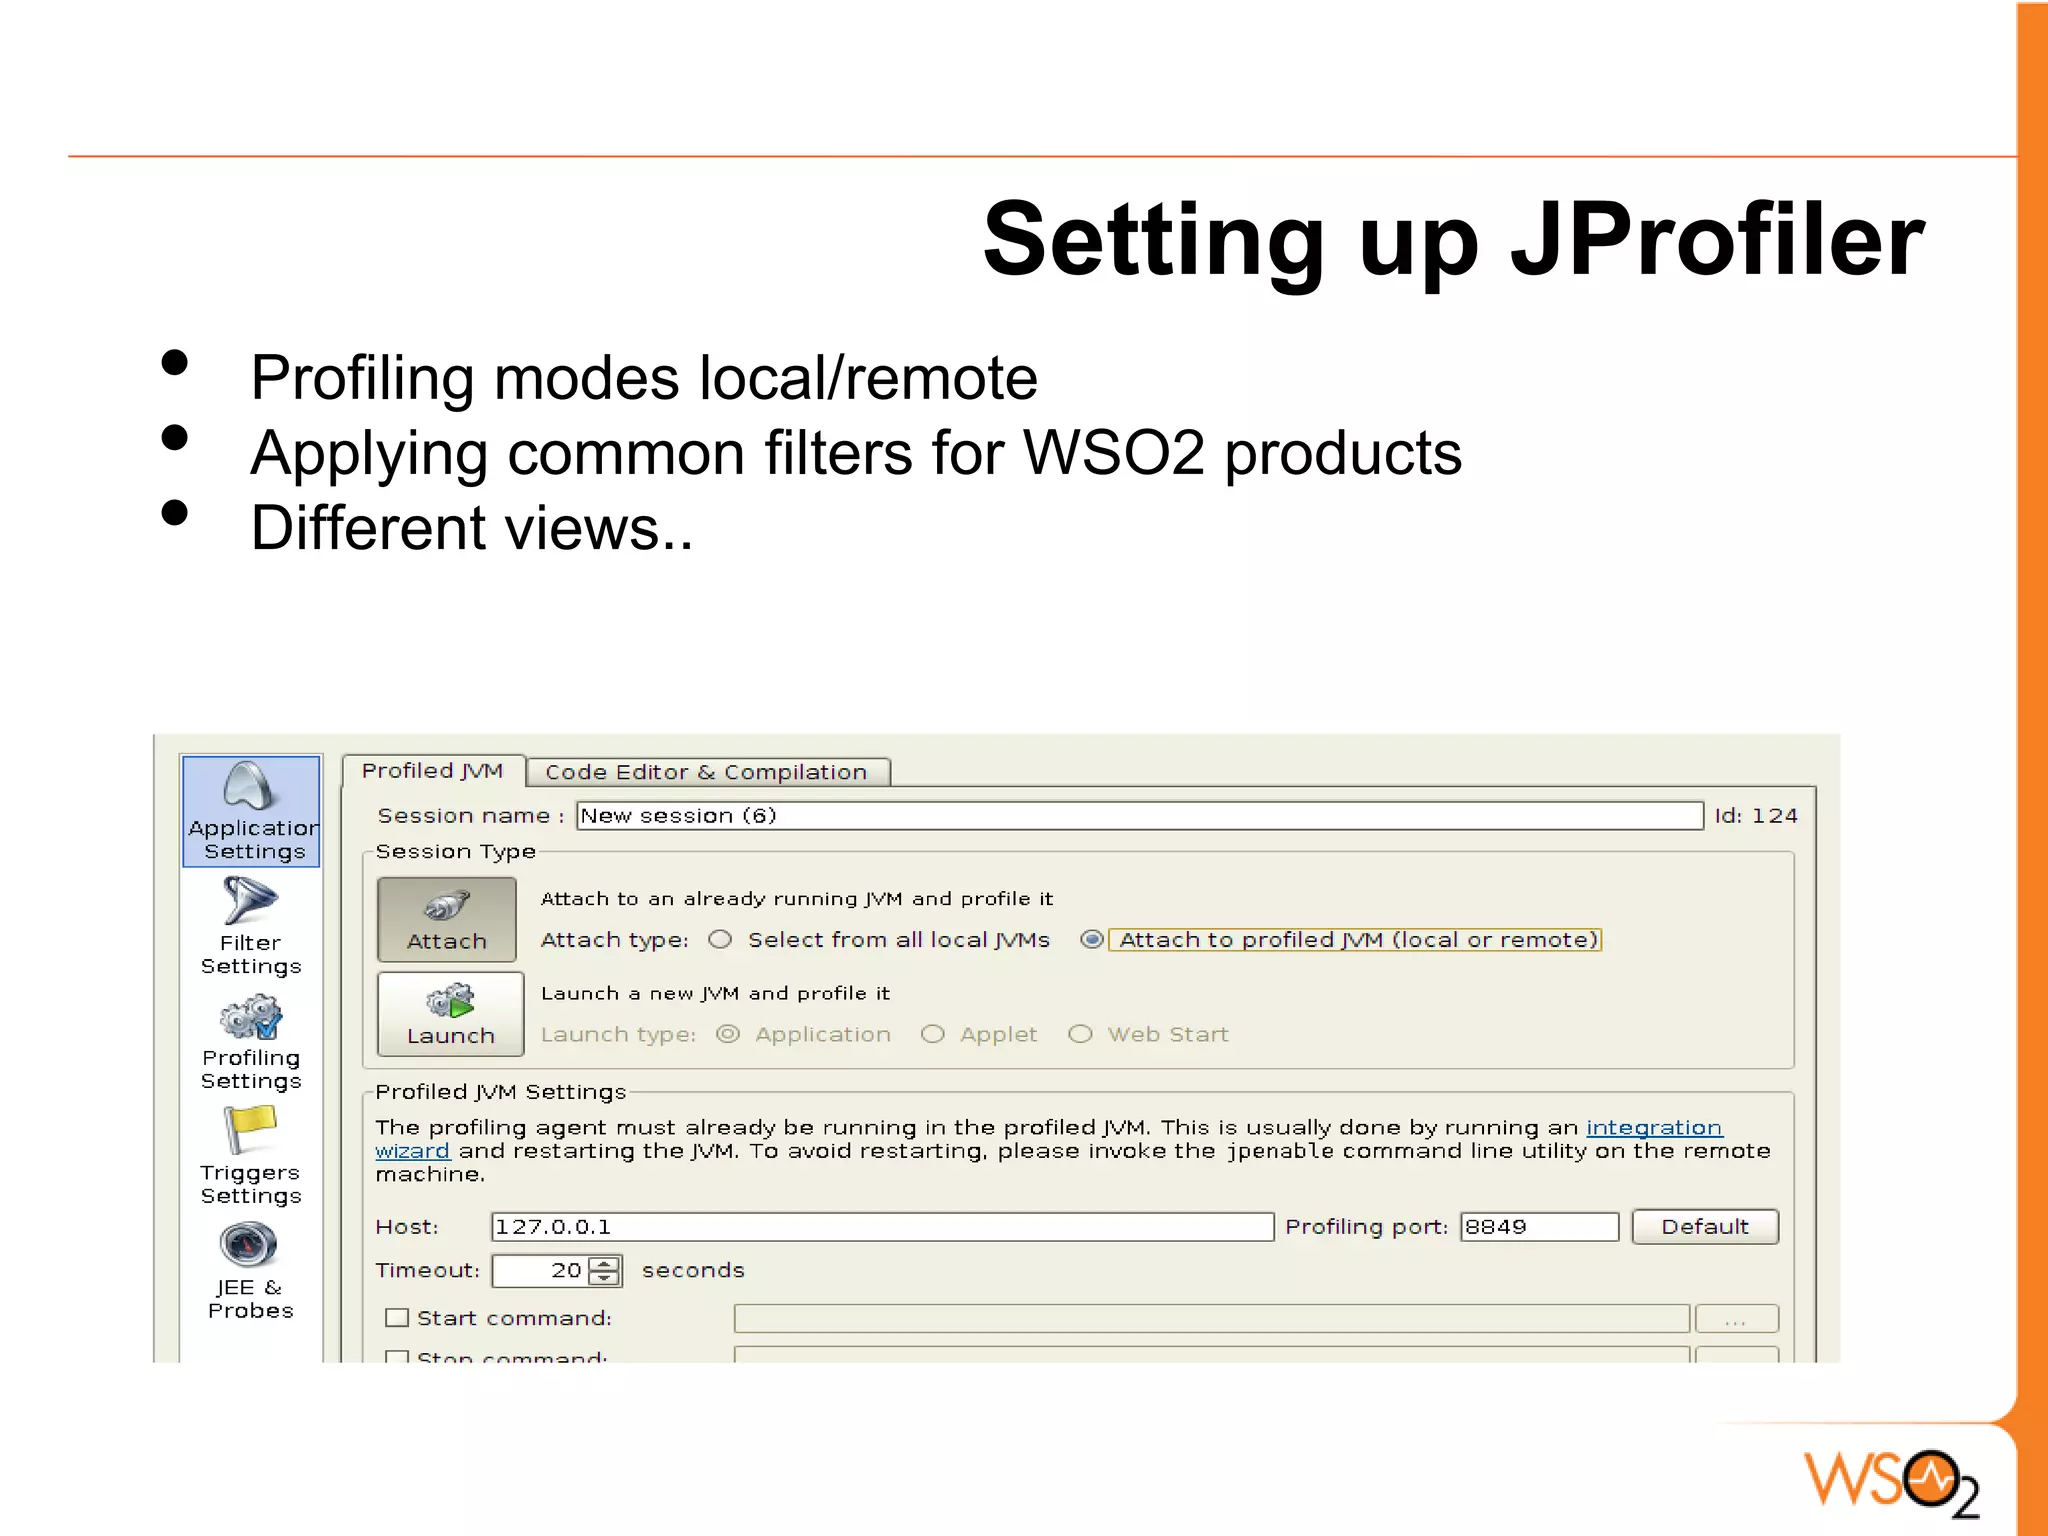
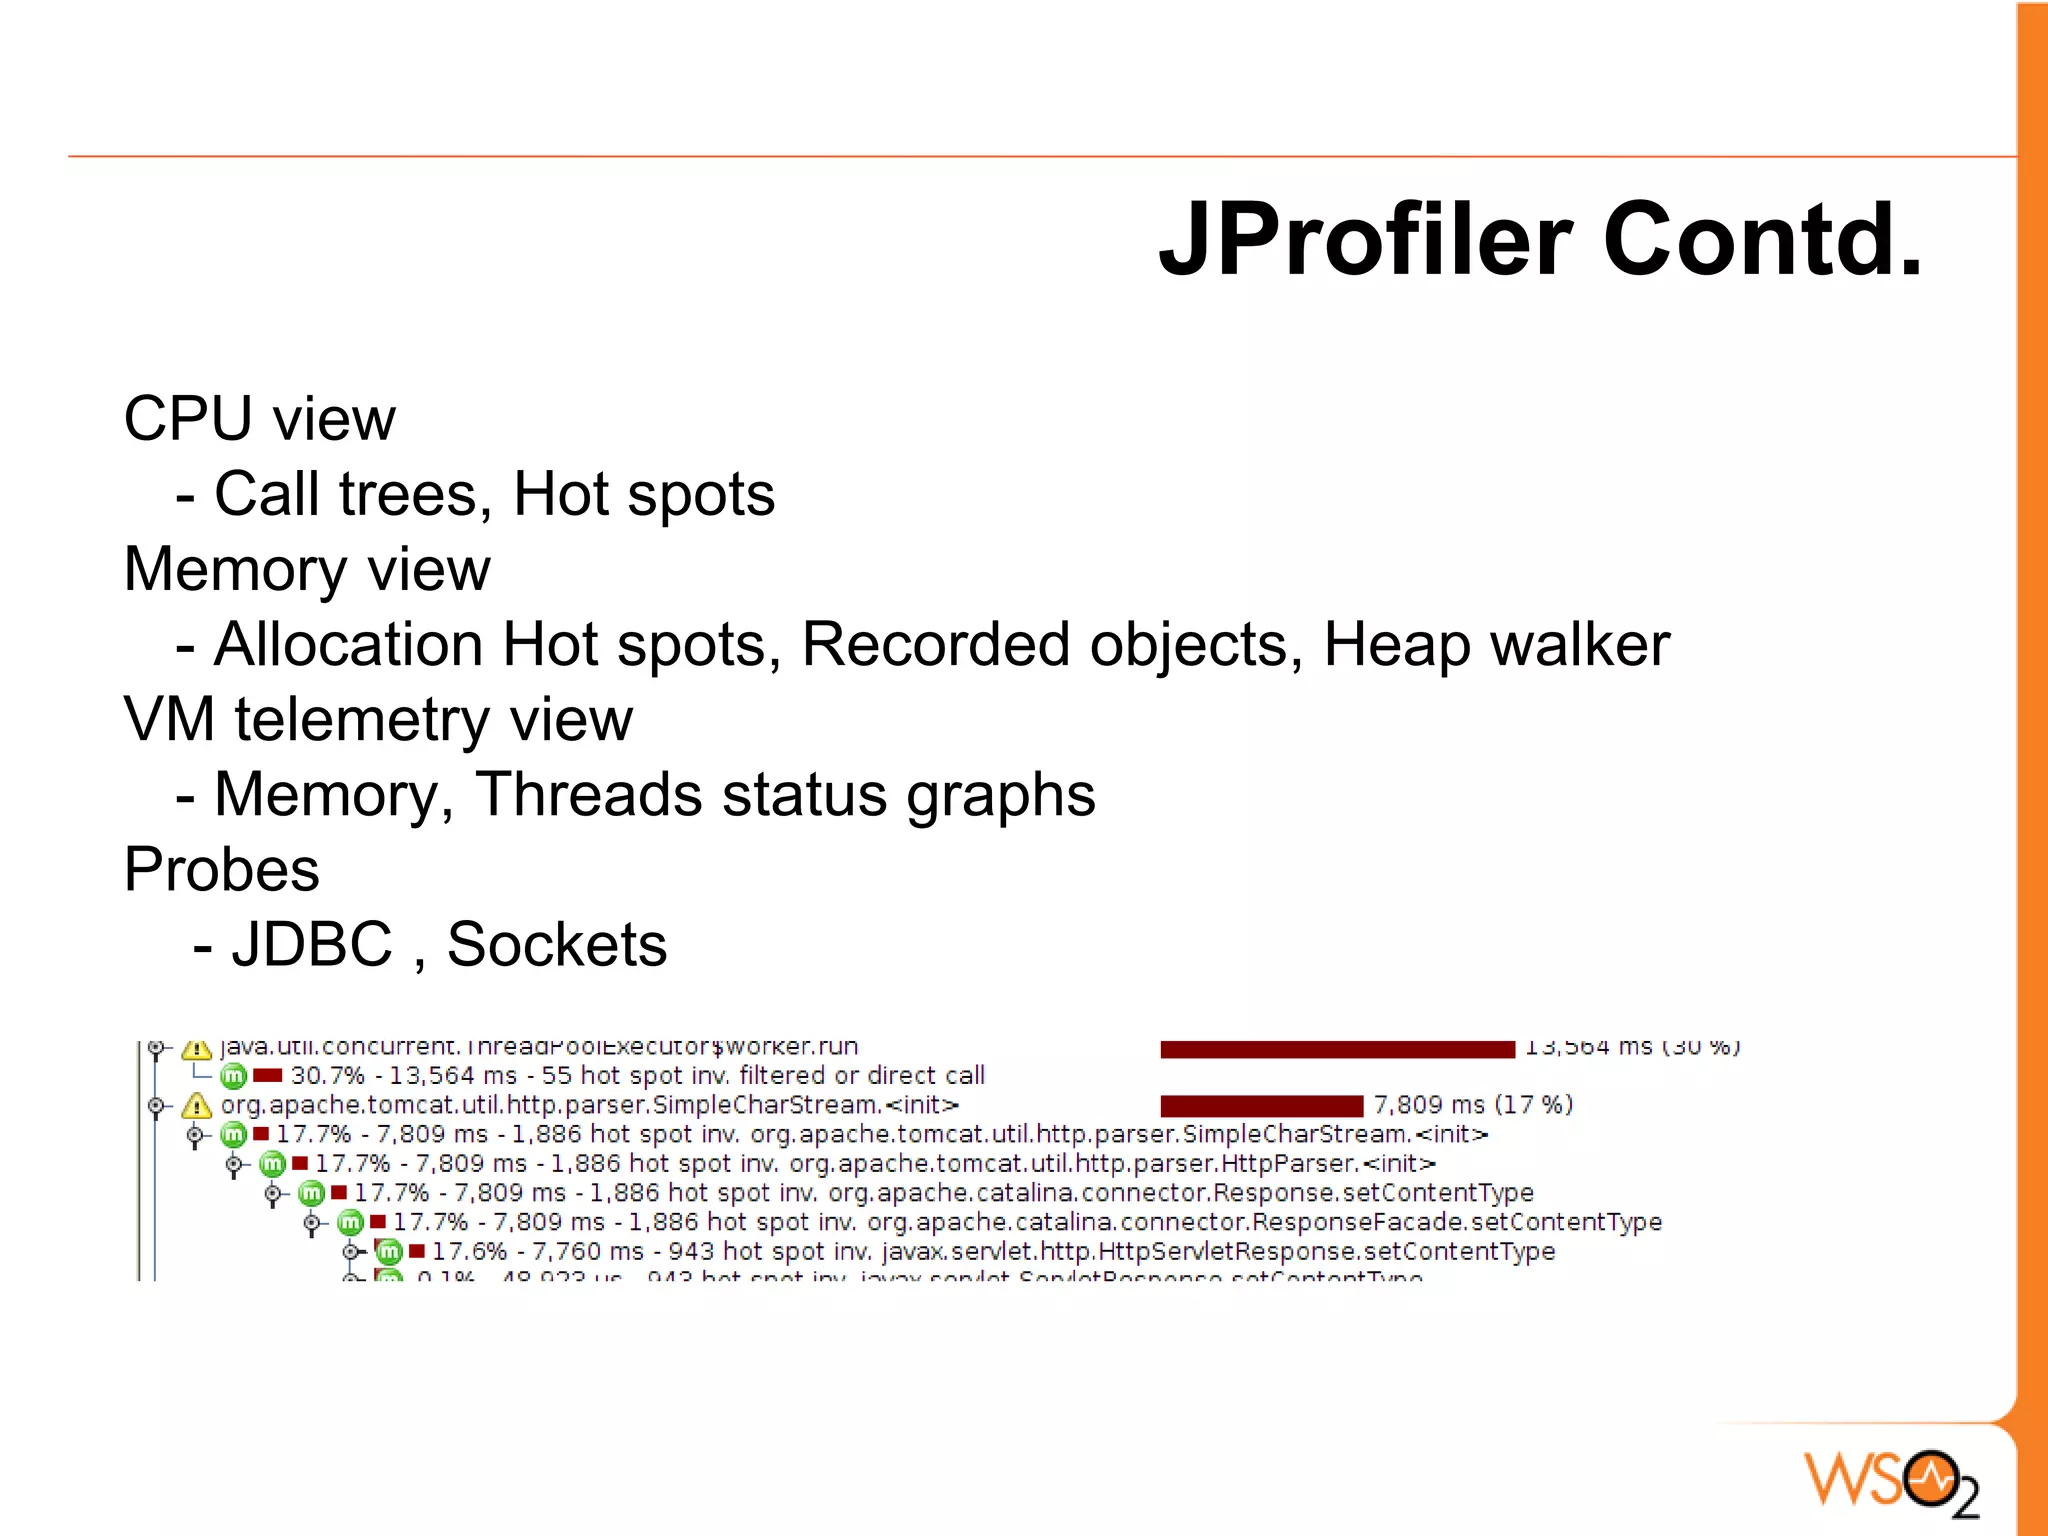
o Jprofiler by ejTechnologies
CPU, Memory, Allocation, Network, DB
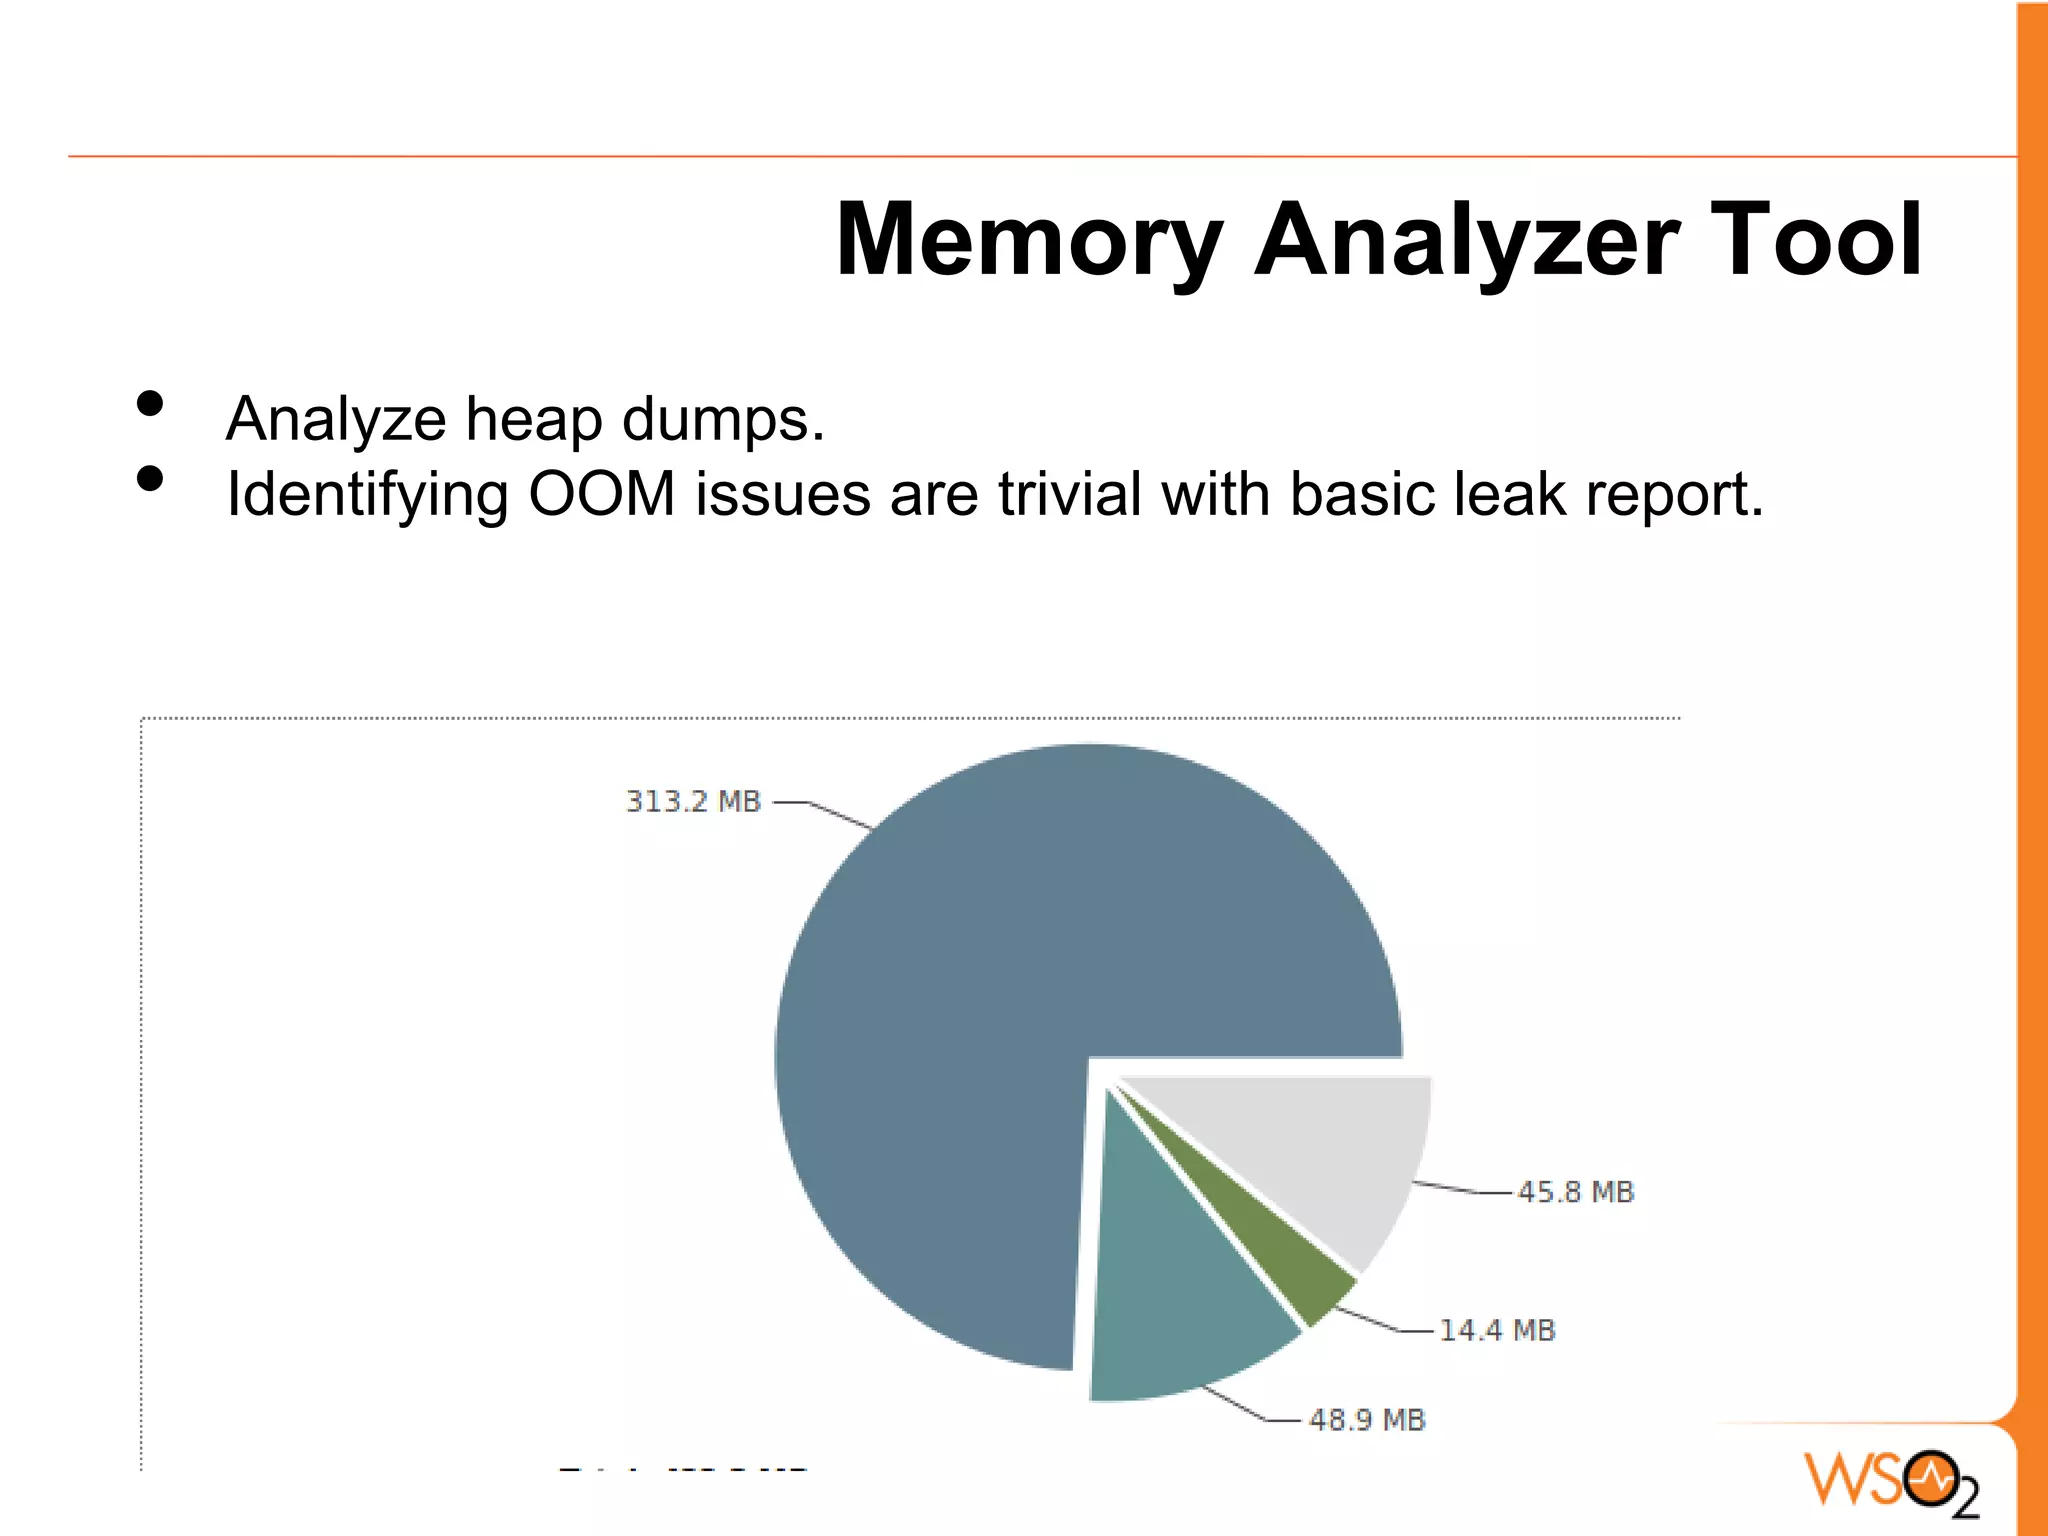
o Eclipse Memory Analyzer tool
Find memory leaks
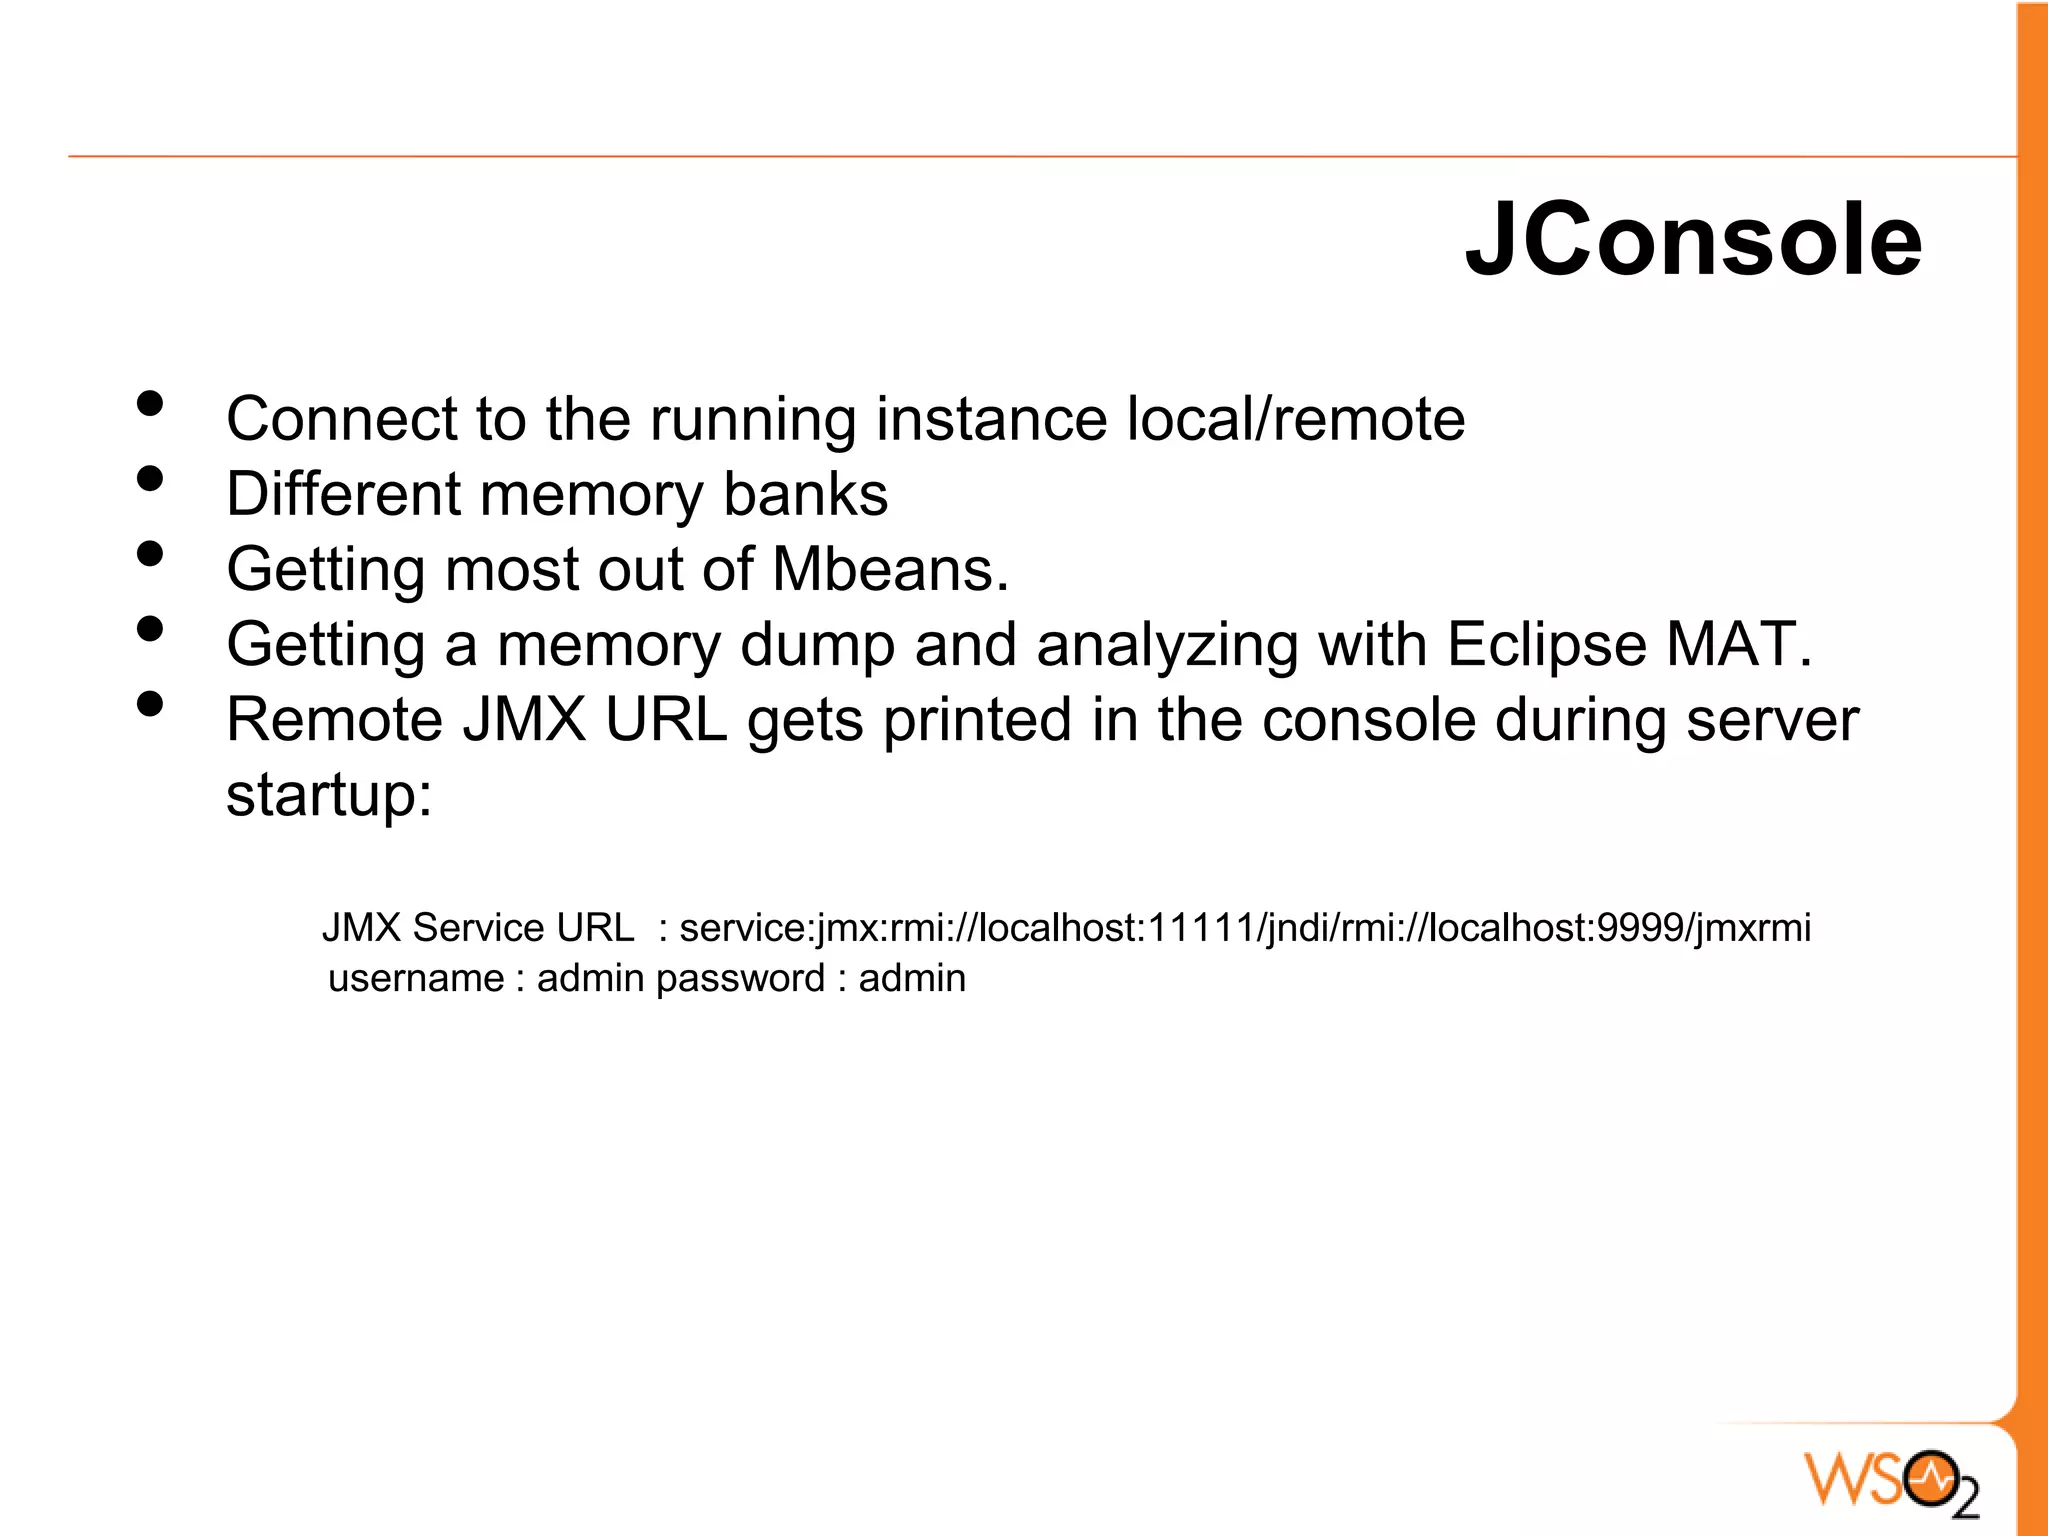
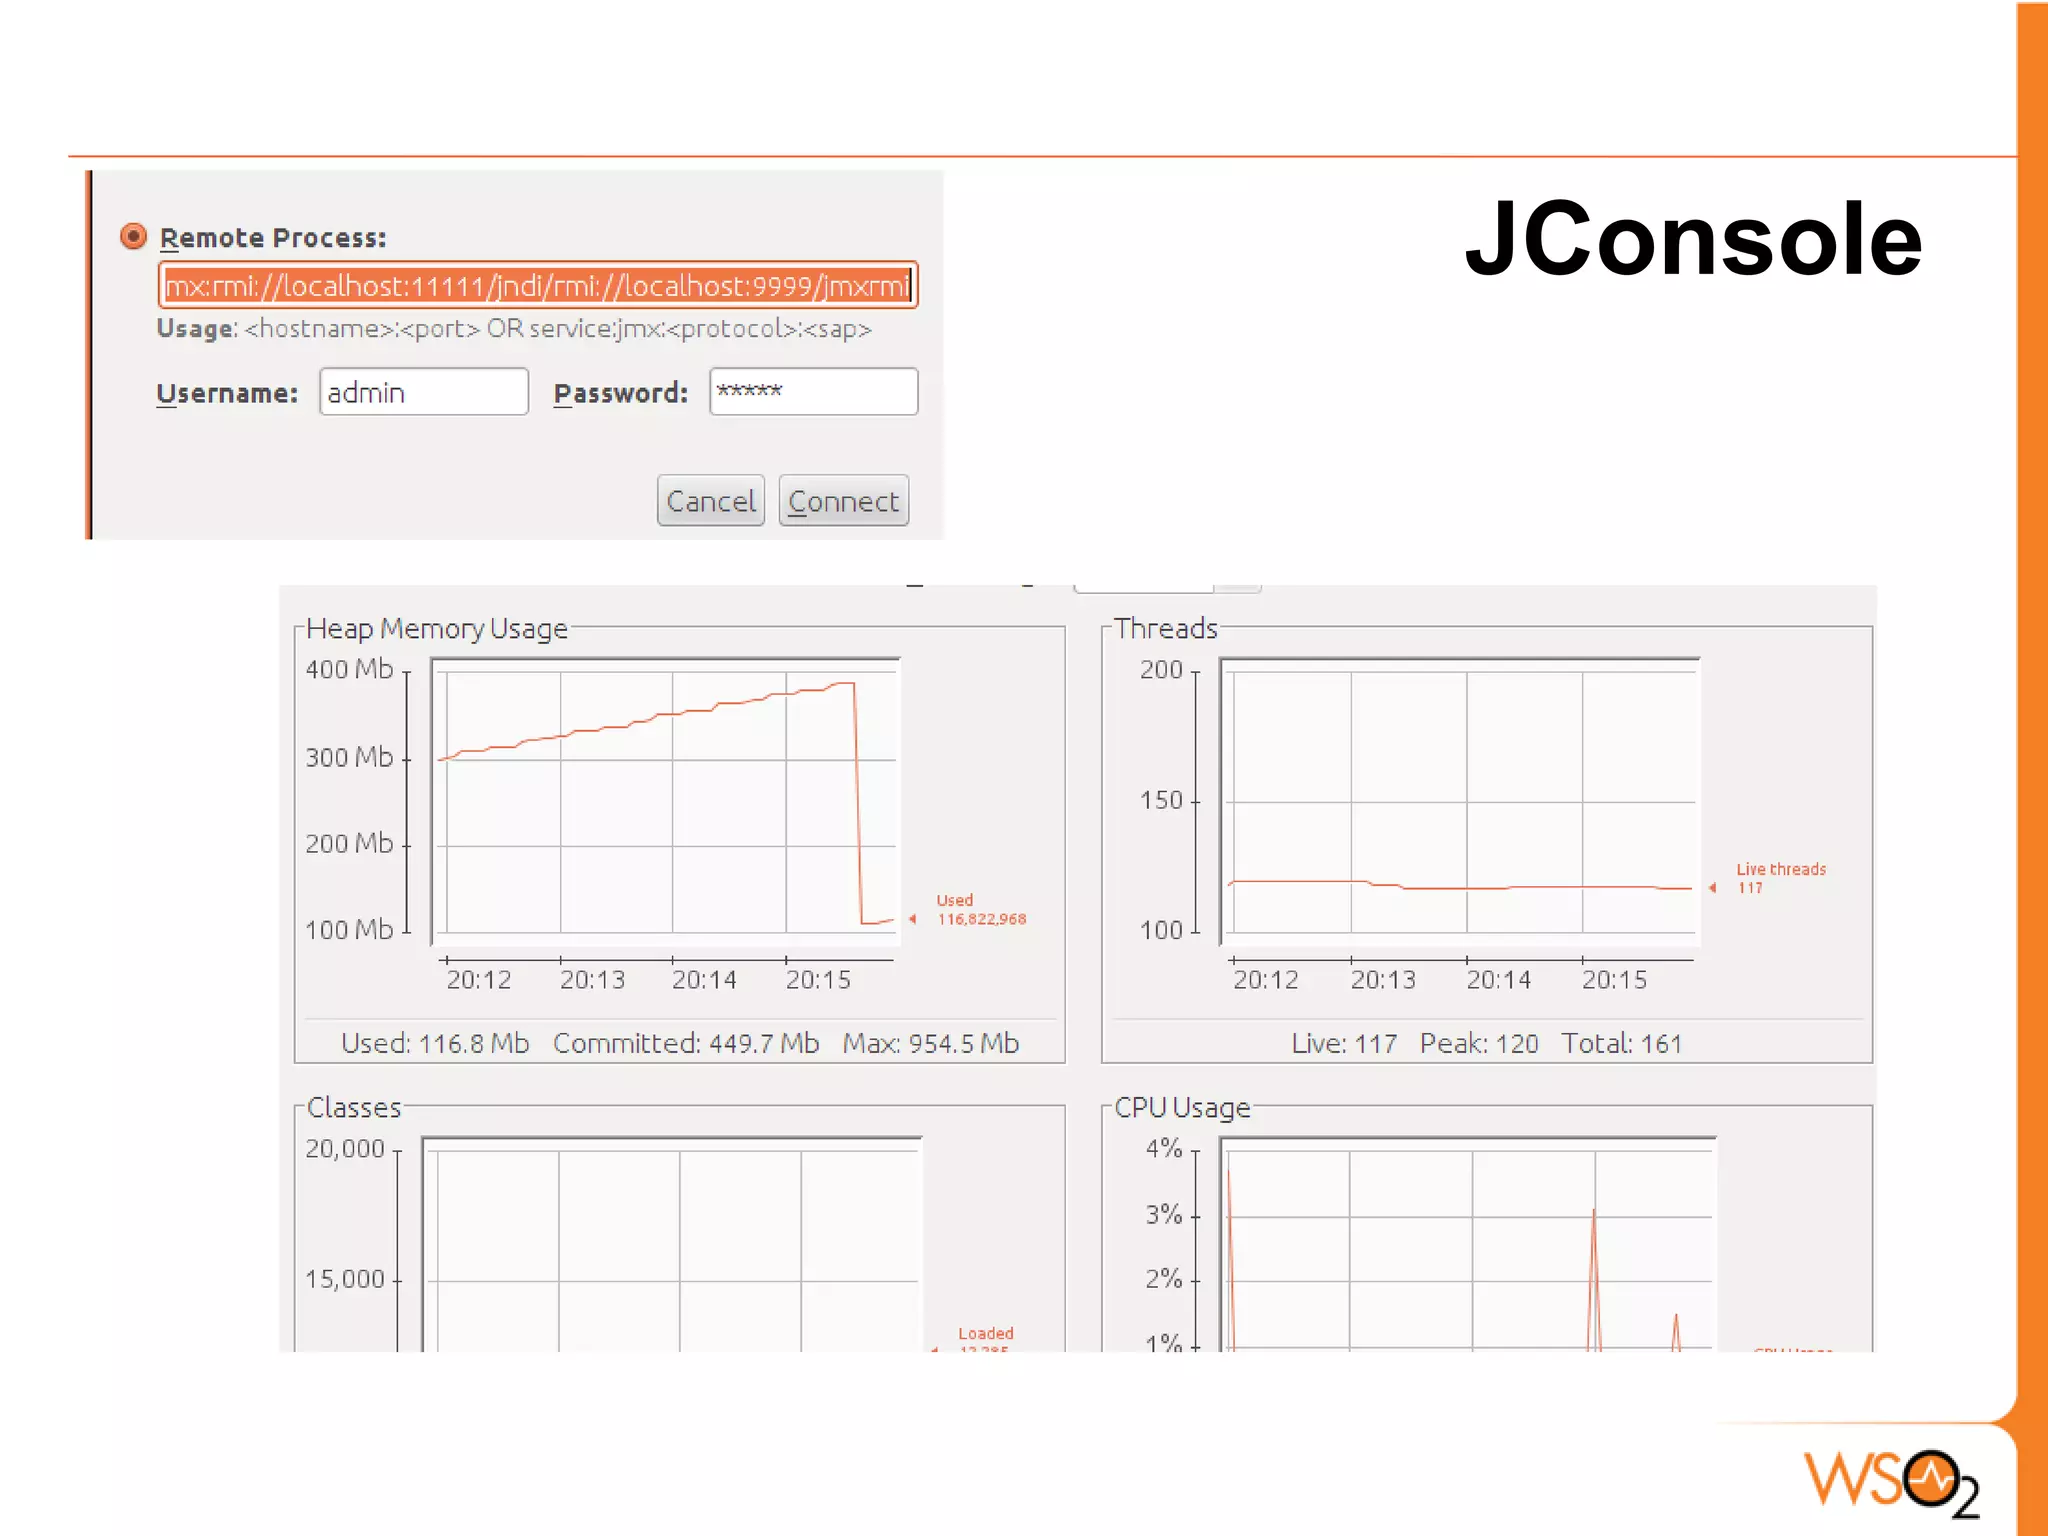
o Standard JDK tooling - Jconsole
Basic stats
[image] http://writingsongs.com/pictures/toolbox.jpg](https://image.slidesharecdn.com/applicationprofilingformemoryandperformance-130326225102-phpapp02/75/Application-Profiling-for-Memory-and-Performance-11-2048.jpg)

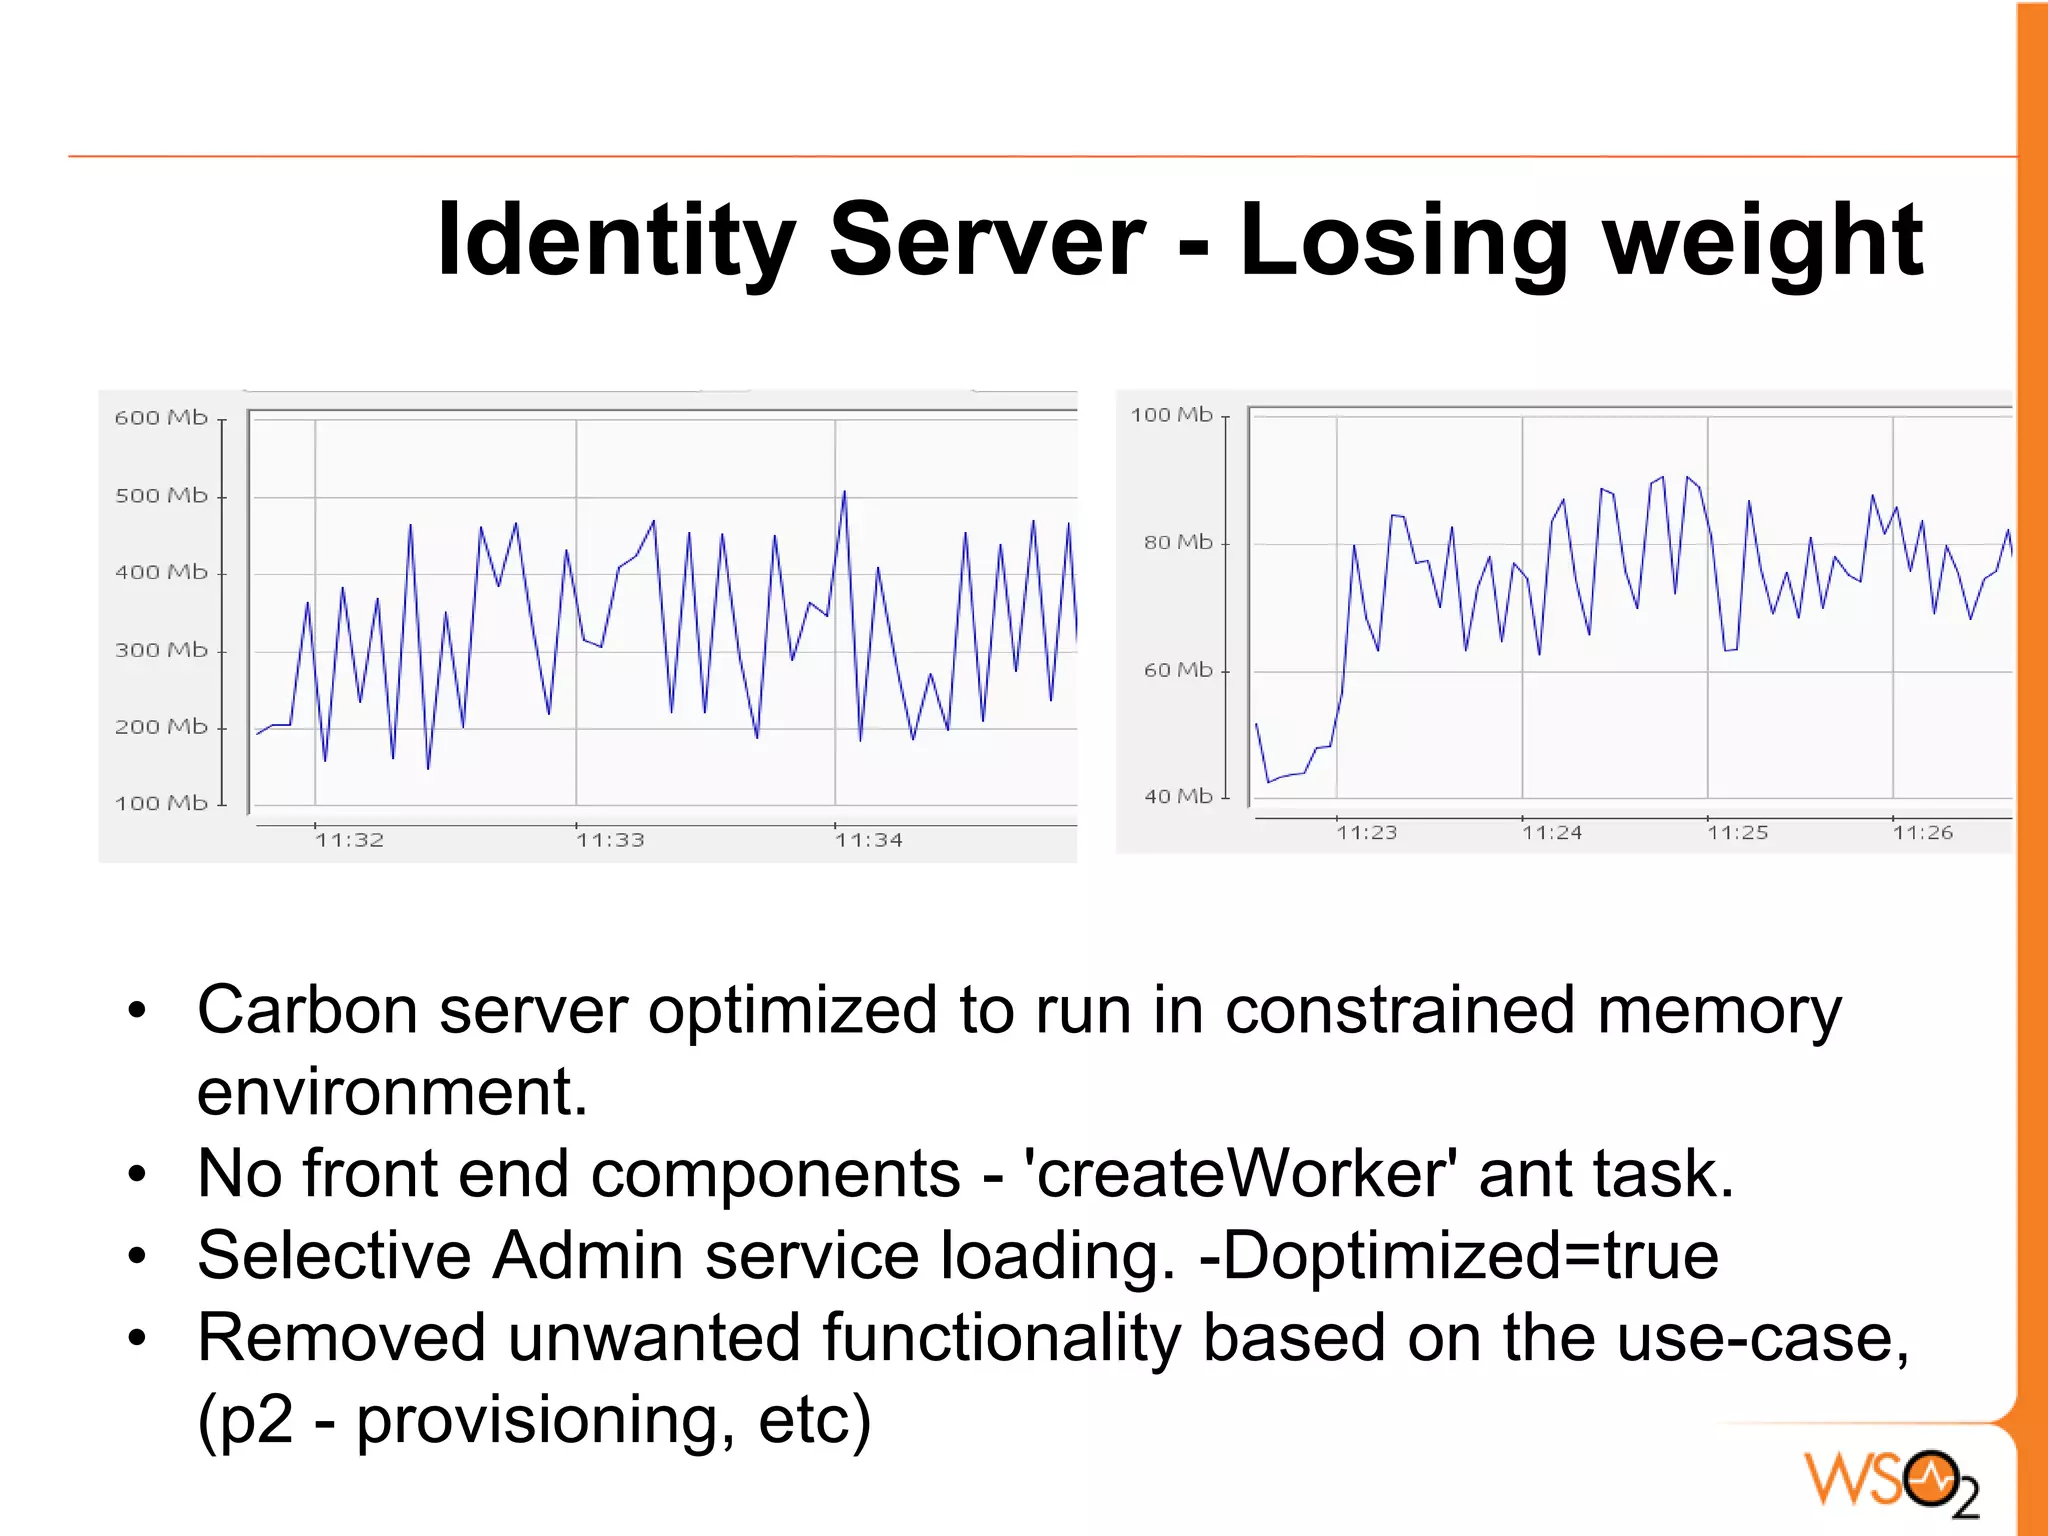
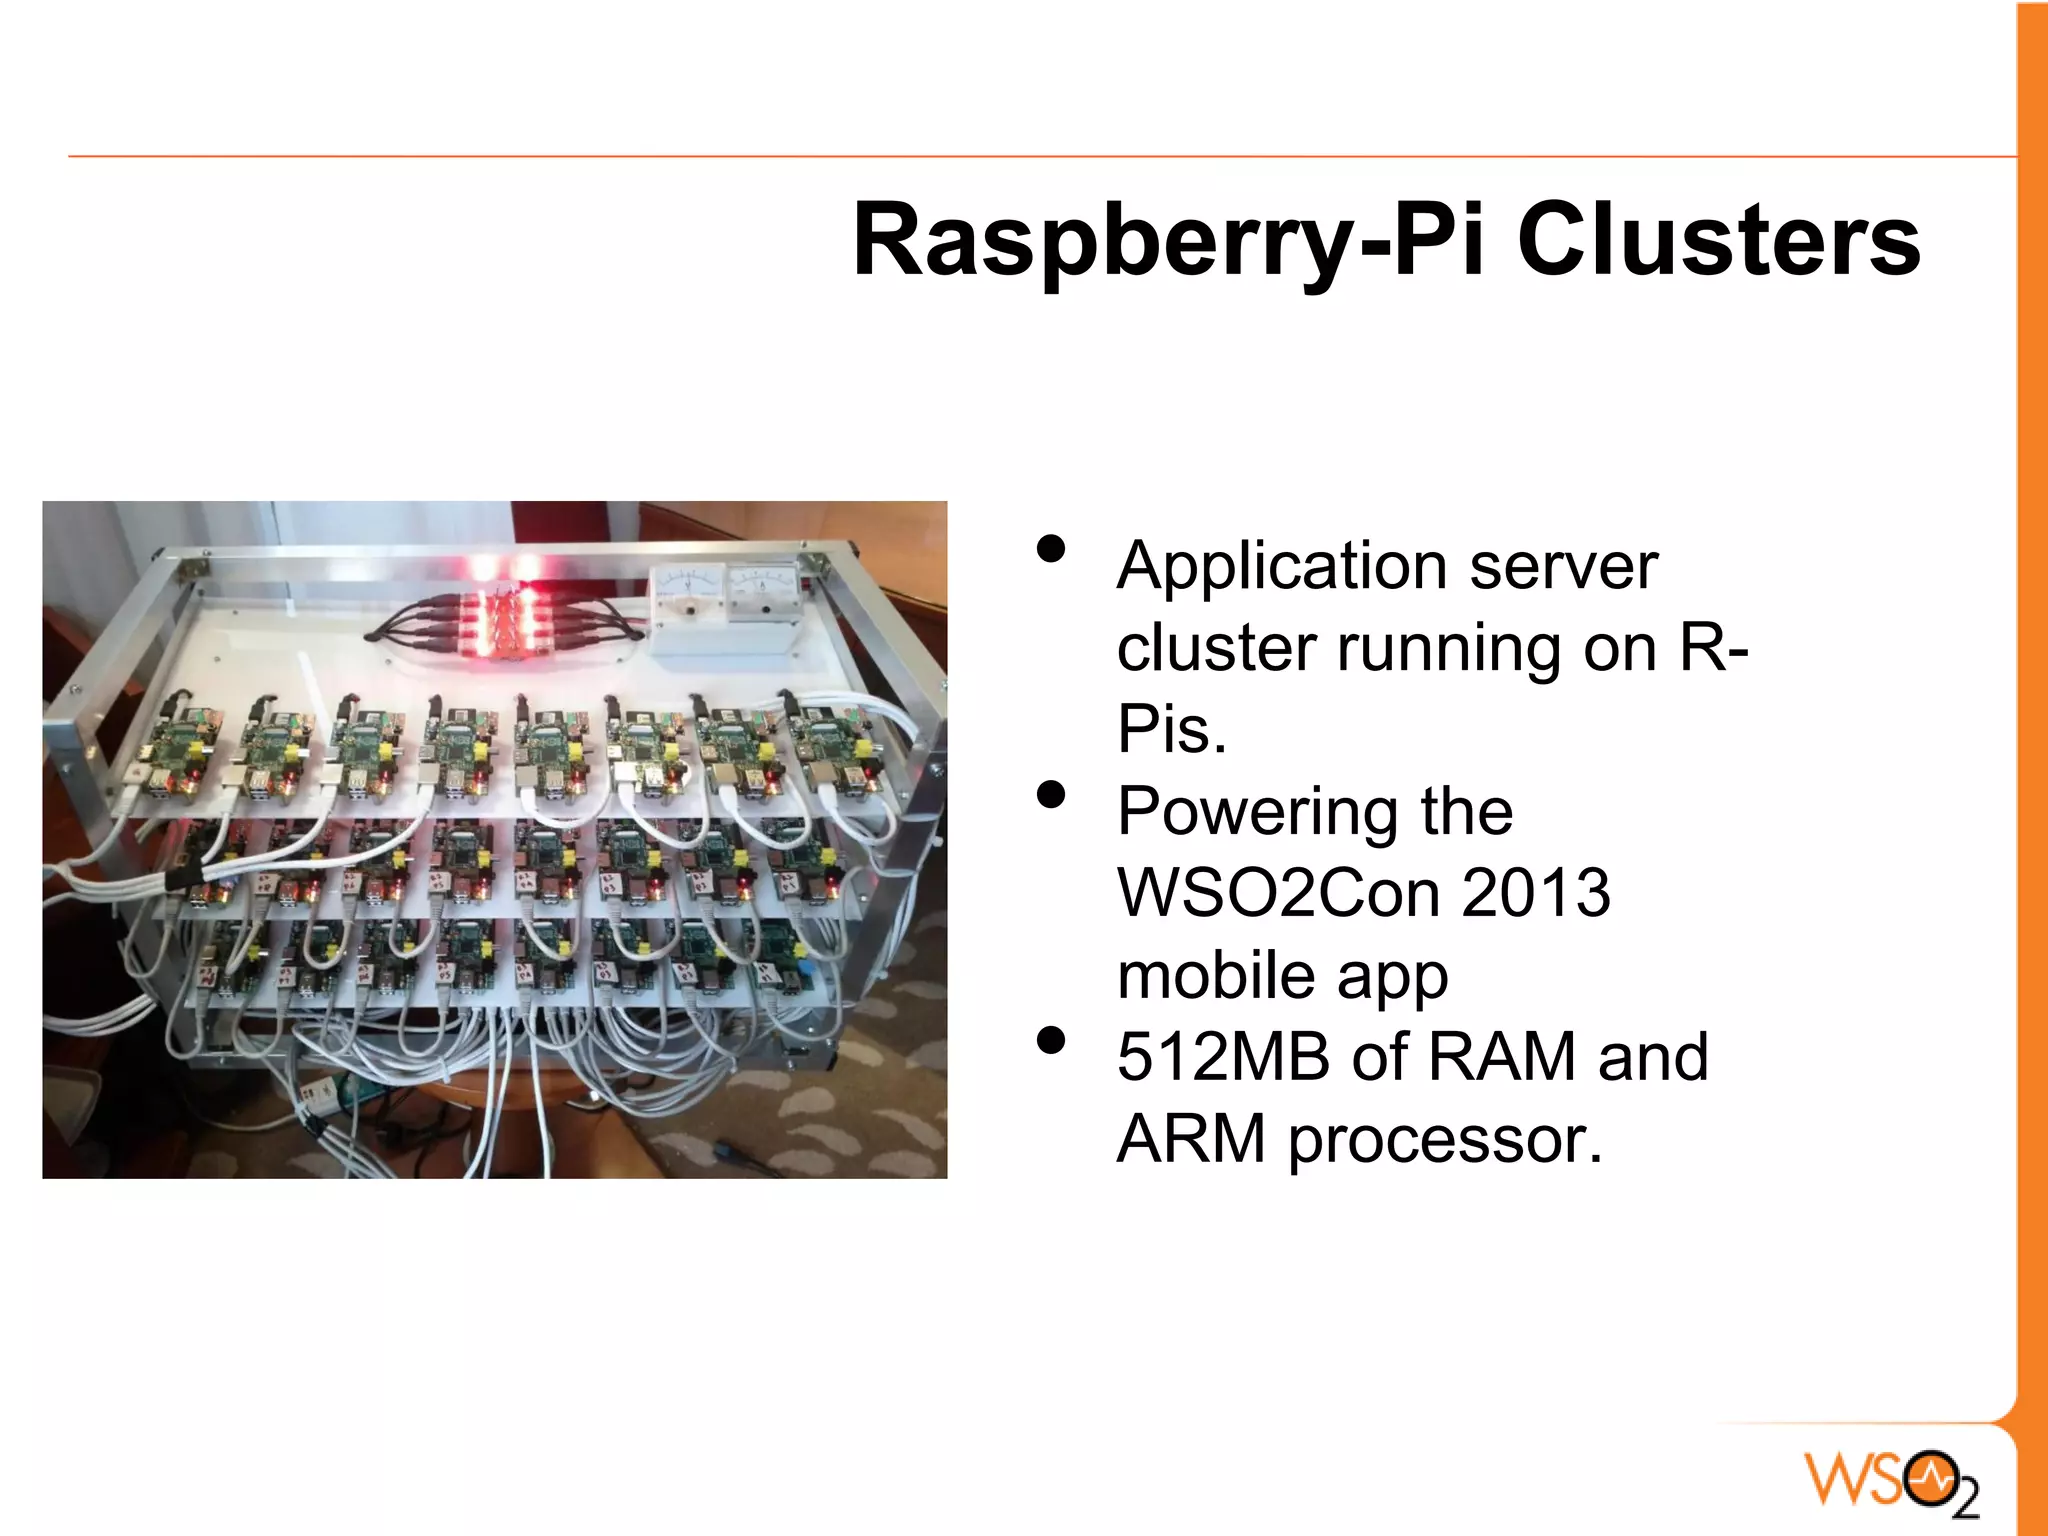

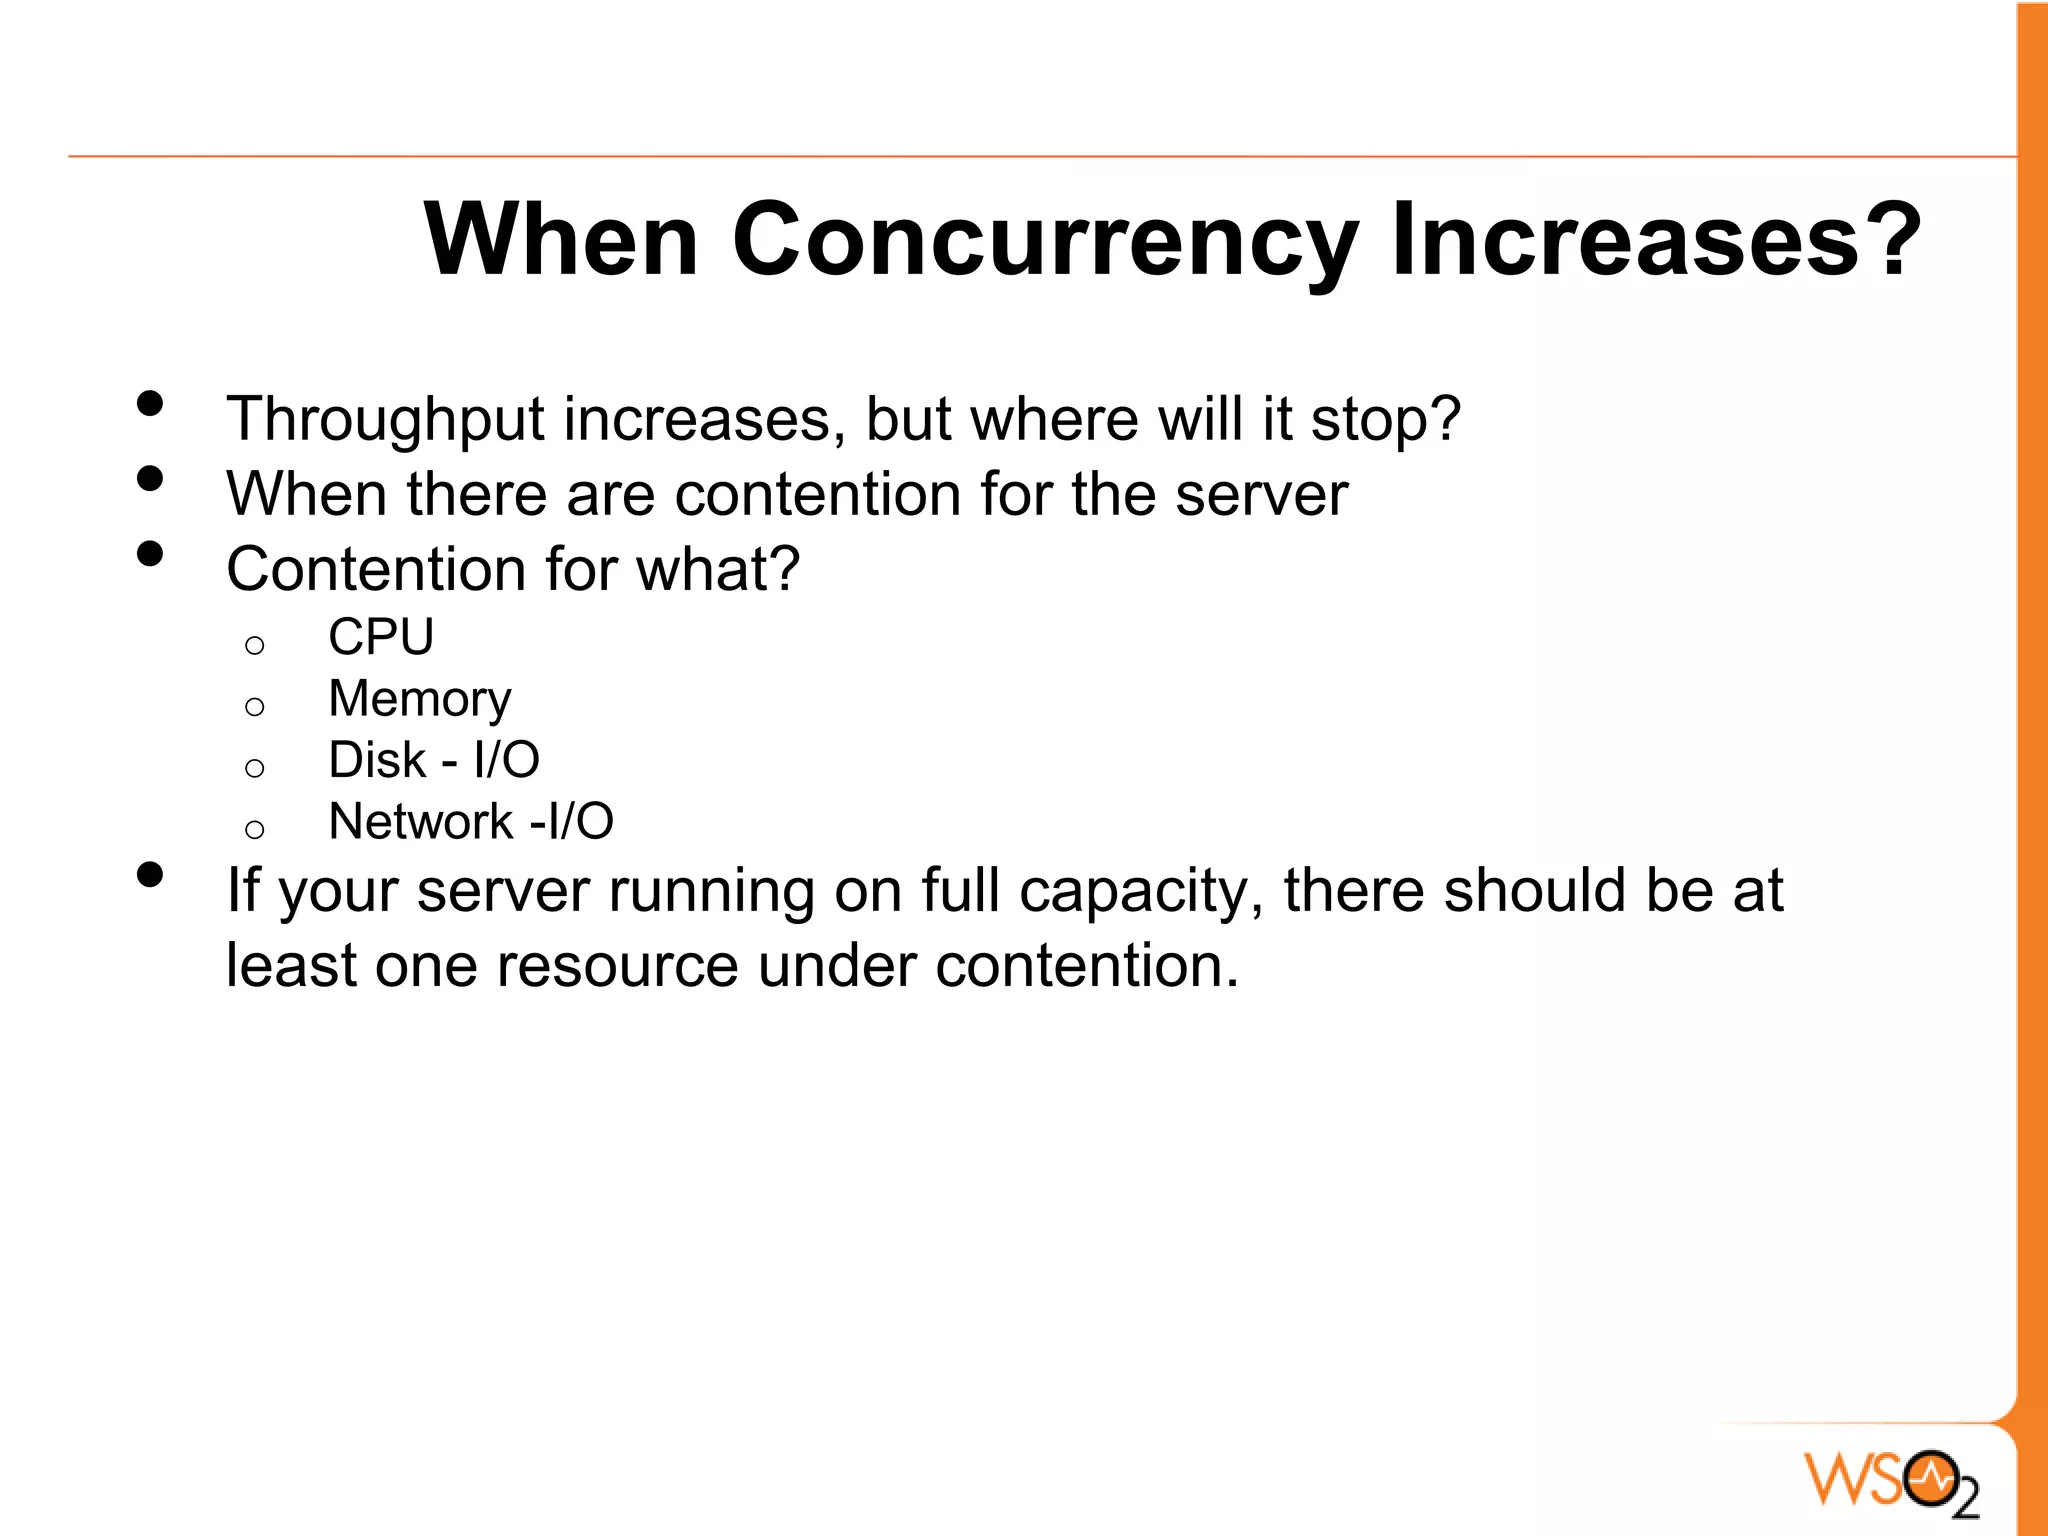
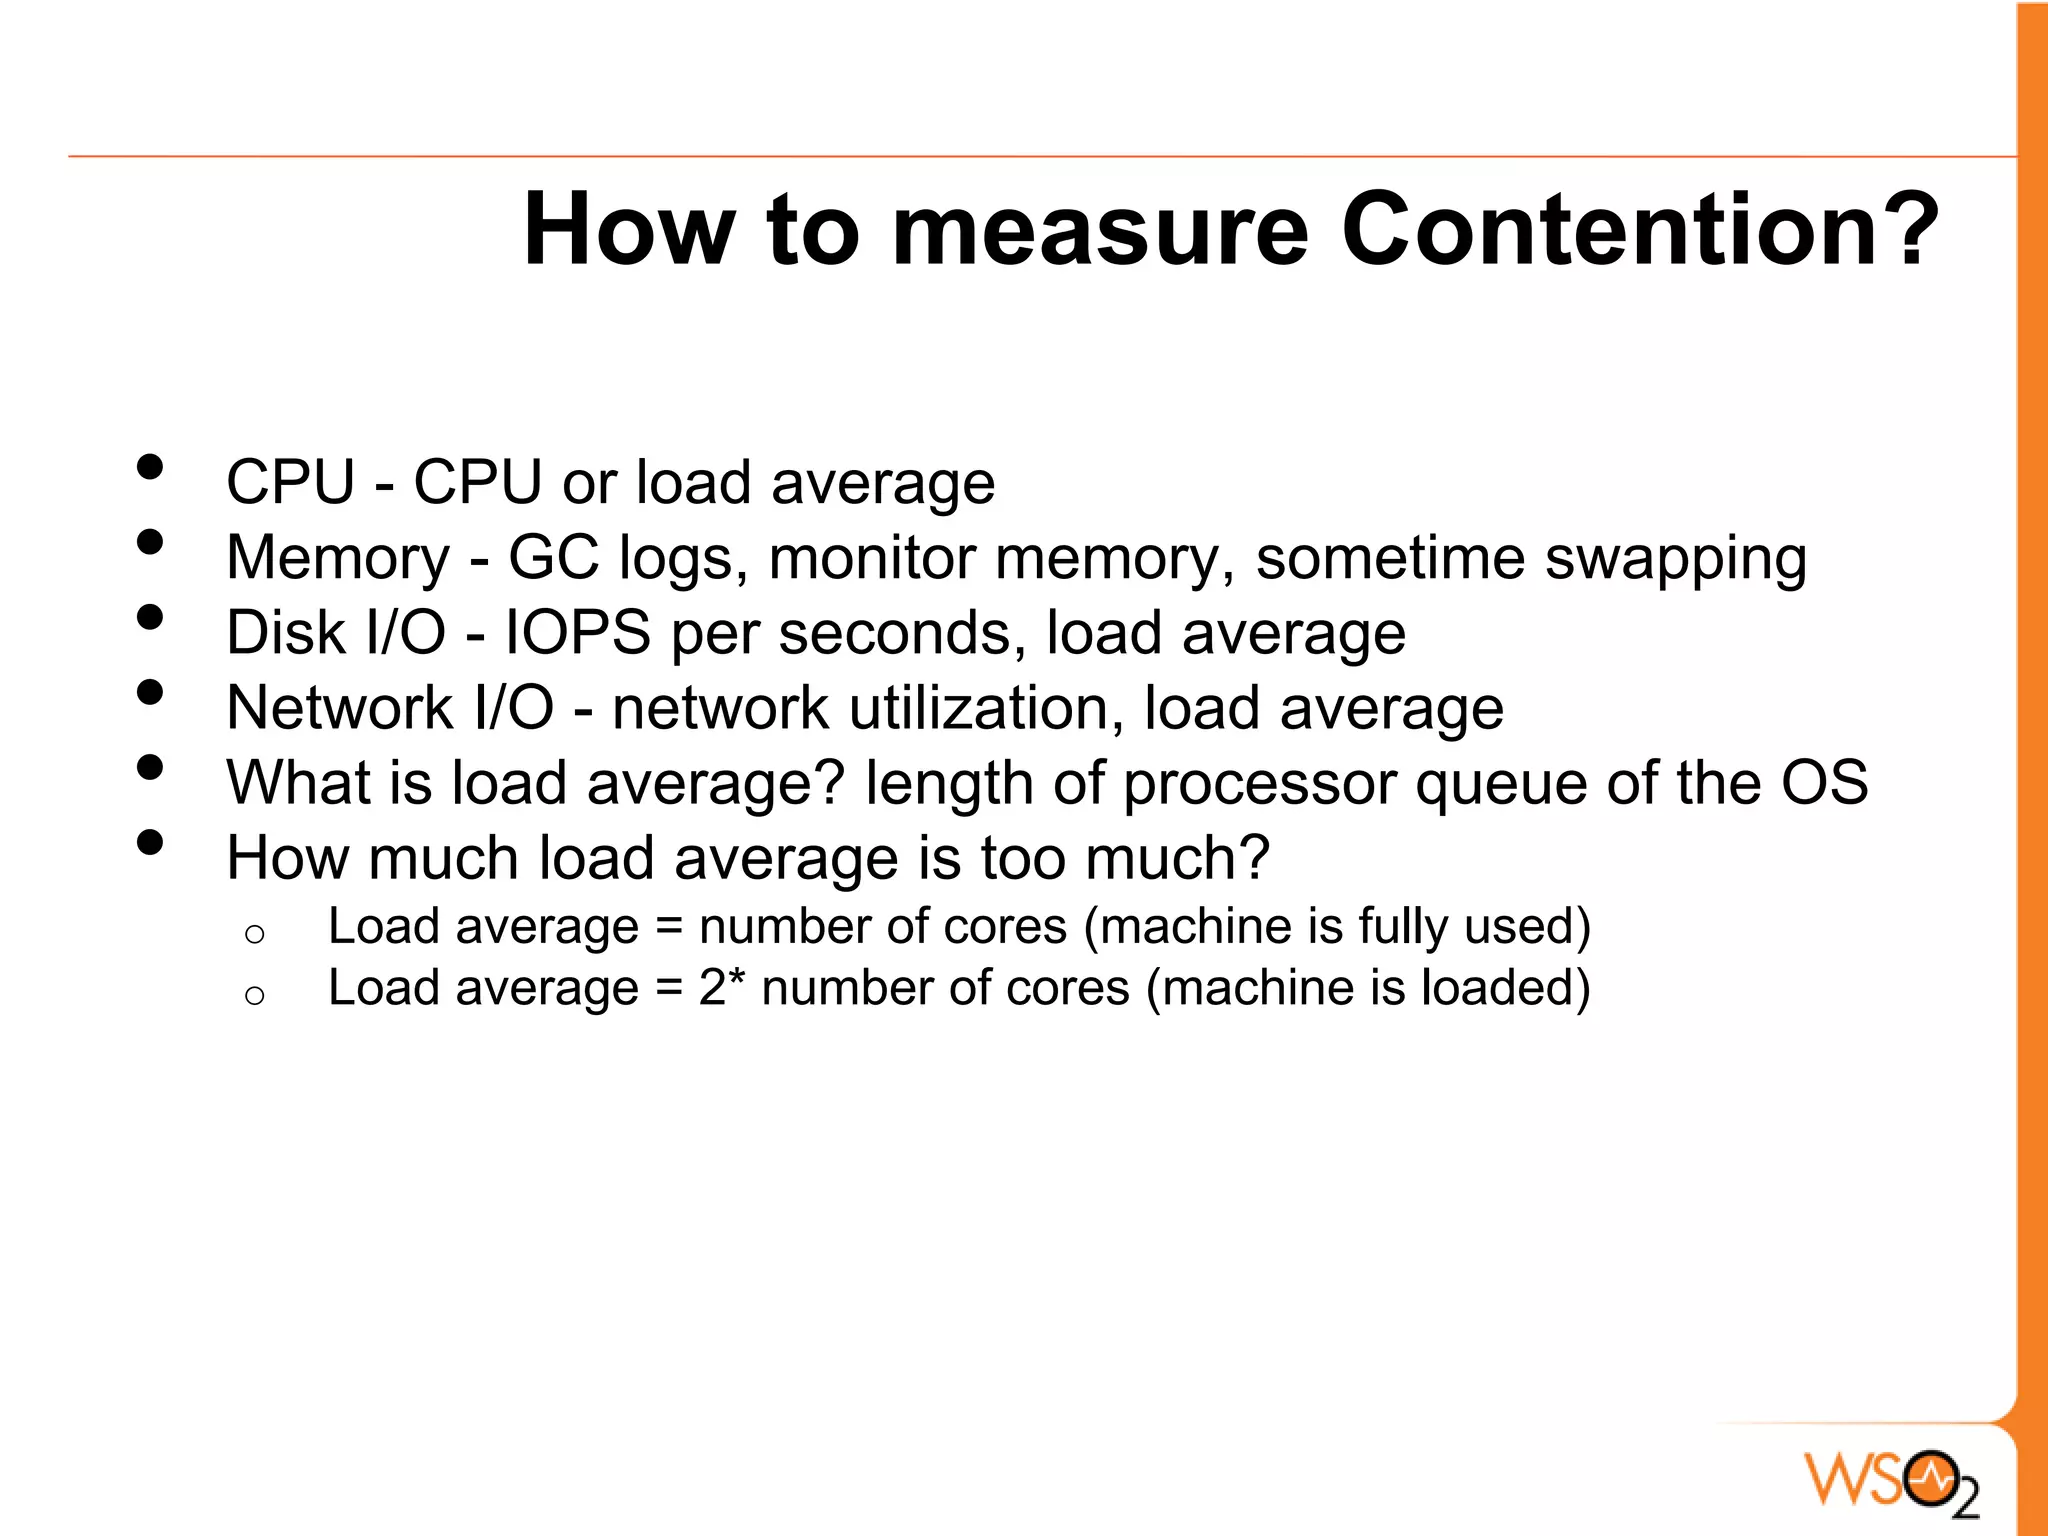
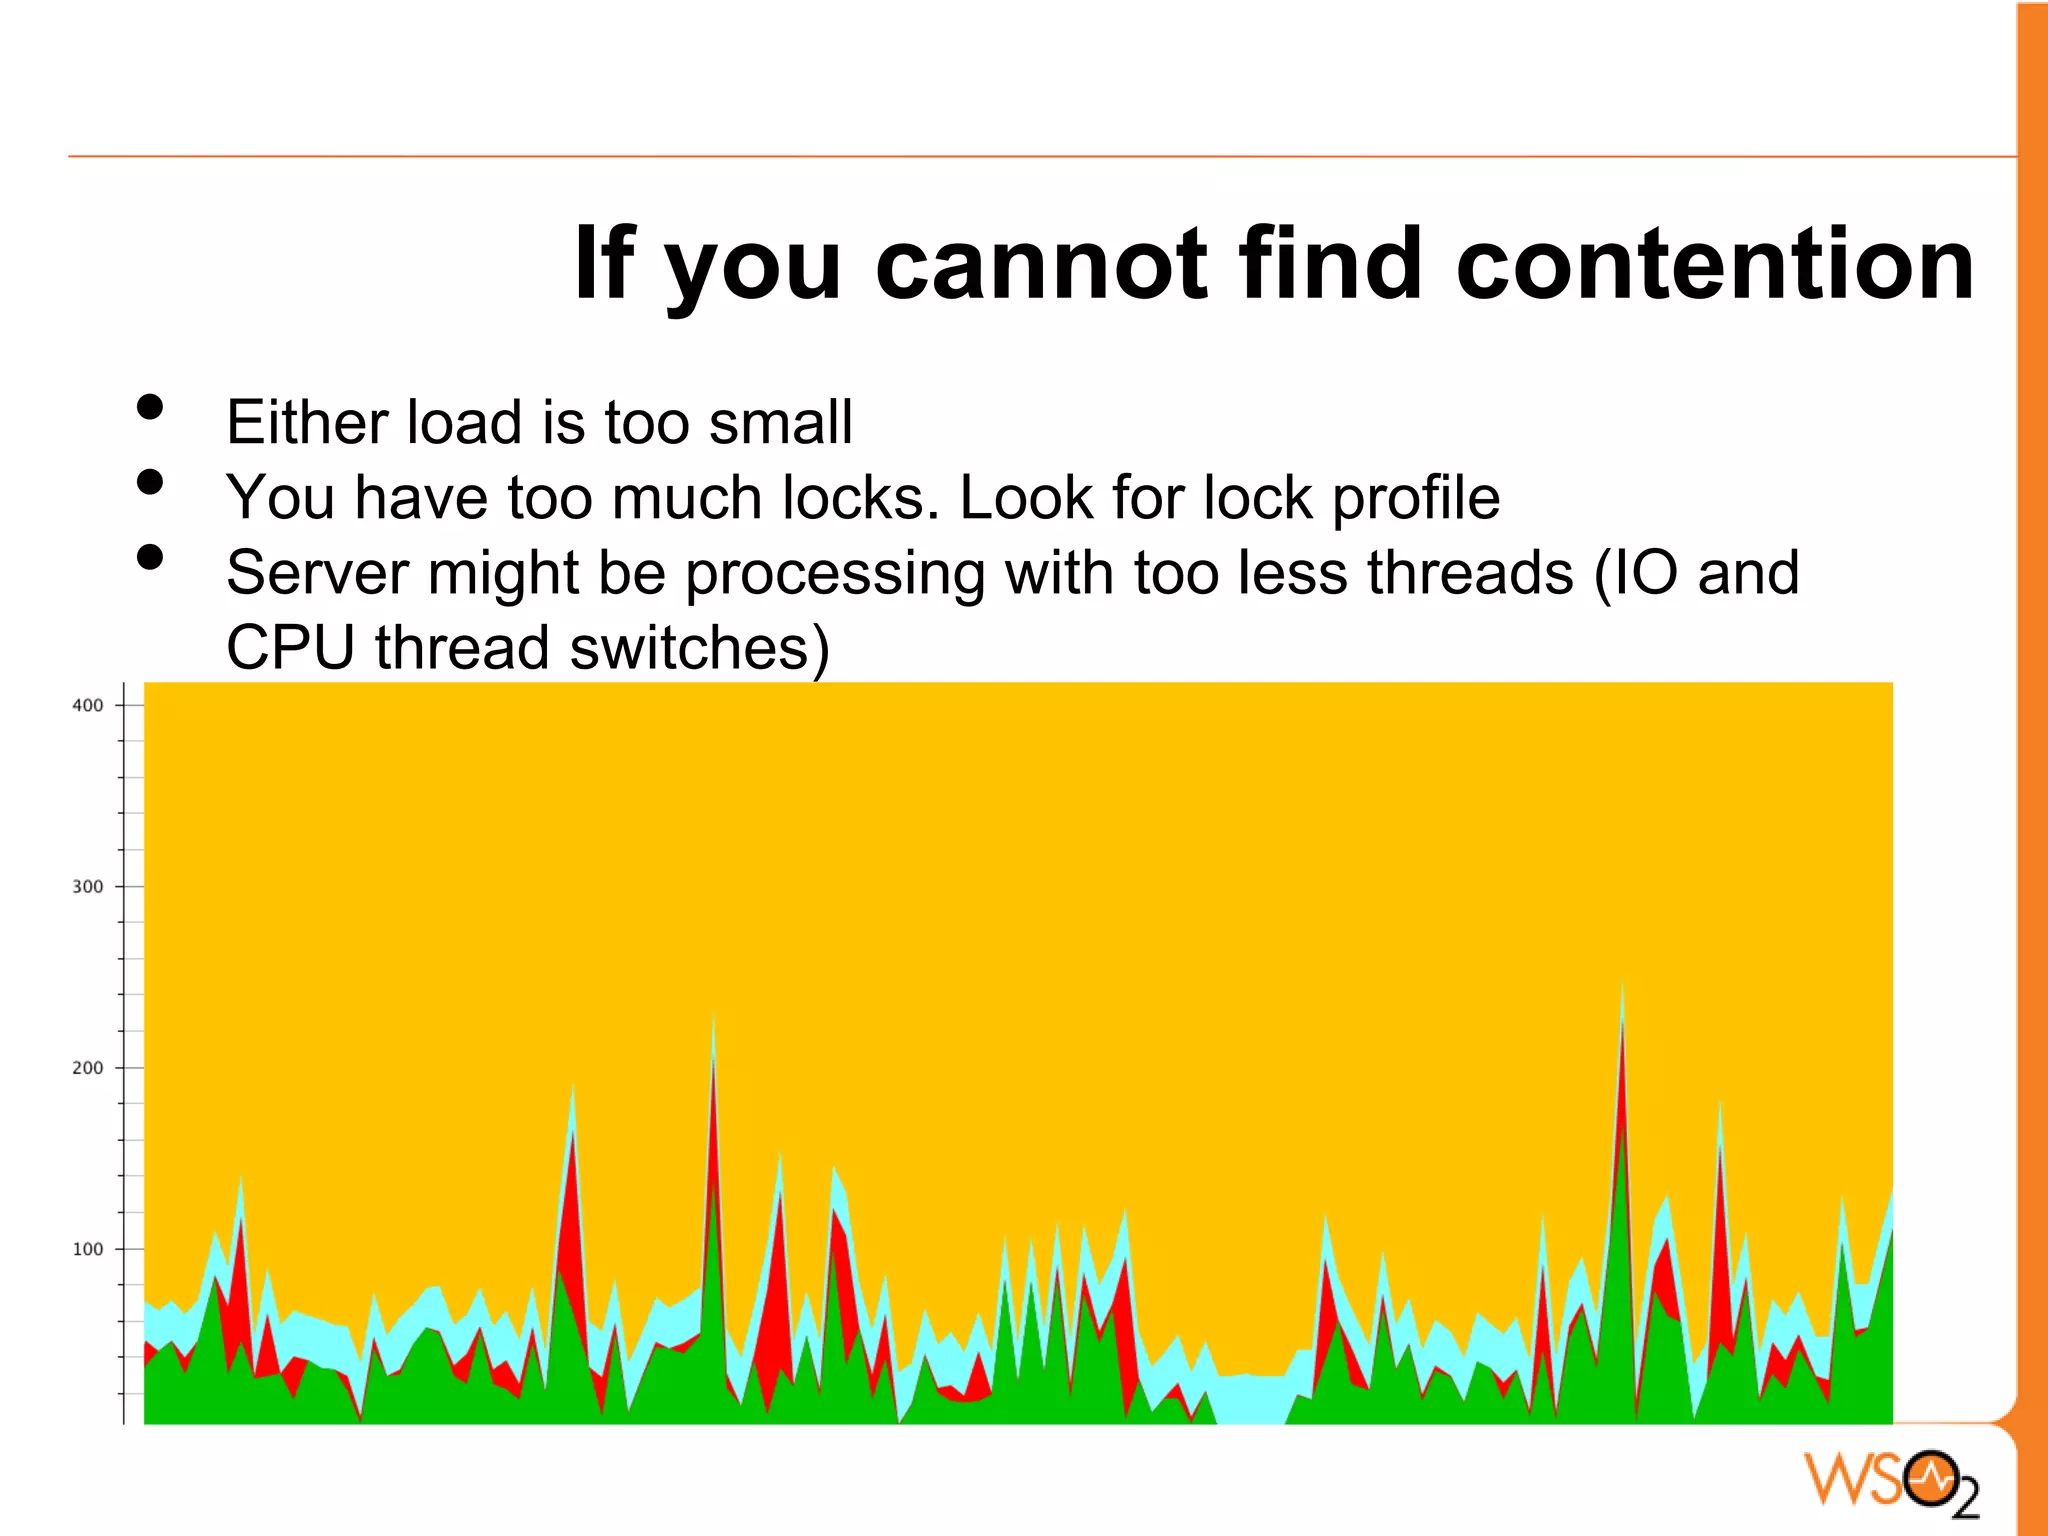
This document discusses application profiling for memory and performance. It describes how to measure contention in CPU, memory, disk I/O, and network I/O as concurrency increases. It recommends performance tuning by identifying bottlenecks and shifting them through parameter tweaking and code profiling. Common issues like classcast exceptions, permgen errors, deadlocks, nullpointers, and outofmemoryexceptions can be addressed through profiling tools like JProfiler, Eclipse Memory Analyzer, and JConsole. The document provides examples of how WSO2 uses profiling to optimize products like the Identity Server for low-memory environments and Raspberry Pi clusters.


![[Roundtable] Choreo - The AI-Native Internal Developer Platform as a Service](https://cdn.slidesharecdn.com/ss_thumbnails/choreo-deck-250328074645-511dded7-thumbnail.jpg?width=640&height=640&fit=bounds)


