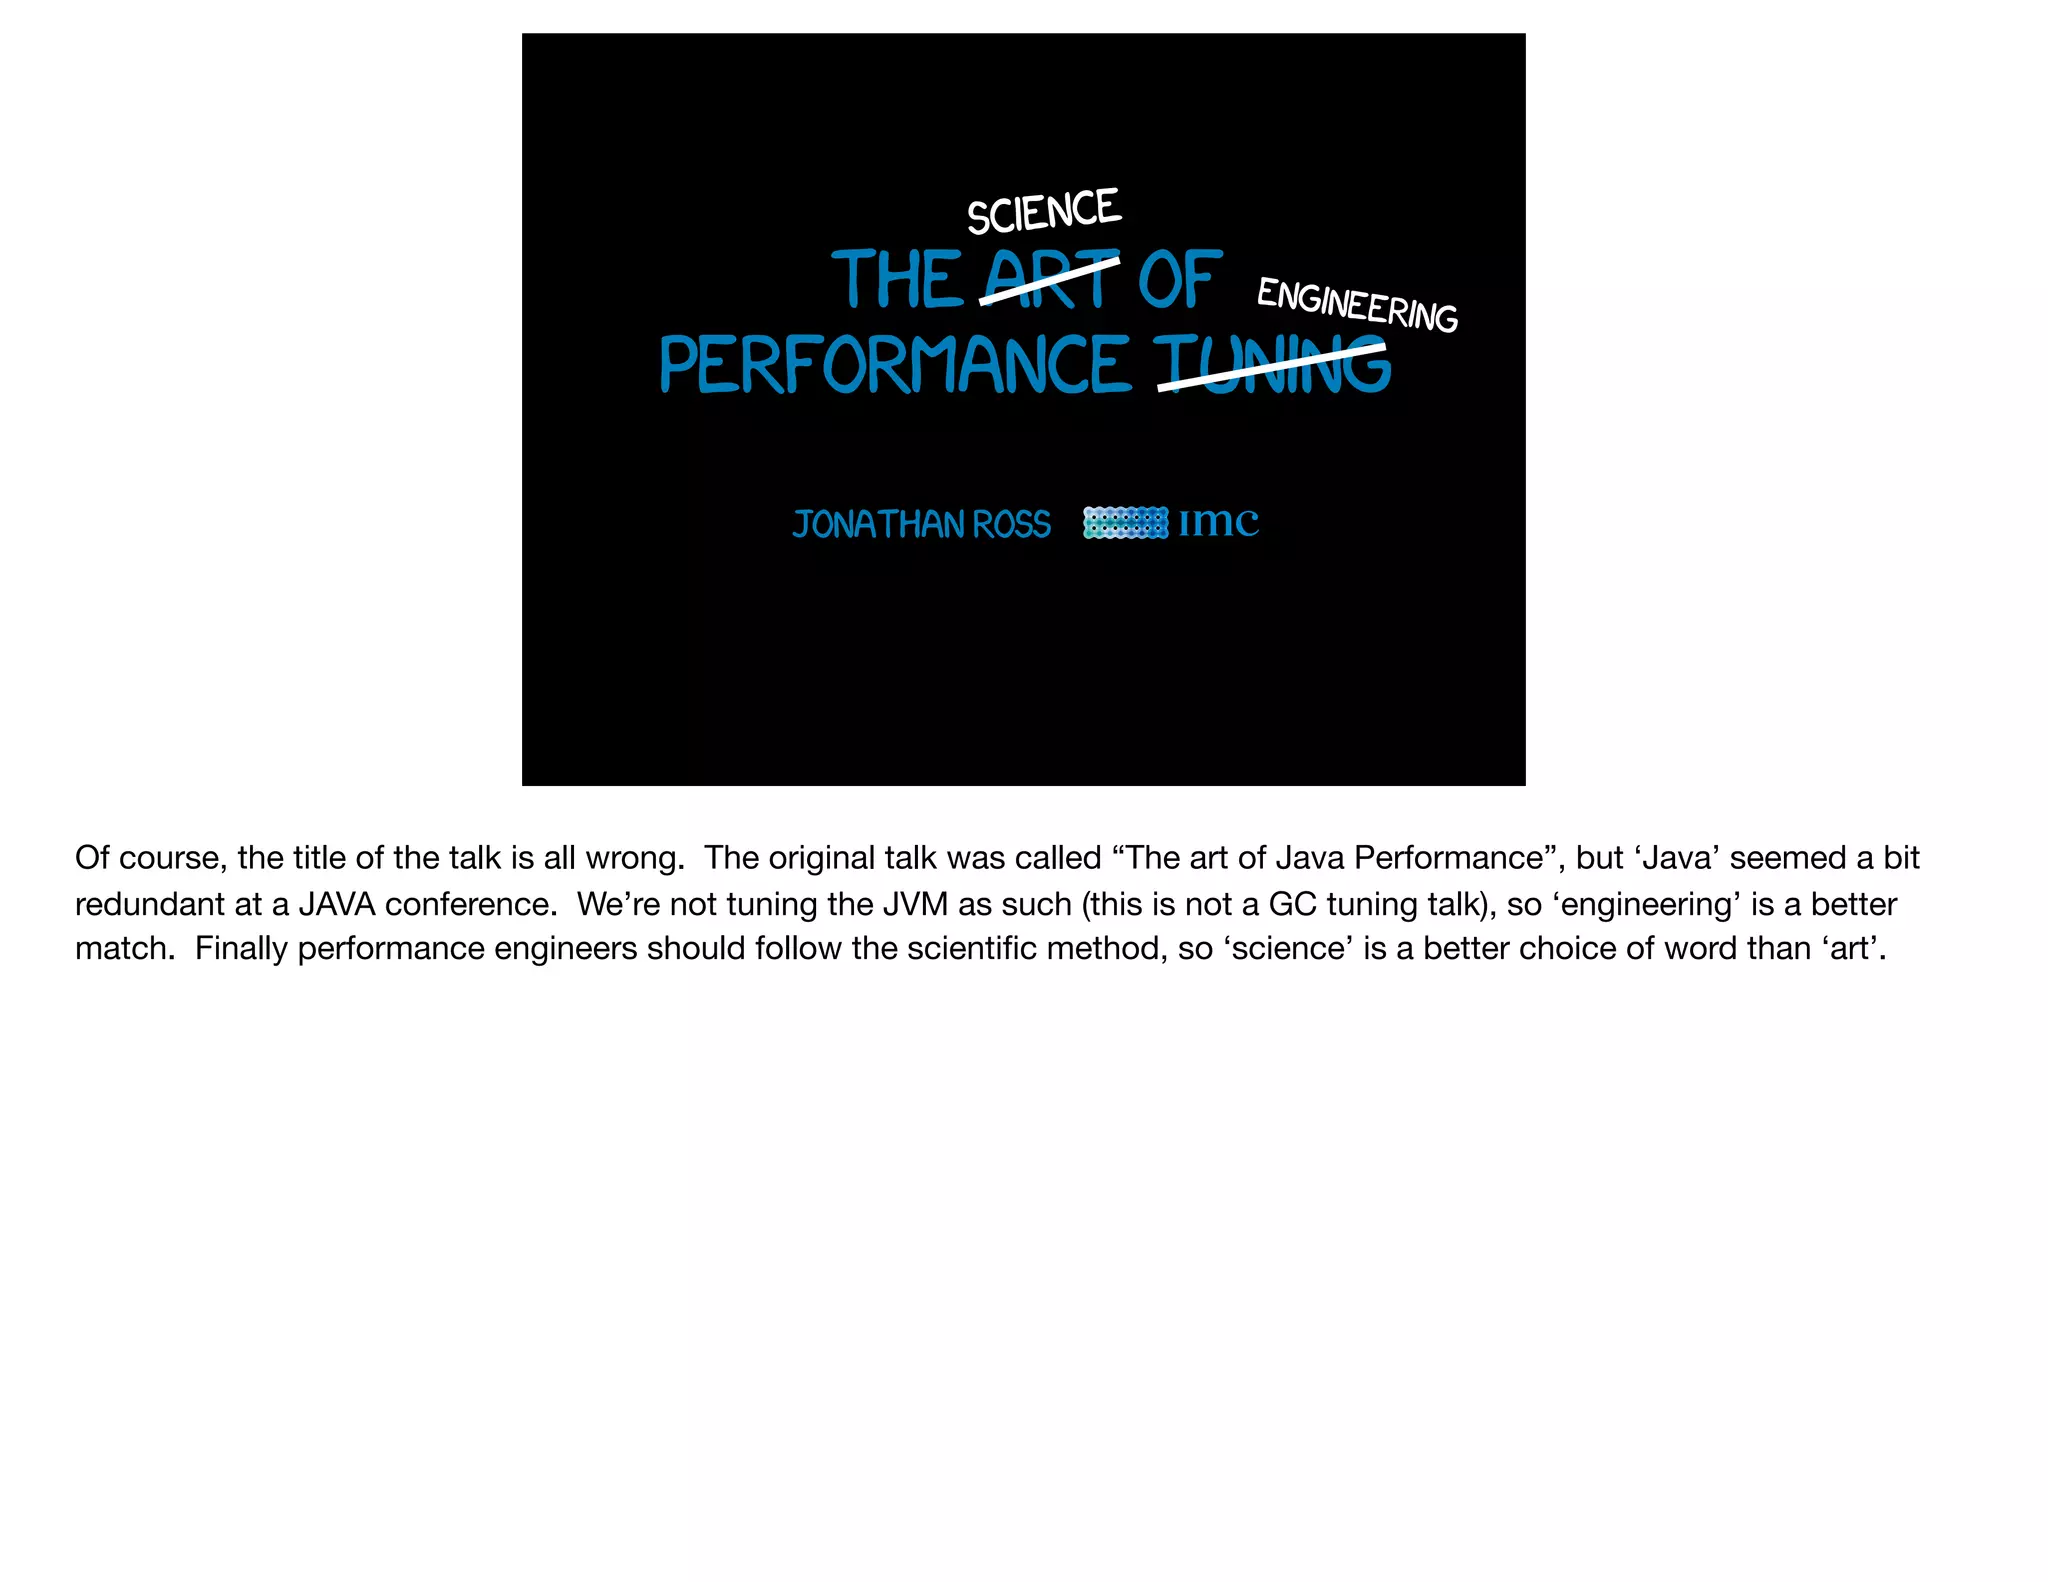
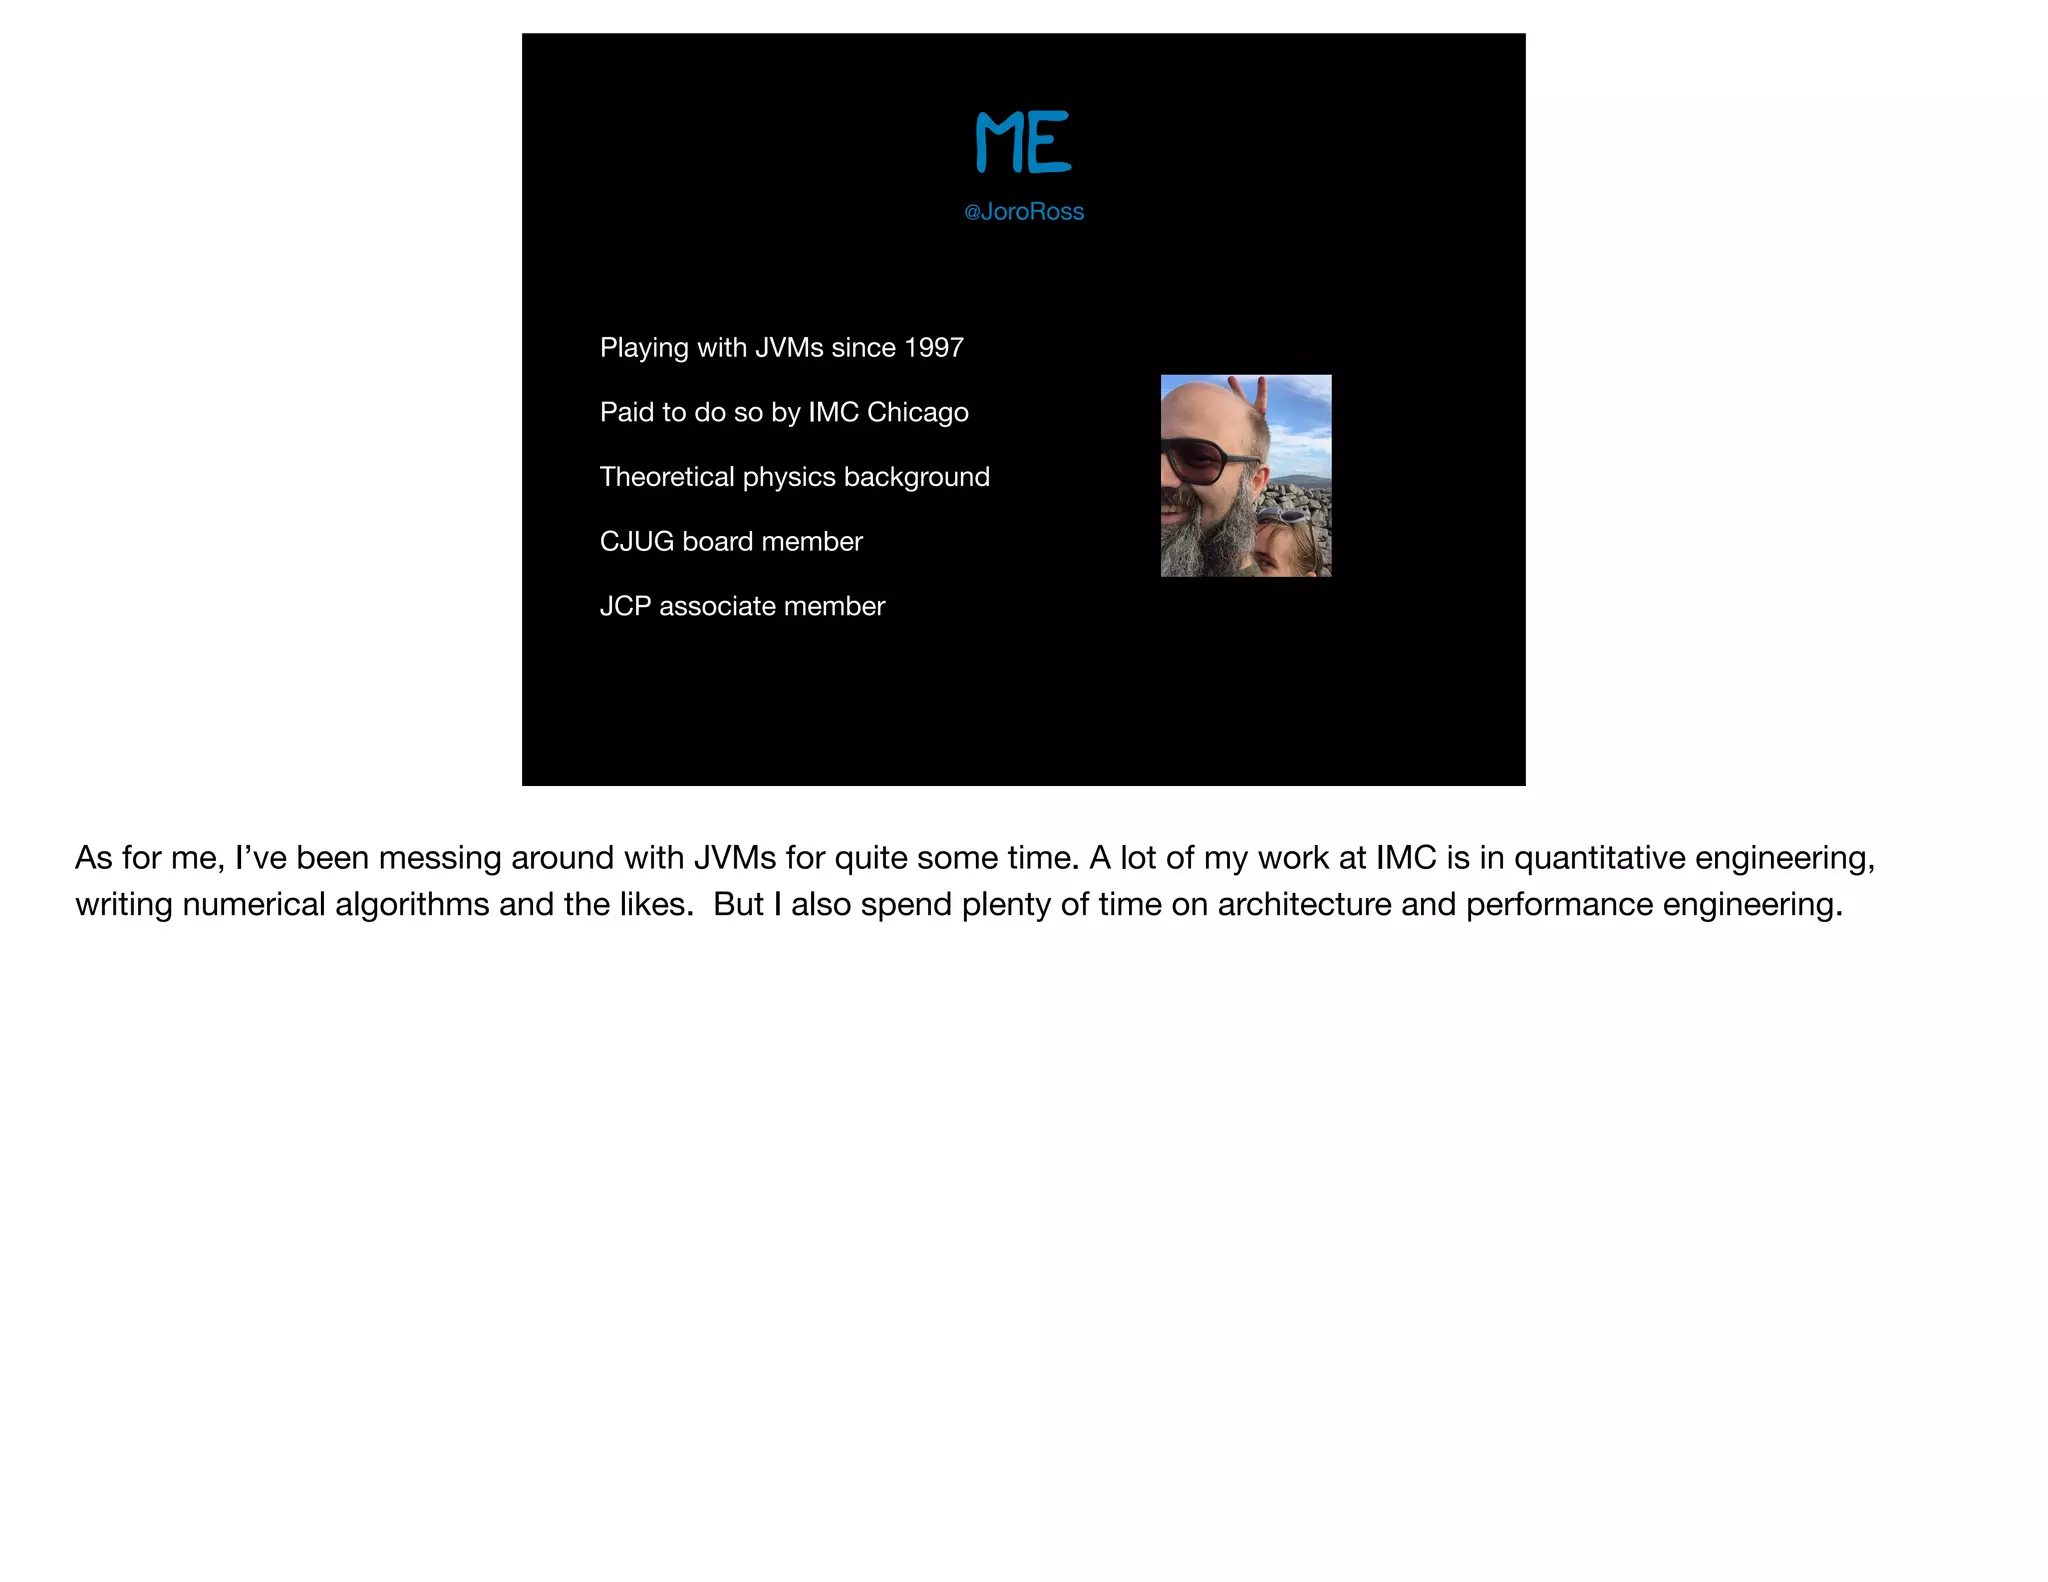
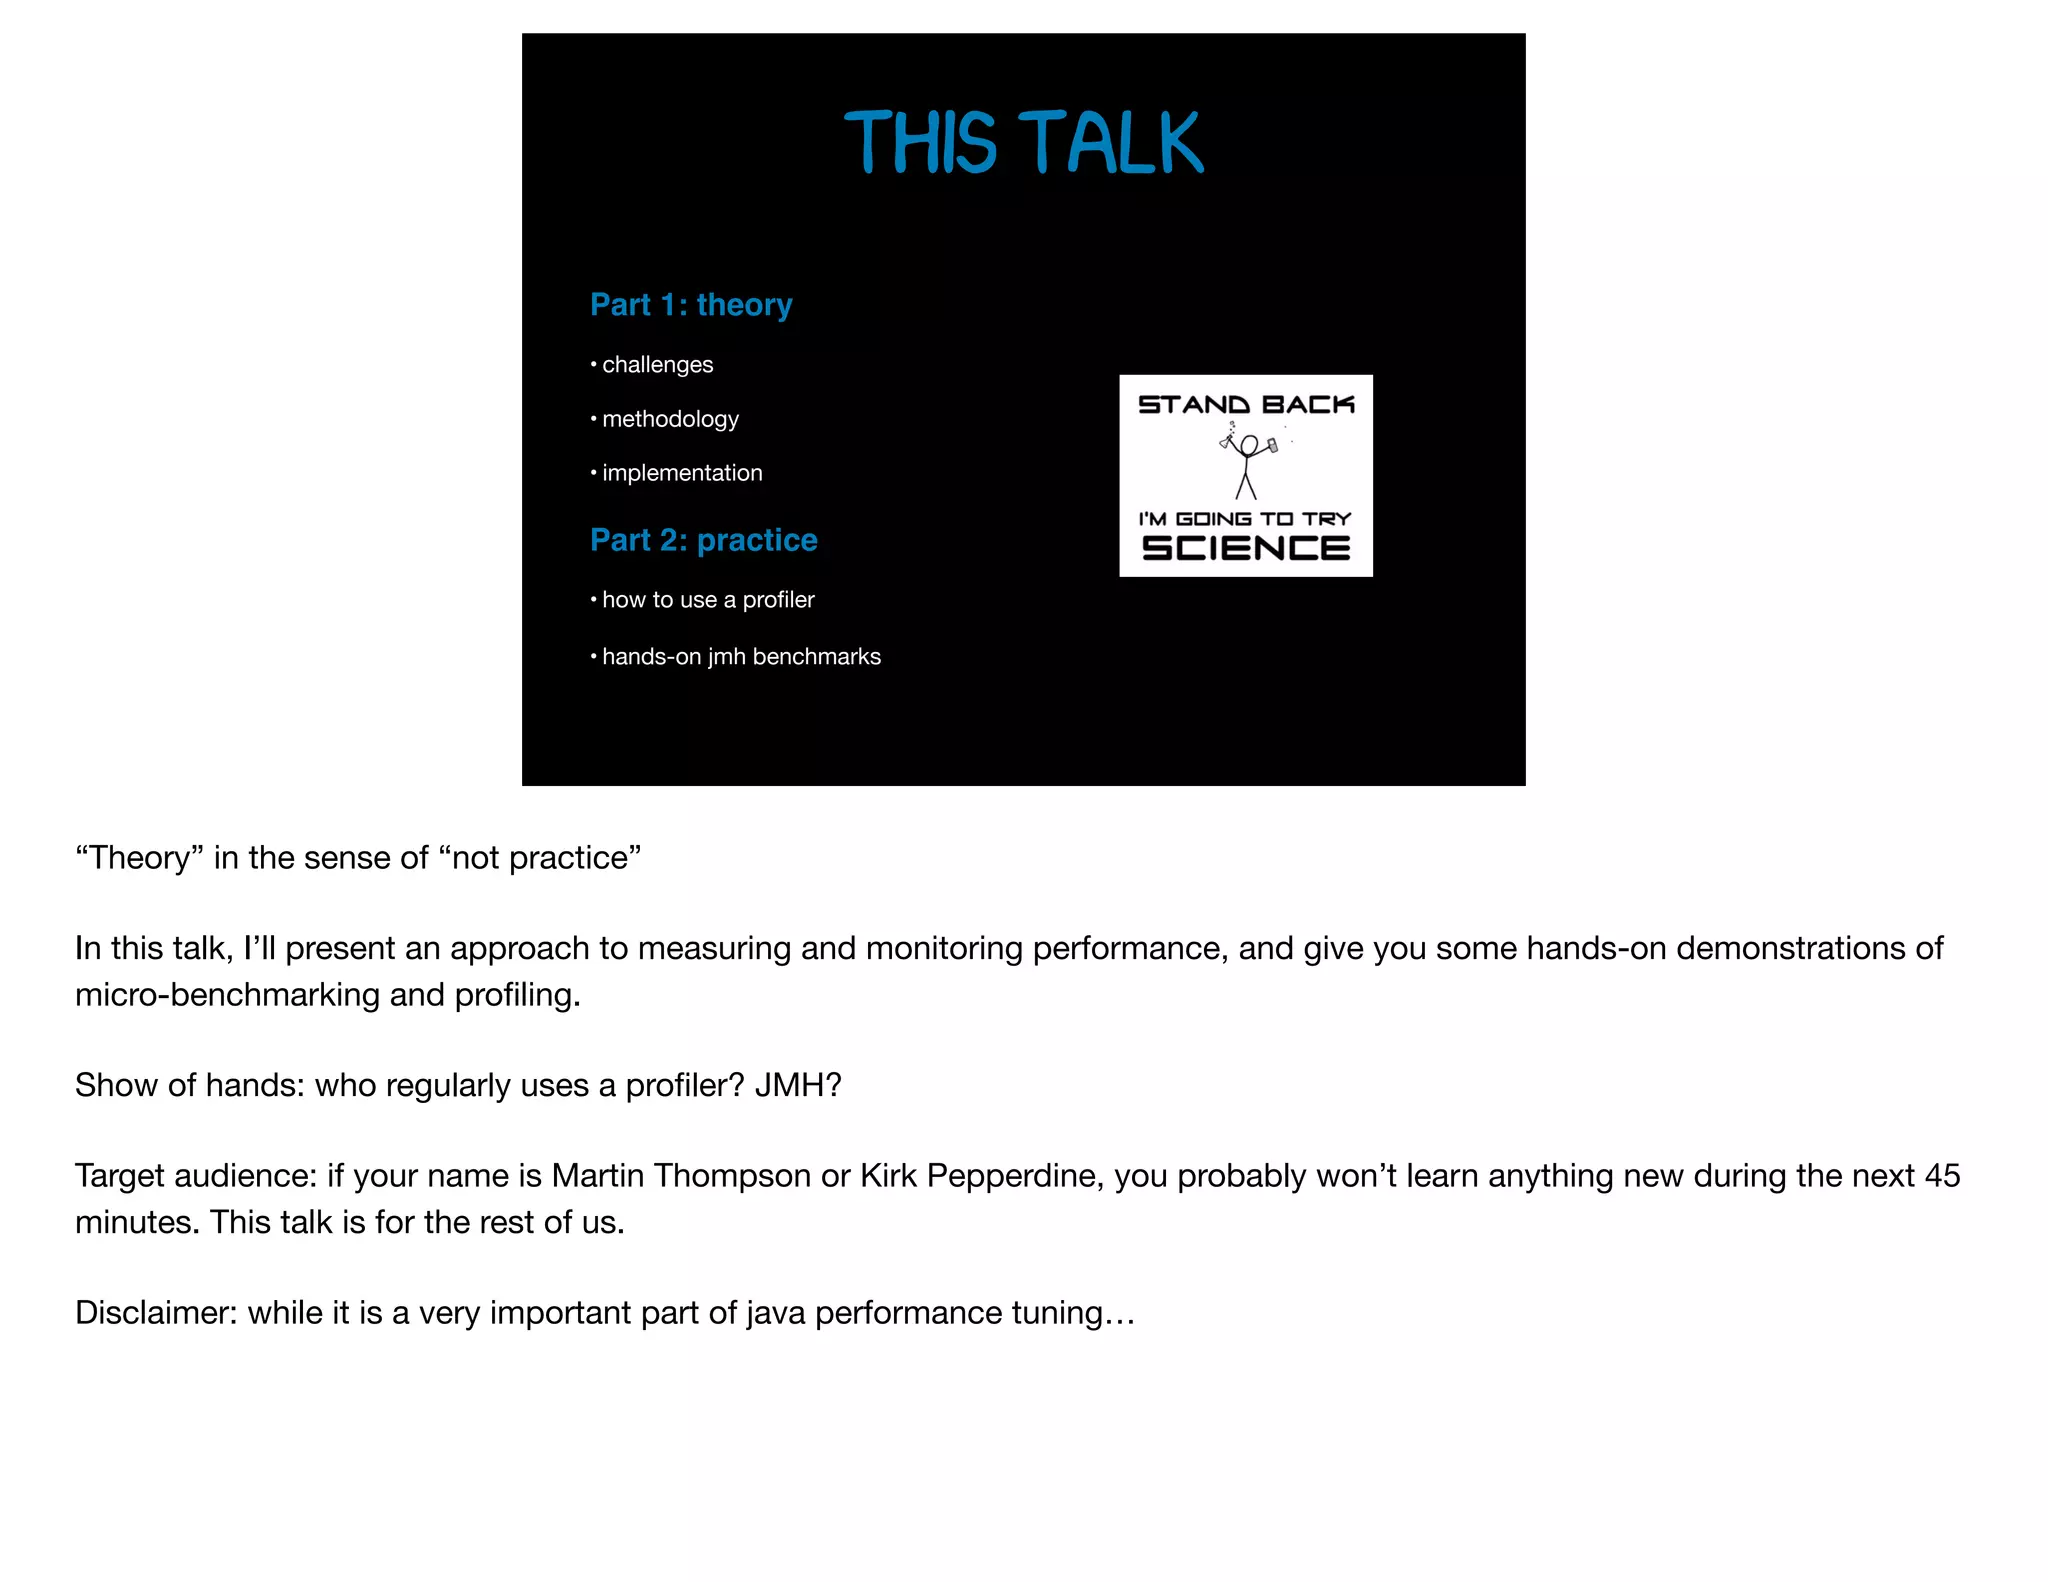
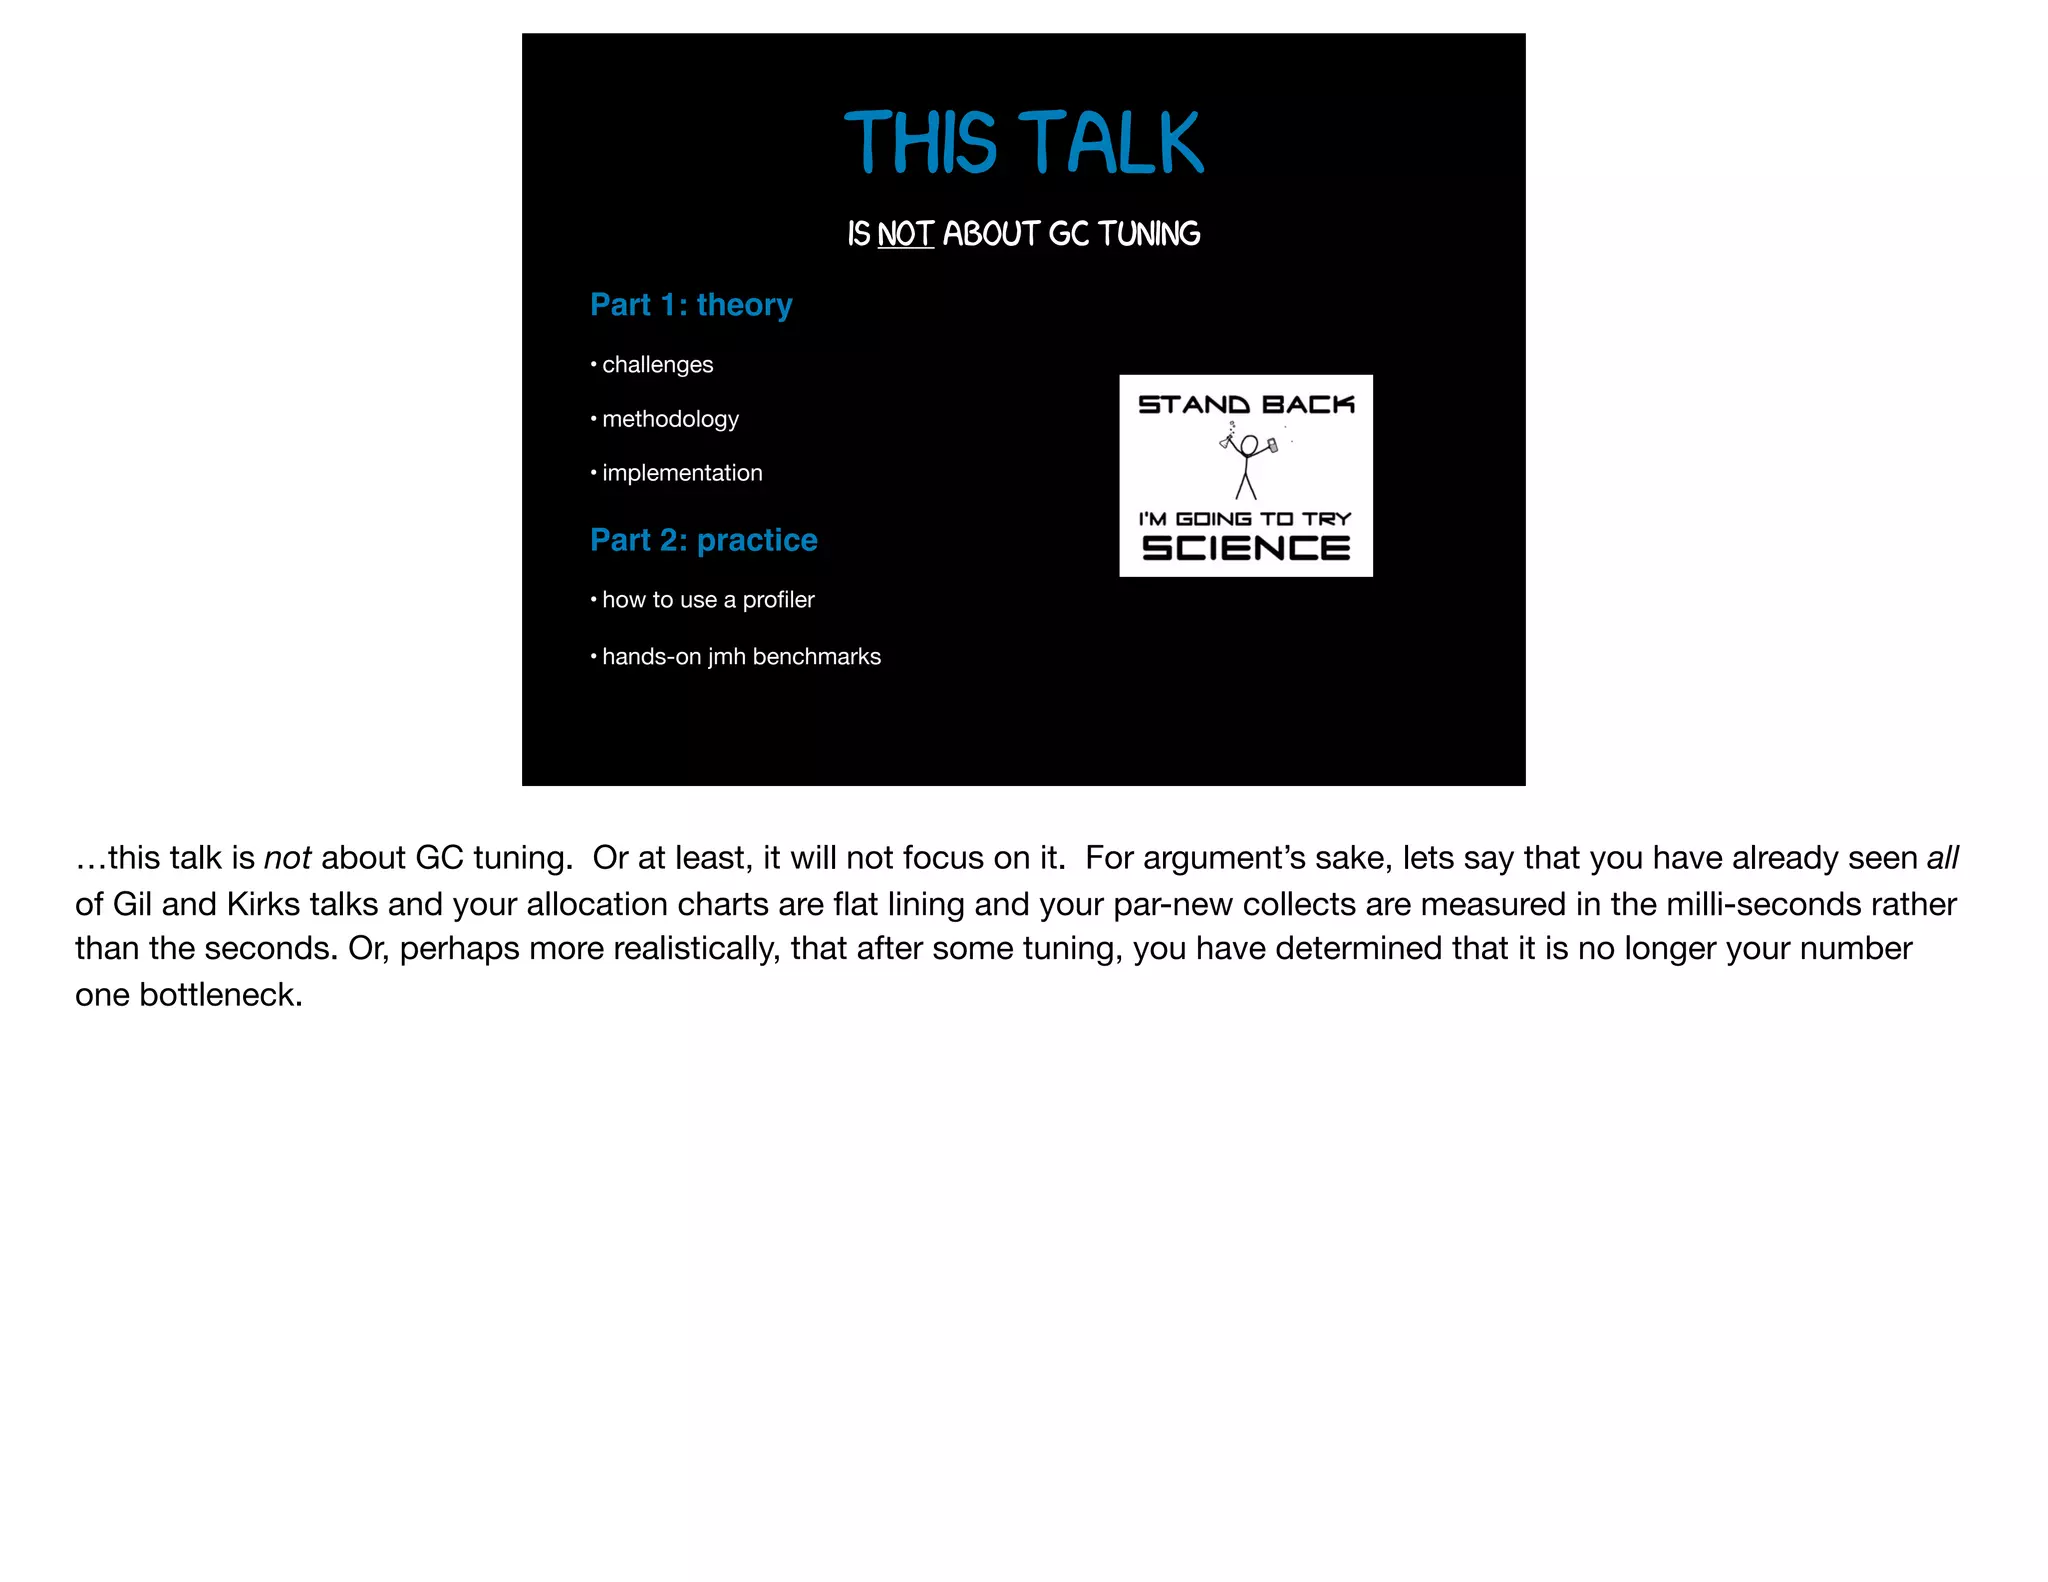
A somewhat more verbose version of https://www.slideshare.net/JonathanRoss74/the-art-of-performance-tuning.
Presented at JavaOne 2017 [CON4027], this presentation takes a practical, hands-on look at Java performance tuning. It discusses methodology (spoiler: it’s the scientific method) and how to apply it to Java SE systems (on any budget). Exploring concrete examples with tools such as the Oracle Java Mission Control feature of Oracle Java SE Advanced, VisualVM, YourKit, and JMH, the presentation focuses on ways of measuring performance, how to interpret data, ways of eliminating bottlenecks, and even how to avoid future performance regressions.
A separate version will be uploaded with speaker notes.
6 Principles for Enabling Build/Measure/Learn: Lean Engineering in ActionBill Scott
Presented at Lean Day West - Portland, OR. Sept. 17, 2013
How do you take a gigantic organization like PayPal and begin to transform the experiences? Engineering is often the key blocker in being able to achieve a high rate of innovation. In this talk, Bill Scott will give specific examples on implemented Lean UX in a 13,000 person company, re-factored the technology stack and changed the way engineers work with design & product partners. In addition, Bill will provide additional examples that go back to his early days writing one of the first Macintosh games to his more recent work at Netflix and the power of treating the user interface layer as the experimentation layer.
Given at Agile Camp 2013, San Jose, CA. Sept. 21
How do you take a gigantic organization like PayPal that was entrenched in a culture of a “”long shelf life”” and transform it to a culture of rapid experimentation? Bill will give 3 principles applied to PayPal engineering to make it a full partner with Lean UX. This will be illustrated by showing how they re-factored the tech stack and changed the way engineers work in Lean streams with design & product partners and how it plays with agile.
As a backdrop Bill will discuss several historical factors in the field of software engineering that are antithetical to the Lean Startup mindset but still find their way into most large enterprises. By understanding this historical context and applying lean principles he will demonstrate how a lean transformation can take place in any enterprise.
Lean engineering for lean/balanced teams: lessons learned (and still learning...Balanced Team
Bill Scott, PayPal
How do you take a gigantic organization and begin to transform the products? One key is to change the way teams work together to build experiences by following a Lean UX methodology. However, essential to this is to have engineering fully onboard as an integrated partner in the process. In this talk, Bill Scott will share 6 principles gleaned from the last two years to transforming engineering and the technology stack to support this working model.
WinOps Conf 2016 - Matteo Emili - Development and QA Dilemmas in DevOpsWinOps Conf
The quick rise of Continuous Delivery in the enterprise means that common problems are often approached the other way round. Concepts like Feature Flags and Testing In Production caused several headaches to developers and QA engineers, especially where they have a wealth of experience about traditional development.
There are some challenges and approaches which are very common, and they still scare newcomers. Let's have a look at a few of these, with the most common solutions.
Neotys organized its first Performance Advisory Council in Scotland, the 14th & 15th of November.
With 15 Load Testing experts from several countries (UK, France, New-Zeland, Germany, USA, Australia, India…) we explored several theme around Load Testing such as DevOps, Shift Right, AI etc.
By discussing around their experience, the methods they used, their data analysis and their interpretation, we created a lot of high-value added content that you can use to discover what will be the future of Load Testing.
You want to know more about this event ? https://www.neotys.com/performance-advisory-council
Data Workflows for Machine Learning - Seattle DAMLPaco Nathan
First public meetup at Twitter Seattle, for Seattle DAML:
http://www.meetup.com/Seattle-DAML/events/159043422/
We compare/contrast several open source frameworks which have emerged for Machine Learning workflows, including KNIME, IPython Notebook and related Py libraries, Cascading, Cascalog, Scalding, Summingbird, Spark/MLbase, MBrace on .NET, etc. The analysis develops several points for "best of breed" and what features would be great to see across the board for many frameworks... leading up to a "scorecard" to help evaluate different alternatives. We also review the PMML standard for migrating predictive models, e.g., from SAS to Hadoop.
Certification Study Group - Professional ML Engineer Session 3 (Machine Learn...gdgsurrey
Dive into the essentials of ML model development, processes, and techniques to combat underfitting and overfitting, explore distributed training approaches, and understand model explainability. Enhance your skills with practical insights from a seasoned expert.
Strata CA 2019: From Jupyter to Production Manu MukerjiManu Mukerji
Proposed title
From Jupyter to production
Description of the presentation
Jupyter is very popular for data science, data exploration and visualization, this talk is about how to use it in for AI/ML in a production environment.
General Flow of talk:
How things can go wrong with QA, Production releases when using a notebook
Common Jupyter ML examples
Standard ML flow
Training in production
Model creation
Testing in production
Papermill and Jupyter
Production workflows with Sagemaker
Speaker
Manu Mukerji is senior director of data, machine learning, and analytics at 8×8. Manu’s background lies in cloud computing and big data, working on systems handling billions of transactions per day in real time. He enjoys building and architecting scalable, highly available data solutions and has extensive experience working in online advertising and social media.
2019 StartIT - Boosting your performance with BlackfireMarko Mitranić
A workshop held in StartIT as part of Catena Media learning sessions.
We aim to dispel the notion that large PHP applications tend to be sluggish, resource-intensive and slow compared to what the likes of Python, Erlang or even Node can do. The issue is not with optimising PHP internals - it's the lack of proper introspection tools and getting them into our every day workflow that counts! In this workshop we will talk about our struggles with whipping PHP Applications into shape, as well as work together on some of the more interesting examples of CPU or IO drain.
OpenMetadata Community Meeting - 5th June 2024OpenMetadata
The OpenMetadata Community Meeting was held on June 5th, 2024. In this meeting, we discussed about the data quality capabilities that are integrated with the Incident Manager, providing a complete solution to handle your data observability needs. Watch the end-to-end demo of the data quality features.
* How to run your own data quality framework
* What is the performance impact of running data quality frameworks
* How to run the test cases in your own ETL pipelines
* How the Incident Manager is integrated
* Get notified with alerts when test cases fail
Watch the meeting recording here - https://www.youtube.com/watch?v=UbNOje0kf6E
First Steps with Globus Compute Multi-User EndpointsGlobus
In this presentation we will share our experiences around getting started with the Globus Compute multi-user endpoint. Working with the Pharmacology group at the University of Auckland, we have previously written an application using Globus Compute that can offload computationally expensive steps in the researcher's workflows, which they wish to manage from their familiar Windows environments, onto the NeSI (New Zealand eScience Infrastructure) cluster. Some of the challenges we have encountered were that each researcher had to set up and manage their own single-user globus compute endpoint and that the workloads had varying resource requirements (CPUs, memory and wall time) between different runs. We hope that the multi-user endpoint will help to address these challenges and share an update on our progress here.
More Related Content
Similar to The Art Of Performance Tuning - with presenter notes!
6 Principles for Enabling Build/Measure/Learn: Lean Engineering in ActionBill Scott
Presented at Lean Day West - Portland, OR. Sept. 17, 2013
How do you take a gigantic organization like PayPal and begin to transform the experiences? Engineering is often the key blocker in being able to achieve a high rate of innovation. In this talk, Bill Scott will give specific examples on implemented Lean UX in a 13,000 person company, re-factored the technology stack and changed the way engineers work with design & product partners. In addition, Bill will provide additional examples that go back to his early days writing one of the first Macintosh games to his more recent work at Netflix and the power of treating the user interface layer as the experimentation layer.
Given at Agile Camp 2013, San Jose, CA. Sept. 21
How do you take a gigantic organization like PayPal that was entrenched in a culture of a “”long shelf life”” and transform it to a culture of rapid experimentation? Bill will give 3 principles applied to PayPal engineering to make it a full partner with Lean UX. This will be illustrated by showing how they re-factored the tech stack and changed the way engineers work in Lean streams with design & product partners and how it plays with agile.
As a backdrop Bill will discuss several historical factors in the field of software engineering that are antithetical to the Lean Startup mindset but still find their way into most large enterprises. By understanding this historical context and applying lean principles he will demonstrate how a lean transformation can take place in any enterprise.
Lean engineering for lean/balanced teams: lessons learned (and still learning...Balanced Team
Bill Scott, PayPal
How do you take a gigantic organization and begin to transform the products? One key is to change the way teams work together to build experiences by following a Lean UX methodology. However, essential to this is to have engineering fully onboard as an integrated partner in the process. In this talk, Bill Scott will share 6 principles gleaned from the last two years to transforming engineering and the technology stack to support this working model.
WinOps Conf 2016 - Matteo Emili - Development and QA Dilemmas in DevOpsWinOps Conf
The quick rise of Continuous Delivery in the enterprise means that common problems are often approached the other way round. Concepts like Feature Flags and Testing In Production caused several headaches to developers and QA engineers, especially where they have a wealth of experience about traditional development.
There are some challenges and approaches which are very common, and they still scare newcomers. Let's have a look at a few of these, with the most common solutions.
Neotys organized its first Performance Advisory Council in Scotland, the 14th & 15th of November.
With 15 Load Testing experts from several countries (UK, France, New-Zeland, Germany, USA, Australia, India…) we explored several theme around Load Testing such as DevOps, Shift Right, AI etc.
By discussing around their experience, the methods they used, their data analysis and their interpretation, we created a lot of high-value added content that you can use to discover what will be the future of Load Testing.
You want to know more about this event ? https://www.neotys.com/performance-advisory-council
Data Workflows for Machine Learning - Seattle DAMLPaco Nathan
First public meetup at Twitter Seattle, for Seattle DAML:
http://www.meetup.com/Seattle-DAML/events/159043422/
We compare/contrast several open source frameworks which have emerged for Machine Learning workflows, including KNIME, IPython Notebook and related Py libraries, Cascading, Cascalog, Scalding, Summingbird, Spark/MLbase, MBrace on .NET, etc. The analysis develops several points for "best of breed" and what features would be great to see across the board for many frameworks... leading up to a "scorecard" to help evaluate different alternatives. We also review the PMML standard for migrating predictive models, e.g., from SAS to Hadoop.
Certification Study Group - Professional ML Engineer Session 3 (Machine Learn...gdgsurrey
Dive into the essentials of ML model development, processes, and techniques to combat underfitting and overfitting, explore distributed training approaches, and understand model explainability. Enhance your skills with practical insights from a seasoned expert.
Strata CA 2019: From Jupyter to Production Manu MukerjiManu Mukerji
Proposed title
From Jupyter to production
Description of the presentation
Jupyter is very popular for data science, data exploration and visualization, this talk is about how to use it in for AI/ML in a production environment.
General Flow of talk:
How things can go wrong with QA, Production releases when using a notebook
Common Jupyter ML examples
Standard ML flow
Training in production
Model creation
Testing in production
Papermill and Jupyter
Production workflows with Sagemaker
Speaker
Manu Mukerji is senior director of data, machine learning, and analytics at 8×8. Manu’s background lies in cloud computing and big data, working on systems handling billions of transactions per day in real time. He enjoys building and architecting scalable, highly available data solutions and has extensive experience working in online advertising and social media.
2019 StartIT - Boosting your performance with BlackfireMarko Mitranić
A workshop held in StartIT as part of Catena Media learning sessions.
We aim to dispel the notion that large PHP applications tend to be sluggish, resource-intensive and slow compared to what the likes of Python, Erlang or even Node can do. The issue is not with optimising PHP internals - it's the lack of proper introspection tools and getting them into our every day workflow that counts! In this workshop we will talk about our struggles with whipping PHP Applications into shape, as well as work together on some of the more interesting examples of CPU or IO drain.
Similar to The Art Of Performance Tuning - with presenter notes! (20)
OpenMetadata Community Meeting - 5th June 2024OpenMetadata
The OpenMetadata Community Meeting was held on June 5th, 2024. In this meeting, we discussed about the data quality capabilities that are integrated with the Incident Manager, providing a complete solution to handle your data observability needs. Watch the end-to-end demo of the data quality features.
* How to run your own data quality framework
* What is the performance impact of running data quality frameworks
* How to run the test cases in your own ETL pipelines
* How the Incident Manager is integrated
* Get notified with alerts when test cases fail
Watch the meeting recording here - https://www.youtube.com/watch?v=UbNOje0kf6E
First Steps with Globus Compute Multi-User EndpointsGlobus
In this presentation we will share our experiences around getting started with the Globus Compute multi-user endpoint. Working with the Pharmacology group at the University of Auckland, we have previously written an application using Globus Compute that can offload computationally expensive steps in the researcher's workflows, which they wish to manage from their familiar Windows environments, onto the NeSI (New Zealand eScience Infrastructure) cluster. Some of the challenges we have encountered were that each researcher had to set up and manage their own single-user globus compute endpoint and that the workloads had varying resource requirements (CPUs, memory and wall time) between different runs. We hope that the multi-user endpoint will help to address these challenges and share an update on our progress here.
Exploring Innovations in Data Repository Solutions - Insights from the U.S. G...Globus
The U.S. Geological Survey (USGS) has made substantial investments in meeting evolving scientific, technical, and policy driven demands on storing, managing, and delivering data. As these demands continue to grow in complexity and scale, the USGS must continue to explore innovative solutions to improve its management, curation, sharing, delivering, and preservation approaches for large-scale research data. Supporting these needs, the USGS has partnered with the University of Chicago-Globus to research and develop advanced repository components and workflows leveraging its current investment in Globus. The primary outcome of this partnership includes the development of a prototype enterprise repository, driven by USGS Data Release requirements, through exploration and implementation of the entire suite of the Globus platform offerings, including Globus Flow, Globus Auth, Globus Transfer, and Globus Search. This presentation will provide insights into this research partnership, introduce the unique requirements and challenges being addressed and provide relevant project progress.
Climate Science Flows: Enabling Petabyte-Scale Climate Analysis with the Eart...Globus
The Earth System Grid Federation (ESGF) is a global network of data servers that archives and distributes the planet’s largest collection of Earth system model output for thousands of climate and environmental scientists worldwide. Many of these petabyte-scale data archives are located in proximity to large high-performance computing (HPC) or cloud computing resources, but the primary workflow for data users consists of transferring data, and applying computations on a different system. As a part of the ESGF 2.0 US project (funded by the United States Department of Energy Office of Science), we developed pre-defined data workflows, which can be run on-demand, capable of applying many data reduction and data analysis to the large ESGF data archives, transferring only the resultant analysis (ex. visualizations, smaller data files). In this talk, we will showcase a few of these workflows, highlighting how Globus Flows can be used for petabyte-scale climate analysis.
How to Position Your Globus Data Portal for Success Ten Good PracticesGlobus
Science gateways allow science and engineering communities to access shared data, software, computing services, and instruments. Science gateways have gained a lot of traction in the last twenty years, as evidenced by projects such as the Science Gateways Community Institute (SGCI) and the Center of Excellence on Science Gateways (SGX3) in the US, The Australian Research Data Commons (ARDC) and its platforms in Australia, and the projects around Virtual Research Environments in Europe. A few mature frameworks have evolved with their different strengths and foci and have been taken up by a larger community such as the Globus Data Portal, Hubzero, Tapis, and Galaxy. However, even when gateways are built on successful frameworks, they continue to face the challenges of ongoing maintenance costs and how to meet the ever-expanding needs of the community they serve with enhanced features. It is not uncommon that gateways with compelling use cases are nonetheless unable to get past the prototype phase and become a full production service, or if they do, they don't survive more than a couple of years. While there is no guaranteed pathway to success, it seems likely that for any gateway there is a need for a strong community and/or solid funding streams to create and sustain its success. With over twenty years of examples to draw from, this presentation goes into detail for ten factors common to successful and enduring gateways that effectively serve as best practices for any new or developing gateway.
Software Engineering, Software Consulting, Tech Lead.
Spring Boot, Spring Cloud, Spring Core, Spring JDBC, Spring Security,
Spring Transaction, Spring MVC,
Log4j, REST/SOAP WEB-SERVICES.
In 2015, I used to write extensions for Joomla, WordPress, phpBB3, etc and I ...Juraj Vysvader
In 2015, I used to write extensions for Joomla, WordPress, phpBB3, etc and I didn't get rich from it but it did have 63K downloads (powered possible tens of thousands of websites).
Navigating the Metaverse: A Journey into Virtual Evolution"Donna Lenk
Join us for an exploration of the Metaverse's evolution, where innovation meets imagination. Discover new dimensions of virtual events, engage with thought-provoking discussions, and witness the transformative power of digital realms."
Code reviews are vital for ensuring good code quality. They serve as one of our last lines of defense against bugs and subpar code reaching production.
Yet, they often turn into annoying tasks riddled with frustration, hostility, unclear feedback and lack of standards. How can we improve this crucial process?
In this session we will cover:
- The Art of Effective Code Reviews
- Streamlining the Review Process
- Elevating Reviews with Automated Tools
By the end of this presentation, you'll have the knowledge on how to organize and improve your code review proces
Atelier - Innover avec l’IA Générative et les graphes de connaissancesNeo4j
Atelier - Innover avec l’IA Générative et les graphes de connaissances
Allez au-delà du battage médiatique autour de l’IA et découvrez des techniques pratiques pour utiliser l’IA de manière responsable à travers les données de votre organisation. Explorez comment utiliser les graphes de connaissances pour augmenter la précision, la transparence et la capacité d’explication dans les systèmes d’IA générative. Vous partirez avec une expérience pratique combinant les relations entre les données et les LLM pour apporter du contexte spécifique à votre domaine et améliorer votre raisonnement.
Amenez votre ordinateur portable et nous vous guiderons sur la mise en place de votre propre pile d’IA générative, en vous fournissant des exemples pratiques et codés pour démarrer en quelques minutes.
Developing Distributed High-performance Computing Capabilities of an Open Sci...Globus
COVID-19 had an unprecedented impact on scientific collaboration. The pandemic and its broad response from the scientific community has forged new relationships among public health practitioners, mathematical modelers, and scientific computing specialists, while revealing critical gaps in exploiting advanced computing systems to support urgent decision making. Informed by our team’s work in applying high-performance computing in support of public health decision makers during the COVID-19 pandemic, we present how Globus technologies are enabling the development of an open science platform for robust epidemic analysis, with the goal of collaborative, secure, distributed, on-demand, and fast time-to-solution analyses to support public health.
Prosigns: Transforming Business with Tailored Technology SolutionsProsigns
Unlocking Business Potential: Tailored Technology Solutions by Prosigns
Discover how Prosigns, a leading technology solutions provider, partners with businesses to drive innovation and success. Our presentation showcases our comprehensive range of services, including custom software development, web and mobile app development, AI & ML solutions, blockchain integration, DevOps services, and Microsoft Dynamics 365 support.
Custom Software Development: Prosigns specializes in creating bespoke software solutions that cater to your unique business needs. Our team of experts works closely with you to understand your requirements and deliver tailor-made software that enhances efficiency and drives growth.
Web and Mobile App Development: From responsive websites to intuitive mobile applications, Prosigns develops cutting-edge solutions that engage users and deliver seamless experiences across devices.
AI & ML Solutions: Harnessing the power of Artificial Intelligence and Machine Learning, Prosigns provides smart solutions that automate processes, provide valuable insights, and drive informed decision-making.
Blockchain Integration: Prosigns offers comprehensive blockchain solutions, including development, integration, and consulting services, enabling businesses to leverage blockchain technology for enhanced security, transparency, and efficiency.
DevOps Services: Prosigns' DevOps services streamline development and operations processes, ensuring faster and more reliable software delivery through automation and continuous integration.
Microsoft Dynamics 365 Support: Prosigns provides comprehensive support and maintenance services for Microsoft Dynamics 365, ensuring your system is always up-to-date, secure, and running smoothly.
Learn how our collaborative approach and dedication to excellence help businesses achieve their goals and stay ahead in today's digital landscape. From concept to deployment, Prosigns is your trusted partner for transforming ideas into reality and unlocking the full potential of your business.
Join us on a journey of innovation and growth. Let's partner for success with Prosigns.
Essentials of Automations: The Art of Triggers and Actions in FMESafe Software
In this second installment of our Essentials of Automations webinar series, we’ll explore the landscape of triggers and actions, guiding you through the nuances of authoring and adapting workspaces for seamless automations. Gain an understanding of the full spectrum of triggers and actions available in FME, empowering you to enhance your workspaces for efficient automation.
We’ll kick things off by showcasing the most commonly used event-based triggers, introducing you to various automation workflows like manual triggers, schedules, directory watchers, and more. Plus, see how these elements play out in real scenarios.
Whether you’re tweaking your current setup or building from the ground up, this session will arm you with the tools and insights needed to transform your FME usage into a powerhouse of productivity. Join us to discover effective strategies that simplify complex processes, enhancing your productivity and transforming your data management practices with FME. Let’s turn complexity into clarity and make your workspaces work wonders!
Top 7 Unique WhatsApp API Benefits | Saudi ArabiaYara Milbes
Discover the transformative power of the WhatsApp API in our latest SlideShare presentation, "Top 7 Unique WhatsApp API Benefits." In today's fast-paced digital era, effective communication is crucial for both personal and professional success. Whether you're a small business looking to enhance customer interactions or an individual seeking seamless communication with loved ones, the WhatsApp API offers robust capabilities that can significantly elevate your experience.
In this presentation, we delve into the top 7 distinctive benefits of the WhatsApp API, provided by the leading WhatsApp API service provider in Saudi Arabia. Learn how to streamline customer support, automate notifications, leverage rich media messaging, run scalable marketing campaigns, integrate secure payments, synchronize with CRM systems, and ensure enhanced security and privacy.
Innovating Inference - Remote Triggering of Large Language Models on HPC Clus...Globus
Large Language Models (LLMs) are currently the center of attention in the tech world, particularly for their potential to advance research. In this presentation, we'll explore a straightforward and effective method for quickly initiating inference runs on supercomputers using the vLLM tool with Globus Compute, specifically on the Polaris system at ALCF. We'll begin by briefly discussing the popularity and applications of LLMs in various fields. Following this, we will introduce the vLLM tool, and explain how it integrates with Globus Compute to efficiently manage LLM operations on Polaris. Attendees will learn the practical aspects of setting up and remotely triggering LLMs from local machines, focusing on ease of use and efficiency. This talk is ideal for researchers and practitioners looking to leverage the power of LLMs in their work, offering a clear guide to harnessing supercomputing resources for quick and effective LLM inference.
Providing Globus Services to Users of JASMIN for Environmental Data AnalysisGlobus
JASMIN is the UK’s high-performance data analysis platform for environmental science, operated by STFC on behalf of the UK Natural Environment Research Council (NERC). In addition to its role in hosting the CEDA Archive (NERC’s long-term repository for climate, atmospheric science & Earth observation data in the UK), JASMIN provides a collaborative platform to a community of around 2,000 scientists in the UK and beyond, providing nearly 400 environmental science projects with working space, compute resources and tools to facilitate their work. High-performance data transfer into and out of JASMIN has always been a key feature, with many scientists bringing model outputs from supercomputers elsewhere in the UK, to analyse against observational or other model data in the CEDA Archive. A growing number of JASMIN users are now realising the benefits of using the Globus service to provide reliable and efficient data movement and other tasks in this and other contexts. Further use cases involve long-distance (intercontinental) transfers to and from JASMIN, and collecting results from a mobile atmospheric radar system, pushing data to JASMIN via a lightweight Globus deployment. We provide details of how Globus fits into our current infrastructure, our experience of the recent migration to GCSv5.4, and of our interest in developing use of the wider ecosystem of Globus services for the benefit of our user community.
Globus Compute wth IRI Workflows - GlobusWorld 2024Globus
As part of the DOE Integrated Research Infrastructure (IRI) program, NERSC at Lawrence Berkeley National Lab and ALCF at Argonne National Lab are working closely with General Atomics on accelerating the computing requirements of the DIII-D experiment. As part of the work the team is investigating ways to speedup the time to solution for many different parts of the DIII-D workflow including how they run jobs on HPC systems. One of these routes is looking at Globus Compute as a way to replace the current method for managing tasks and we describe a brief proof of concept showing how Globus Compute could help to schedule jobs and be a tool to connect compute at different facilities.
The Art Of Performance Tuning - with presenter notes!
1. the art of
performance tuning
Jonathan Ross
Hello there, readers at home! These are the slides I used for my “Art of Performance Tuning” talk at Java One 2017. My
apologies for not sharing them as a power point file - I had some technical difficulties. My slides (done in Apple’s Keynote app)
are using the XKCD font, and there is no way of embedding the font using the Mac version of Power point (and most people
don’t have Keynote installed either.)
Ah well, at least these presenter notes are good for something.
The code for the demo is available at https://github.com/JoroRoss/art-of-performance.
2. the art of
performance tuning
Jonathan Ross
science
engineering
Of course, the title of the talk is all wrong. The original talk was called “The art of Java Performance”, but ‘Java’ seemed a bit
redundant at a JAVA conference. We’re not tuning the JVM as such (this is not a GC tuning talk), so ‘engineering’ is a better
match. Finally performance engineers should follow the scientific method, so ‘science’ is a better choice of word than ‘art’.
3. trading company
big in options and futures
based in Amsterdam
imc Trading
I’ve worked at IMC for 19 years. IMC is a proprietary trading firm founded in Amsterdam some 25+ years ago. We’re big in HFT.
4. me
Playing with JVMs since 1997
Paid to do so by IMC Chicago
Theoretical physics background
CJUG board member
JCP associate member
@JoroRoss
As for me, I’ve been messing around with JVMs for quite some time. A lot of my work at IMC is in quantitative engineering,
writing numerical algorithms and the likes. But I also spend plenty of time on architecture and performance engineering.
5. it’s too slow
Why this talk? In my work, I’m often asked to look at performance issues by other developers.
6. have you tried profiling it?
it’s too slow
When I ask what they have done to investigate so far, I am surprised by the lack of a plan-of-attack. In particular the lack of measurements and
the tendency to try changes on a hunch stick out.
In my experience too many developers have little to no experience with micro benchmarks or profilers.
7. this talk
Part 1: theory
• challenges
• methodology
• implementation
Part 2: practice
• how to use a profiler
• hands-on jmh benchmarks
“Theory” in the sense of “not practice”
In this talk, I’ll present an approach to measuring and monitoring performance, and give you some hands-on demonstrations of
micro-benchmarking and profiling.
Show of hands: who regularly uses a profiler? JMH?
Target audience: if your name is Martin Thompson or Kirk Pepperdine, you probably won’t learn anything new during the next 45
minutes. This talk is for the rest of us.
Disclaimer: while it is a very important part of java performance tuning…
8. this talk
is not about gc tuning
Part 1: theory
• challenges
• methodology
• implementation
Part 2: practice
• how to use a profiler
• hands-on jmh benchmarks
…this talk is not about GC tuning. Or at least, it will not focus on it. For argument’s sake, lets say that you have already seen all
of Gil and Kirks talks and your allocation charts are flat lining and your par-new collects are measured in the milli-seconds rather
than the seconds. Or, perhaps more realistically, that after some tuning, you have determined that it is no longer your number
one bottleneck.
10. challenges
objects
modern cpus
lack of determinism
virtualization
tooling
ignorance
confirmation bias
premature optimisation
over-engineering
legacy
Technical and non-technical challenges to Java performance engineering.
technical side:
- Everything is an object - pointer chasing, no fine grained-control over memory layout
- Modern hardware - this ain’t your grandfather’s Turing machine
- Lack of determinism: Garbage collector, JIT, (interaction with) other processes (!)
- Virtualization - illusions of the JVM - it’s hard to strip away the layers of indirection and find out what is actually going on (also/
in particular for the tools)
- Tooling (or a lack thereof) - tools suffer from the same technical difficulties. Biases.
11. challenges
ignorance
confirmation bias
premature optimisation
over-engineering
legacy
objects
modern cpus
lack of determinism
virtualization
tooling
Human/organizational challenges:
- ignorance: probably the easiest to overcome (google/slashdot :P).
- confirmation bias: something I often catch myself out on. When you think you’ve found a bottleneck and have sunk time into a fix, it can be
hard to reject it. “To assume is to make an ass of you and me.”
- premature optimization - 80/20 rule (Pareto principle) - “roughly 80% of the effects come from 20% of the causes” (more like 1% in java
perf?) Problem with optimization - trade-off: performance vs. maintainability/legibility
- ‘over-engineering’ (see also legacy) - hard to refactor bells and whistles
- legacy: legacy code, legacy ways of doing things.
12. Methodology
find a (proxy) metric for
implement
automate
“success”
a way of measuring it
a way of monitoring it
This is really the scientific method in disguise. Monitoring is a CS/accountability twist.
This methodology holds for any engineering task, not just java performance engineering.
13. implementation
make it easy to
find root causes using
fix and add regression
tests using
learn to use and
understand
reproduce issues
production metrics
macro benchmarks
micro benchmarks
profilers
Repeatability/reproducibility is key.
This is best done if you build these systems into your architecture from the get-go, for instance as an event-sourced architecture.
Chances are you are dealing with legacy systems… Well, you can always profile in production…
14. implementation
make it easy to
find root causes using
fix and add regression
tests using
learn to use and
understand
if the going gets tough
reproduce issues
production metrics
macro benchmarks
micro benchmarks
profilers
-XX+UnlockDiagnosticVMOptions
-XX:+LogCompilation
-XX:+PrintAssembly
When the going gets tough (which is not that often – most performance issues I investigate tend to be solvable without diving too deep), you can do
JIT compilation and use tools like JitWatch.
Perhaps good to point out that you should also look beyond the JVM, indeed you should always start your investigations outside the JVM, and look
at your system as a whole. What else is going on? Are there competing processes? Is the host healthy? Etc. etc.
15. handy-dandy flowchart
production
metrics
reproduce
in benchmark
profile
implement
fix
metrics
better?
ditch fix
nope
yup
good
enough?
nope
merge and verify
in production
yup
?
find
bottleneck?
yes sir
Try to reproduce production metrics in a repeatable benchmark. This is quite easy to achieve in event-sourced systems, but it is
not too hard to retrofit legacy systems with facilities for replaying production scenarios in a loop.
Regarding the ‘ditch fitch’ box: beware of the sunk cost fallacy and confirmation biases!
16. handy-dandy flowchart
production
metrics
reproduce
in benchmark
profile
implement
fix
metrics
better?
ditch fix
nope
yup
good
enough?
nope
merge and verify
in production
yup
?
find
bottleneck?
yes sir• try harder
• rearchitect
• seek new job
erm…
Of course there was a choice missing in the flow chart.
If you run out of low-hanging fruit, you face some more formidable challenges, often requiring a lot of rethinking rearchitecting.
19. A STORY OF ATAN
a (redacted) real world performance
tuning adventure involving my love for
math and some short-sightedness
it’s too
slow
let me try to profile it
For those of you reading along from home, the second part of this talk covers a production performance regression that I
investigated at IMC a couple of months ago. We start off with some pre-recorded screenshots of a Yourkit profiling session of a
(redacted to keep some proprietary information… proprietary), but then moves on to a live demo of profiling a JMH benchmark
using VisualVM and JMC.
The code for the demo is available at https://github.com/JoroRoss/art-of-performance.
20. To profile a production system, start your server with the JVM argument:
-agentpath:<profiler directory>/bin/linux-x86-64/libyjpagent.so
stack telemetry (Yourkit)
This example is using Yourkit - but most of the functionality I am going to show here is also available in visualvm and jmc (albeit
not quite as user friendly).
Stack telemetry is first view I check in yourkit - get a good visual feel of what the app is doing. If you know a program well, this
can be a very good way of seeing if it’s behaving normally.
21. weeding out irrelevant data
(tip: turn off filters by default)
I like to turn off all filters in my profiler. As a result, things like IO show up. Not what we’re interested in here. Exclude!
22. export threads were not supposed to be this busy…
What-if: yourkit’s drill-down is awesome. (But shark was better!)
23. ordering callees by “own time” shows us the bottleneck
Now we see the export threads at the top of the list. Selecting one, we can see info about all callees in the lower panel. I like to
sort this by ‘own time’.
24. where is the bottleneck called from?
select method back-traces
Holy moly, we’re spending 50% of the time in the export threads in StrictMath.atan
Okay, so who is calling this method? Many ways to skin a cat, here’s one of them.
25. (wouldn’t you like to know!)
2 bottlenecks for the price of one
Bonus! atan was not just a bottleneck in one branch.
The redaction is didactic - no prejudices regarding what the program is doing!
The bottleneck is clear though - the ‘export’ and ‘model’ methods are both calling the one above it (called ‘price’). Let’s focus
on it.
27. eureka!
next favorite feature: merged callees
This ‘What-if’ tab has reduced the stack frames it is considering to the ones in which our ‘PricingService.price’ method is being
called.
Merged callees: call tree of the highlighted method, from all stack frames. Really nice this, especially for recursive calls.
28. To the micro benchmarks!
(demo)
This part of the talk switches to some live coding an profiling (screenshot added for the benefit of people following along from
home.)
JMC is introduced (Java Microbenchmark Harness by Aleksey Shipilev which is part of the OpenJDK project).
Open the class FoobaratorBenchmark, Run benchmark -> ~ 2150 us
Create and run profiler benchmark (copy benchmark or edit existing one, use 100 iterations) set to fork 0 or 1 times.
Go to JVisualVM, start sample, wait, stop, save snapshot
Go to hotspot tab -> atan
-> find in call tree
we are in business! Atan is >50% of benchmark
find call site invoking it
Navigate to NormalizedAtan in IDE
29. normalizedAtan = 2
⇡ tan 1 ⇡
2 x
The normalized arctangent function is being used in the algorithm as a smooth range-limiting function. it’s linear near the origin
with a slope of 1, and goes to +-1 asymptotically.
The algorithm just needs this behaviour, but it doesn’t need the IEEE accuracy of SafeMath.atan!
30. tan 1
(x) ⇡
⇡(0.596227x + x2
)
2(1 + 1.192524x + x2)
ApproximateAtan is a rational function approximation of atan, the normalized version is accurate to within about 0.0018 rad—
this is the sort of trigonometry optimization that is very common in the gaming industry, and avoids the expense of computing
the arctangent to IEEE precision.
31. Back To the micro benchmarks!
(demo)
(Screenshot added for the benefit of people following along from home.)
The demo continues:
Run AtanBenchmark. The rational version is ~30 times faster!
Benchmark Mode Cnt Score Error Units
AtanBenchmark.approxAtan thrpt 200 348.790 ± 19.346 ops/us
AtanBenchmark.atan thrpt 200 11.119 ± 0.349 ops/us
Switch FoobarCalculator to use ApproxmiateAtan.normalizedAtan
Run benchmark - it’s actually not much faster (about 8%?)
Benchmark Mode Cnt Score Error Units
FoobaratorBenchmark.foobar avgt 200 1722.974 ± 27.549 us/op
Our profiler was lying to us! (Safe point biasing?)
32. Benchmark Mode Cnt Score Error Units
FoobaratorBenchmark.benchmark avgt 100 2164.391 ± 49.520 us/op
original
Benchmark Mode Cnt Score Error Units
FoobaratorBenchmark.benchmark avgt 100 2043.580 ± 80.292 us/op
approximate, outside loop (6%)
Benchmark Mode Cnt Score Error Units
FoobaratorBenchmark.benchmark avgt 100 1991.929 ± 50.966 us/op
approximate (8% speedup)
Benchmark Mode Cnt Score Error Units
FoobaratorBenchmark.benchmark avgt 100 2045.587 ± 55.951 us/op
precise, outside loop (6%)
The benchmarks I’m running in the demo are running a bit too quickly to provide statistically reliable results (longer = better in
benchmarking and profiling). This slide shows results for the various stages of the demo run with a few more iterations.
33. Java mission control
(demo)
(Screenshot added for the benefit of people following along from home.)
Run FlightrecorderBenchmark or AutoJFRBenchmark
Open jmc, make flight recording look at memory tab -> allocating a lot of Guava Row objects (also lambdas)
In the rest of the demo, I check out some other branches of the codebase where I have put in fixes for the memory allocation
pressure (a map of maps, avoiding using boxed doubles, avoiding using capturing lambdas - in a hot loop at least).
JFR/JMC is also lying to us - it doesn’t report samples for native methods.
Most performance gains in this demo come from reducing the allocation pressure, others come from hoisting expensive
computations out of loops/avoiding duplicate calculations. The final solution presented is not pretty, but it solves the allocation
pressure issue. The best solution for this particular algorithm would probably be to restructure the input data to be pre-
partitioned, and/or use some primitive maps like Eclipse collections.
Allocation pressure leads to more than just keeping the garbage collector busy: it also makes it very hard to use the cache lines
34. Benchmark Mode Cnt Score Error Units
FoobaratorBenchmark.benchmark avgt 100 2393.484 ± 111.872 us/op
original
Benchmark Mode Cnt Score Error Units
FoobaratorBenchmark.benchmark avgt 100 1163.414 ± 17.417 us/op
map of maps (52%)
Benchmark Mode Cnt Score Error Units
FoobaratorBenchmark.benchmark avgt 100 660.802 ± 5.795 us/op
mutable double (72%)
Benchmark Mode Cnt Score Error Units
FoobaratorBenchmark.benchmark avgt 100 894.116 ± 9.971 us/op
map of maps (2) (63%)
Benchmark Mode Cnt Score Error Units
FoobaratorBenchmark.benchmark avgt 100 547.549 ± 4.122 us/op
atan outside loop again (77%)
This slide shows results for the various stages of the JMC part of the demo run with a few more iterations.
35. challenges revisited
ignorance
confirmation bias
premature optimisation
overengineering
legacy
objects
modern cpus
lack of determinism
virtualization
tooling
We just saw most of these challenges. The last three organizational ones are tough nuts to crack. The 80-20 rule tells us not to
worry too much about performance until we’ve found an actual bottleneck, but we saw that over-engineering and legacy
codebases can make it pretty hard to deal with the actual pain points.
My experience, is that if one sticks to clean code, guided by well-chosen architectural rules of thumb, you can’t go too far
wrong. In practice, this means functional programming, and adhering to the ‘tell don’t ask’ mantra. Best practices ≠ premature
optimization.
I hope you found it interesting to hear some of my war stories.