Download as PDF, PPTX


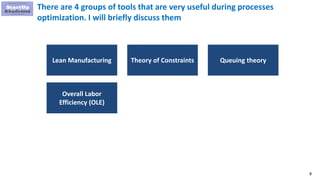


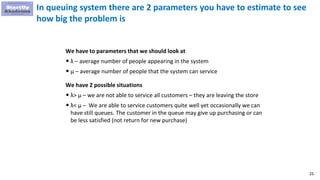


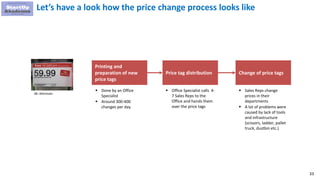


The document outlines a practical guide on optimizing processes to lower costs and improve quality, detailing a general approach, useful techniques, and a case study at a retailer. It discusses the phases of process optimization, various tools like lean manufacturing and the theory of constraints, and identifies common inefficiencies and waste. A specific case study on optimizing the price change process illustrates how process improvements can yield significant savings.