Downloaded 299 times


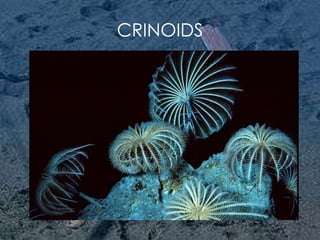
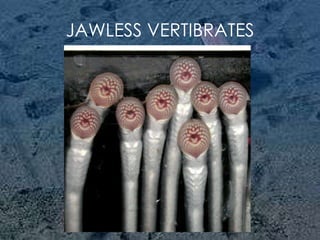
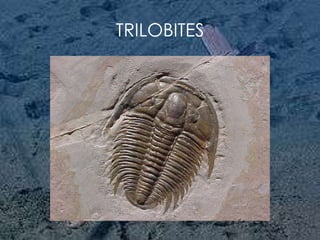
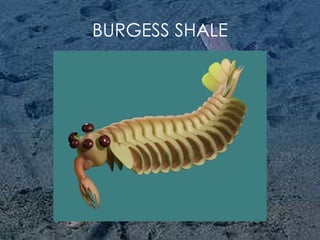


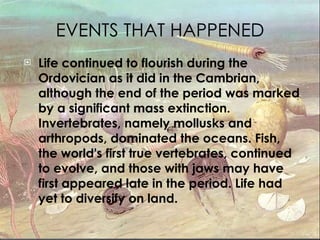


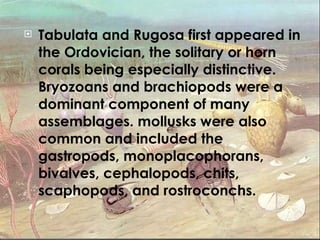


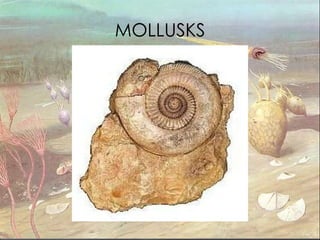


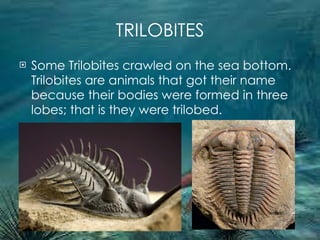


The document summarizes key aspects of the Cambrian and Ordovician periods. During the Cambrian, most major animal phyla first appear in the fossil record during the Cambrian Explosion. The continents were drifting apart and life was dominated by invertebrates like trilobites. The Ordovician saw continued diversification of life with mollusks and arthropods dominating the seas and the first jawed fish evolving, while life on land remained limited. Both periods ended with major extinction events.


