Downloaded 330 times

![Percentage inhibition
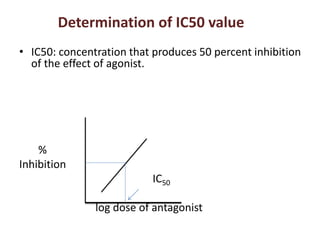
• Antagonism can also be expressed as
• % inhibition =
100- [{height of contraction after exposure to
antagonist/ height of contraction before
exposure to antagonist} x 100]](https://image.slidesharecdn.com/pa2determination-171218131133/85/Pa2-determination-8-320.jpg)
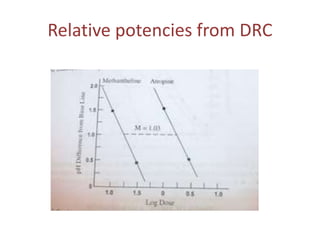
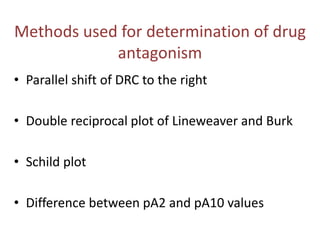
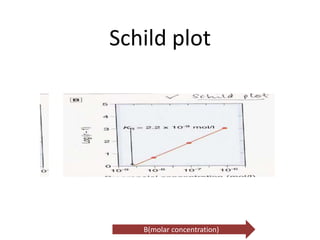
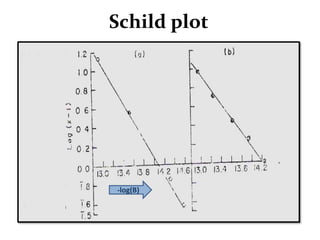
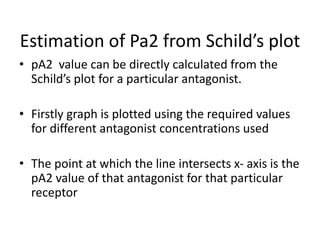
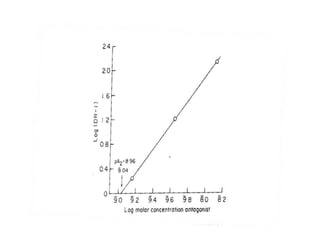
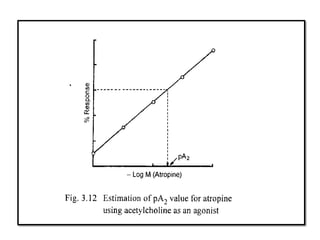
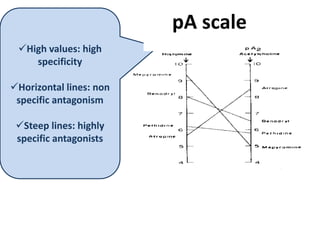


pA2 determination involves measuring drug antagonism through various methods. Sir Heinz Otto Schild developed the pA2 measure in 1947 to quantify antagonism using the dose ratio and affinity constant. The most common methods to determine pA2 values are Schild's plot, which analyzes log dose ratios against antagonist concentrations, and measuring shifts in dose response curves. Higher pA2 values indicate more specific antagonism on the pA scale. The pA2 value is defined as the negative log of the molar antagonist concentration required to double the agonist dose to produce the same effect.


![PERI-PROSTHETIC FRACTURE NAIL-PLATE CONSTRUCT [NPC].pptx](https://cdn.slidesharecdn.com/ss_thumbnails/drarunkumardrmohamedashrafperiprostheticfrasturenail-plateconstructnpc-260209164459-7e9d15a1-thumbnail.jpg?width=640&height=640&fit=bounds)


![CTEV [ clubfoot] DR ARUN LAL ,DR MOHAMED ASHRAF travancore medical college k...](https://cdn.slidesharecdn.com/ss_thumbnails/ctevclubfootdrarunlaldrmohamedashraftravancoremedicalcollegekollamkeralaindia-260208063247-18fc466c-thumbnail.jpg?width=640&height=640&fit=bounds)


