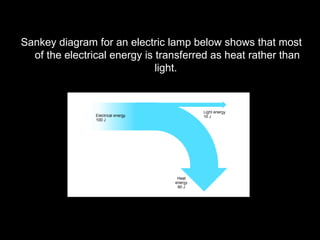
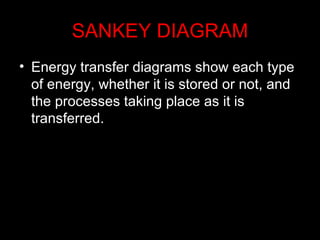
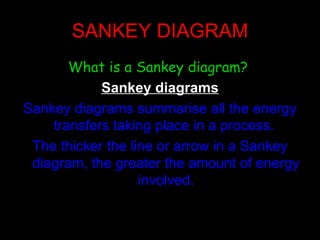
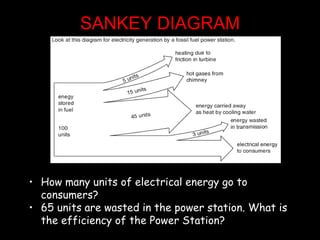
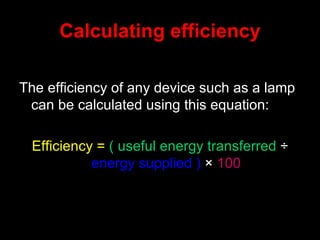
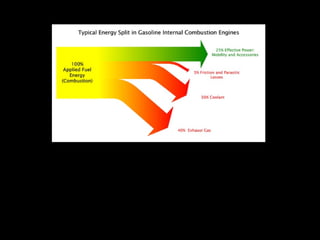
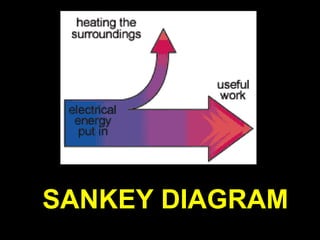
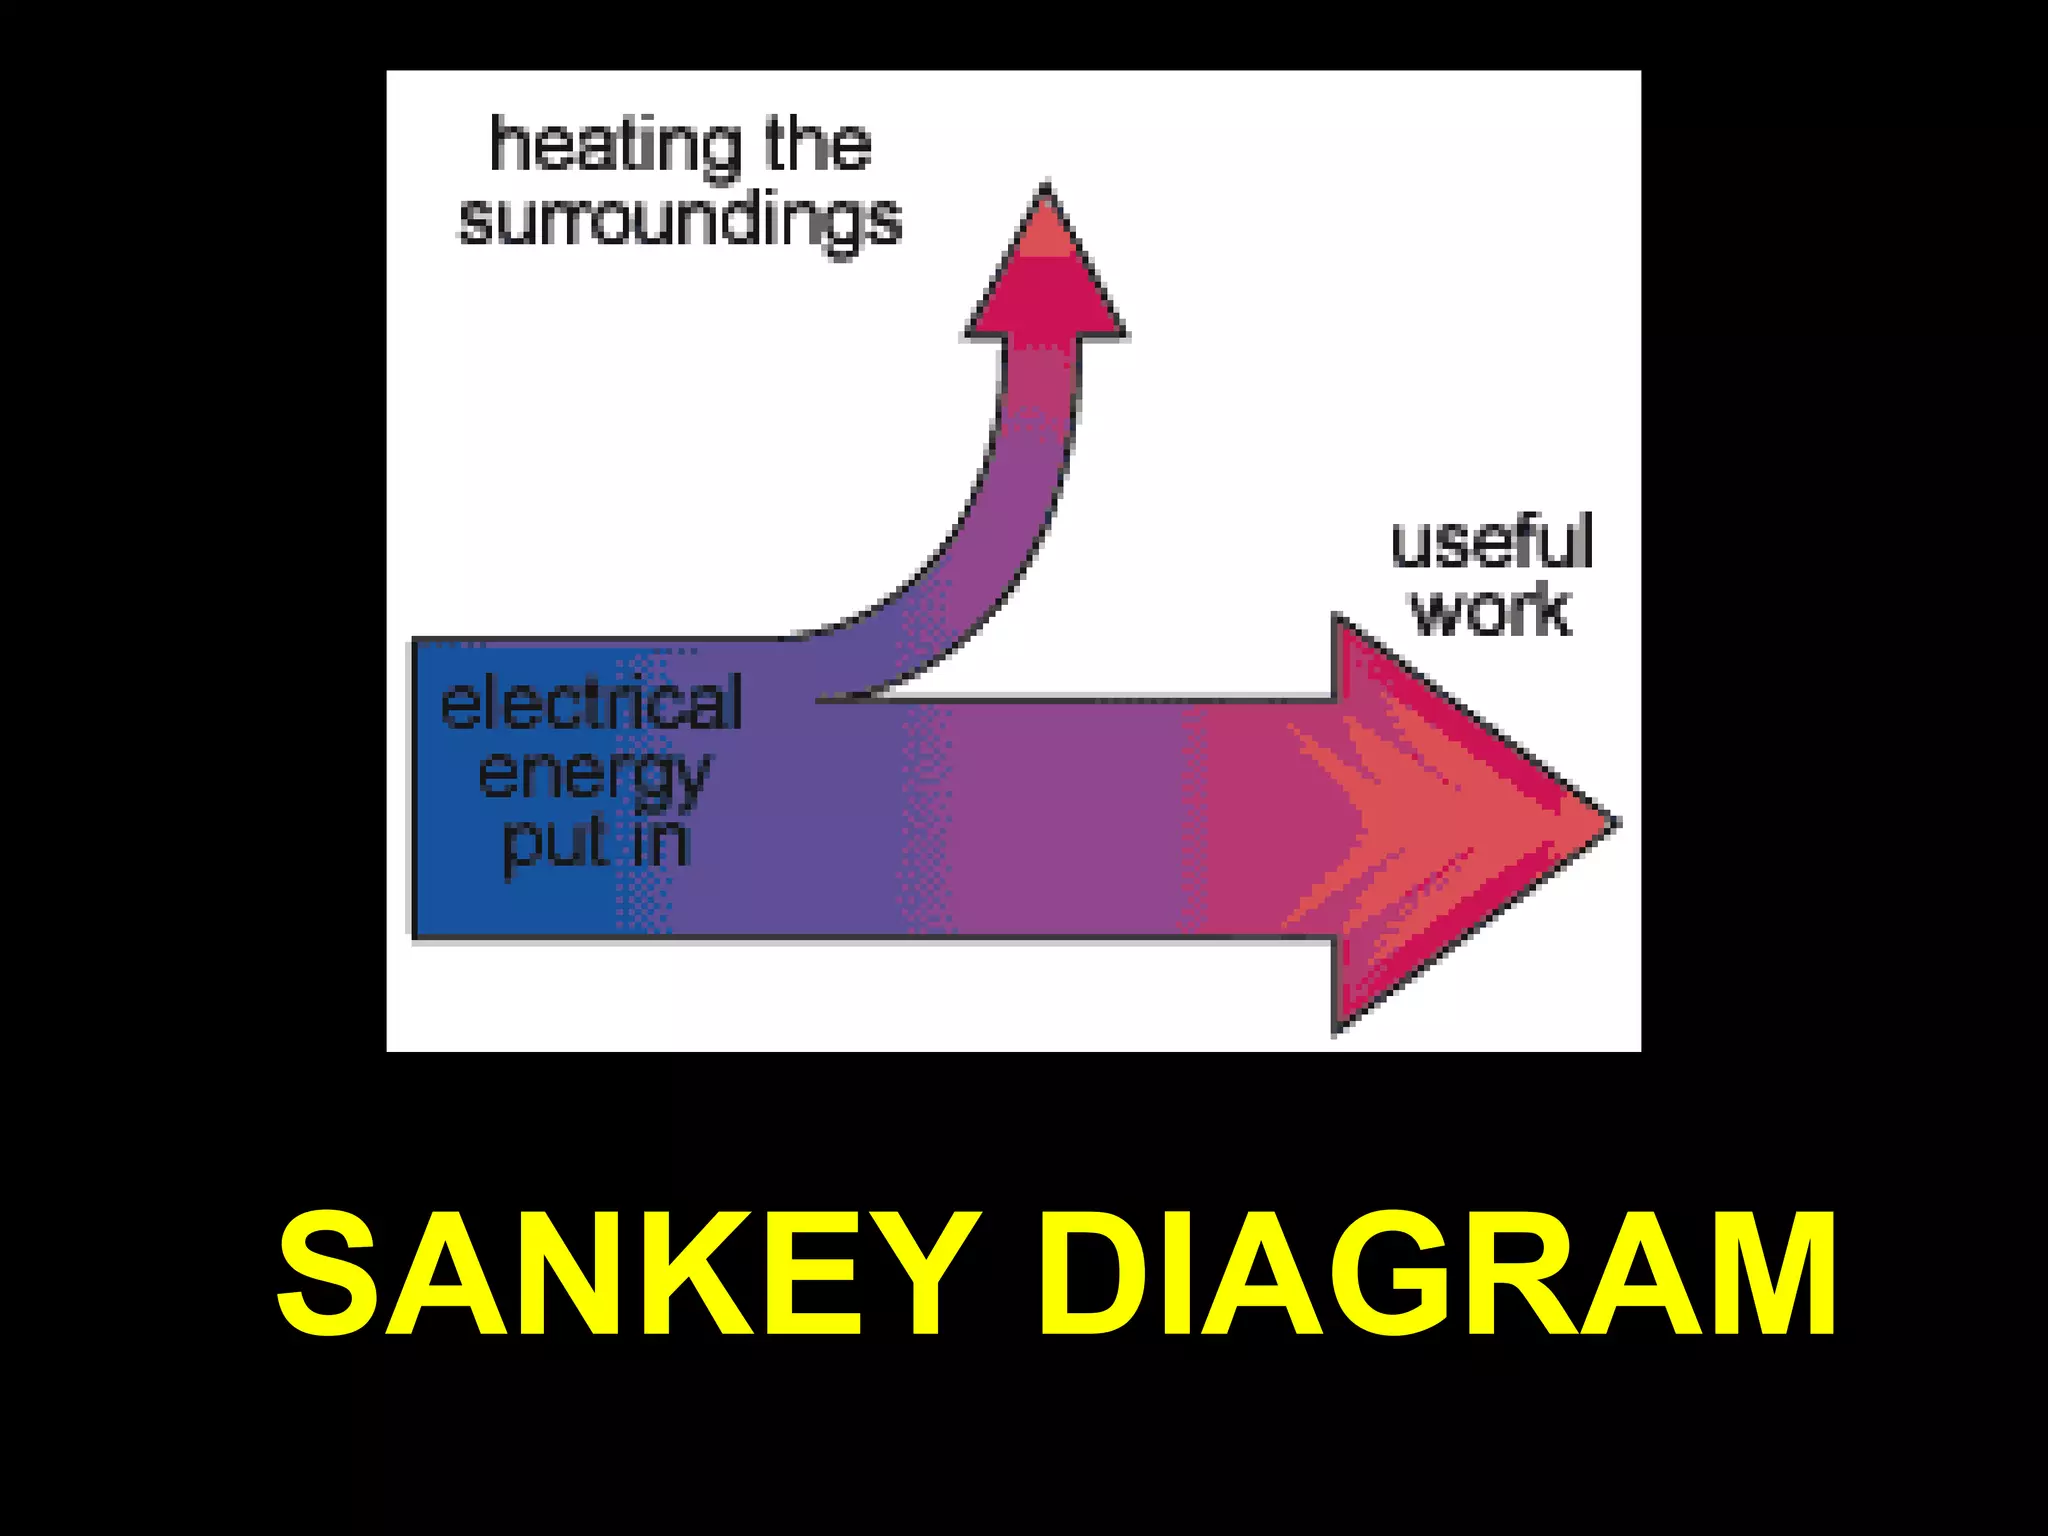
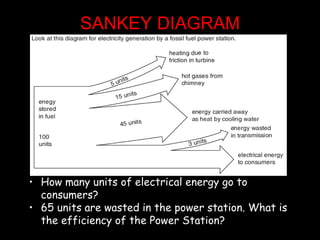
The document discusses Sankey diagrams and their use in representing energy transfers and calculating efficiency. Sankey diagrams show the different types and amounts of energy at each stage of a process. They use thicker lines to represent greater amounts of energy being transferred. The document gives an example of a Sankey diagram for electric power production that shows how much energy is wasted versus transferred to consumers. It also provides the equation for calculating efficiency based on useful energy transferred versus total energy supplied.

![ELECTRICAL POWER PRODUCTION Starter Activity GCSE 2009 A331/02 This question is about different ways of generating electricity. (a) Some ways of generating electricity use renewable sources. Put a ring around each of the two renewable sources. Coal, natural gas, oil, wave, wind [2 Marks] b) Explain the term renewable and non-renewable energy.](https://image.slidesharecdn.com/p3electricalpowerproduction-110219045717-phpapp01/85/P3-ELECTRICAL-POWER-4-320.jpg)