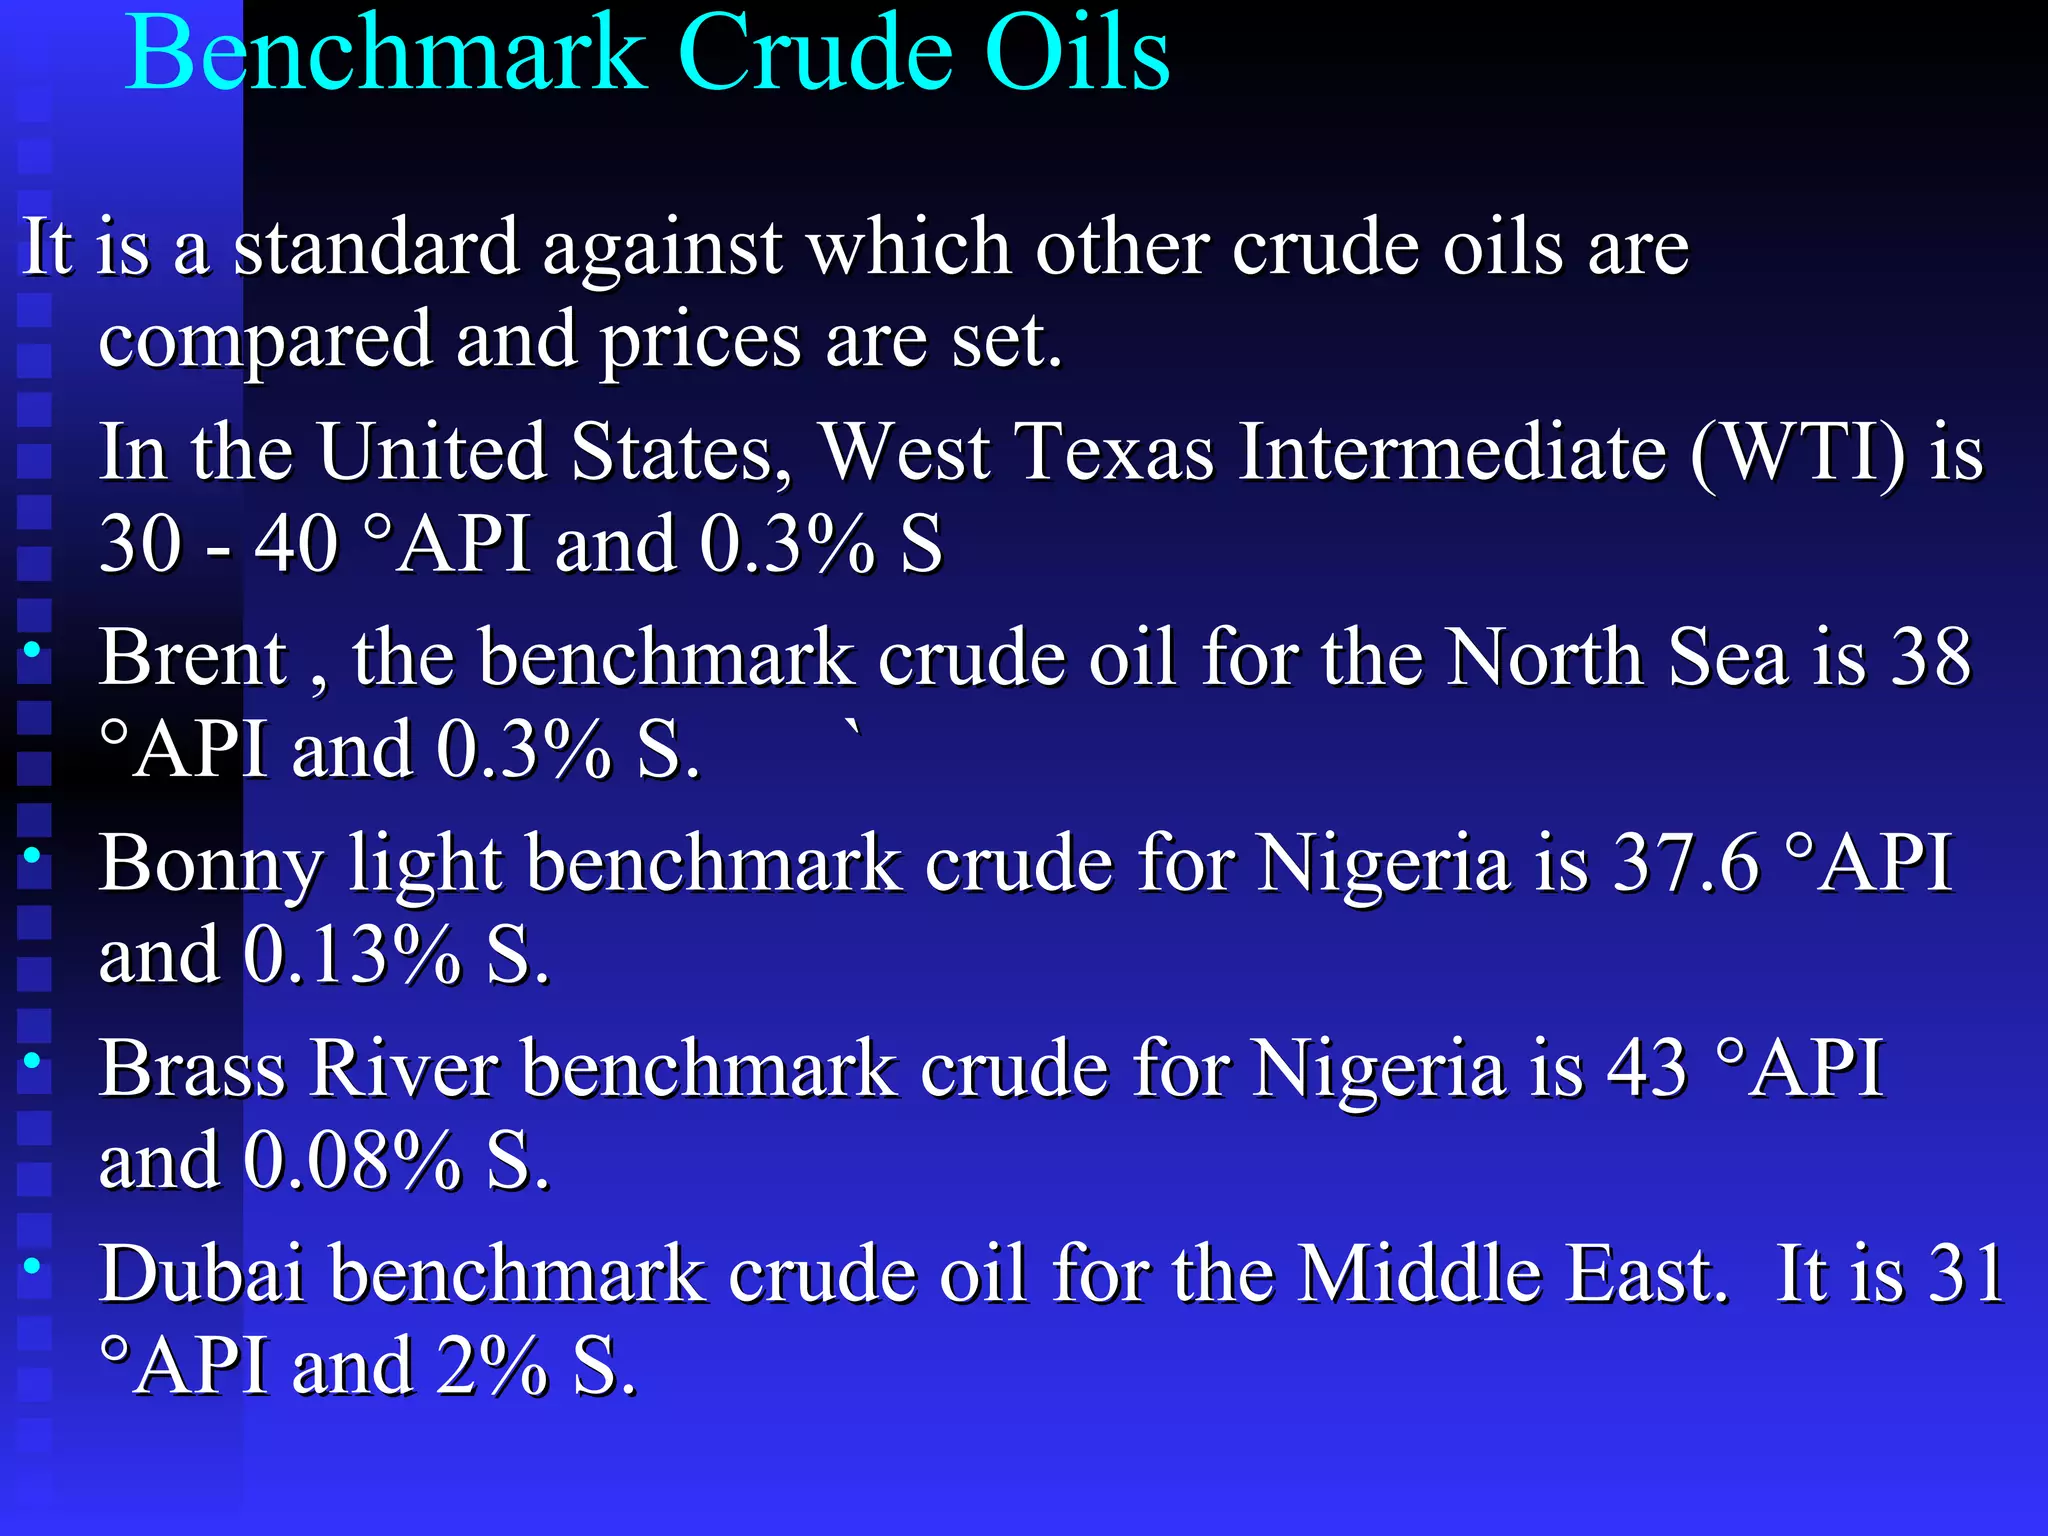
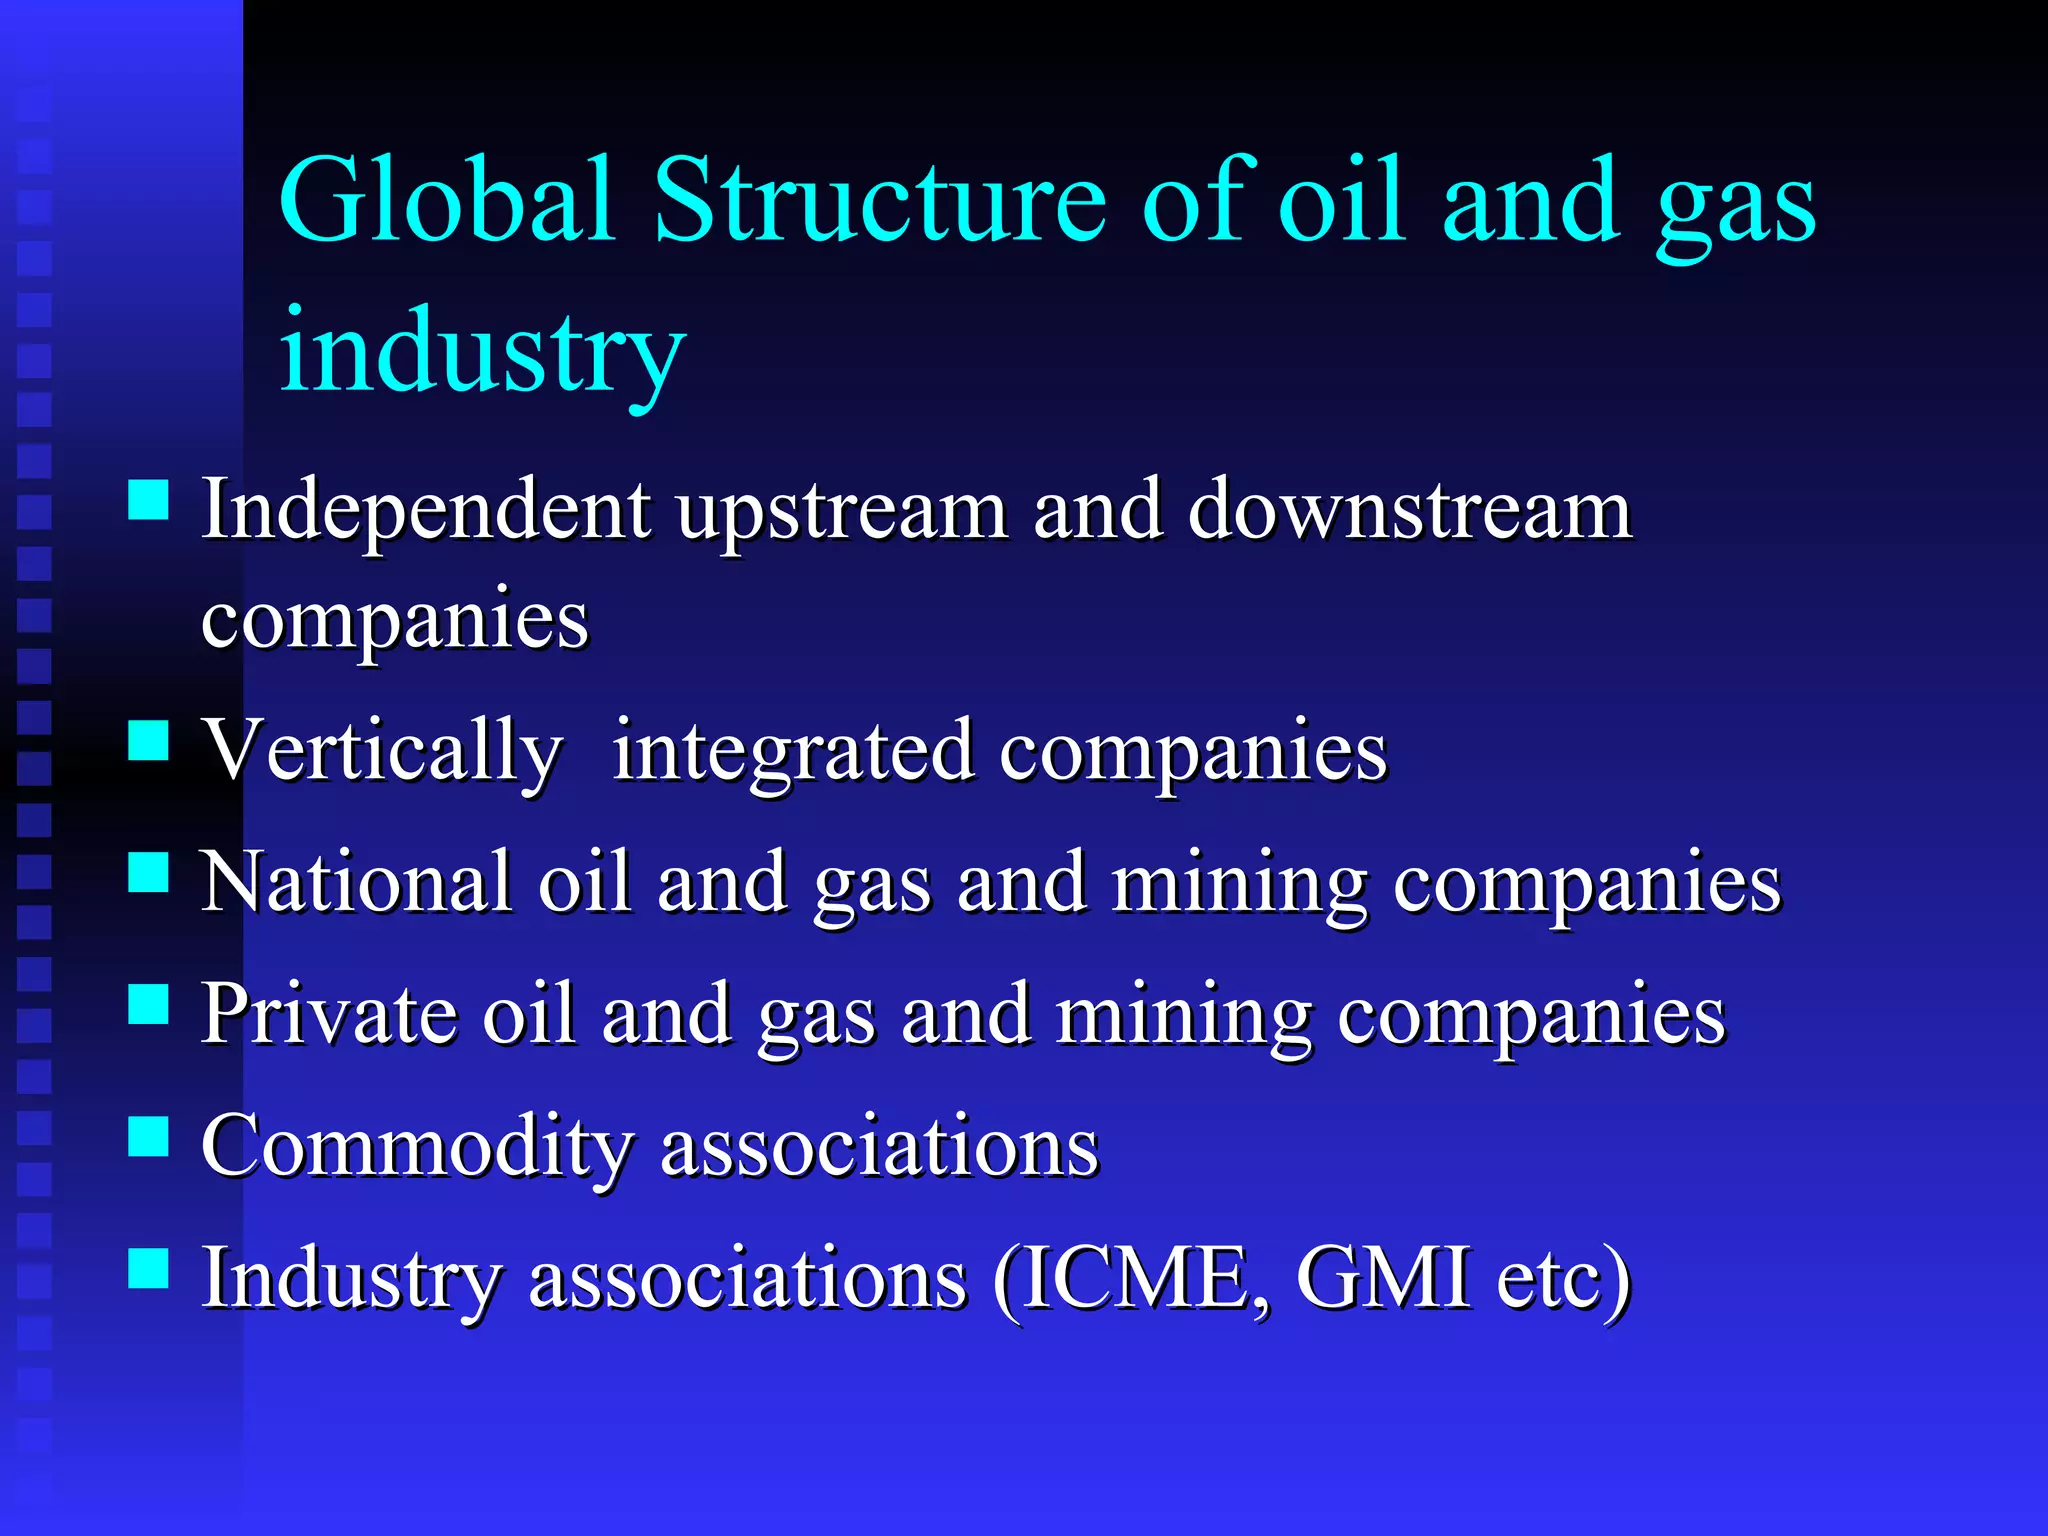
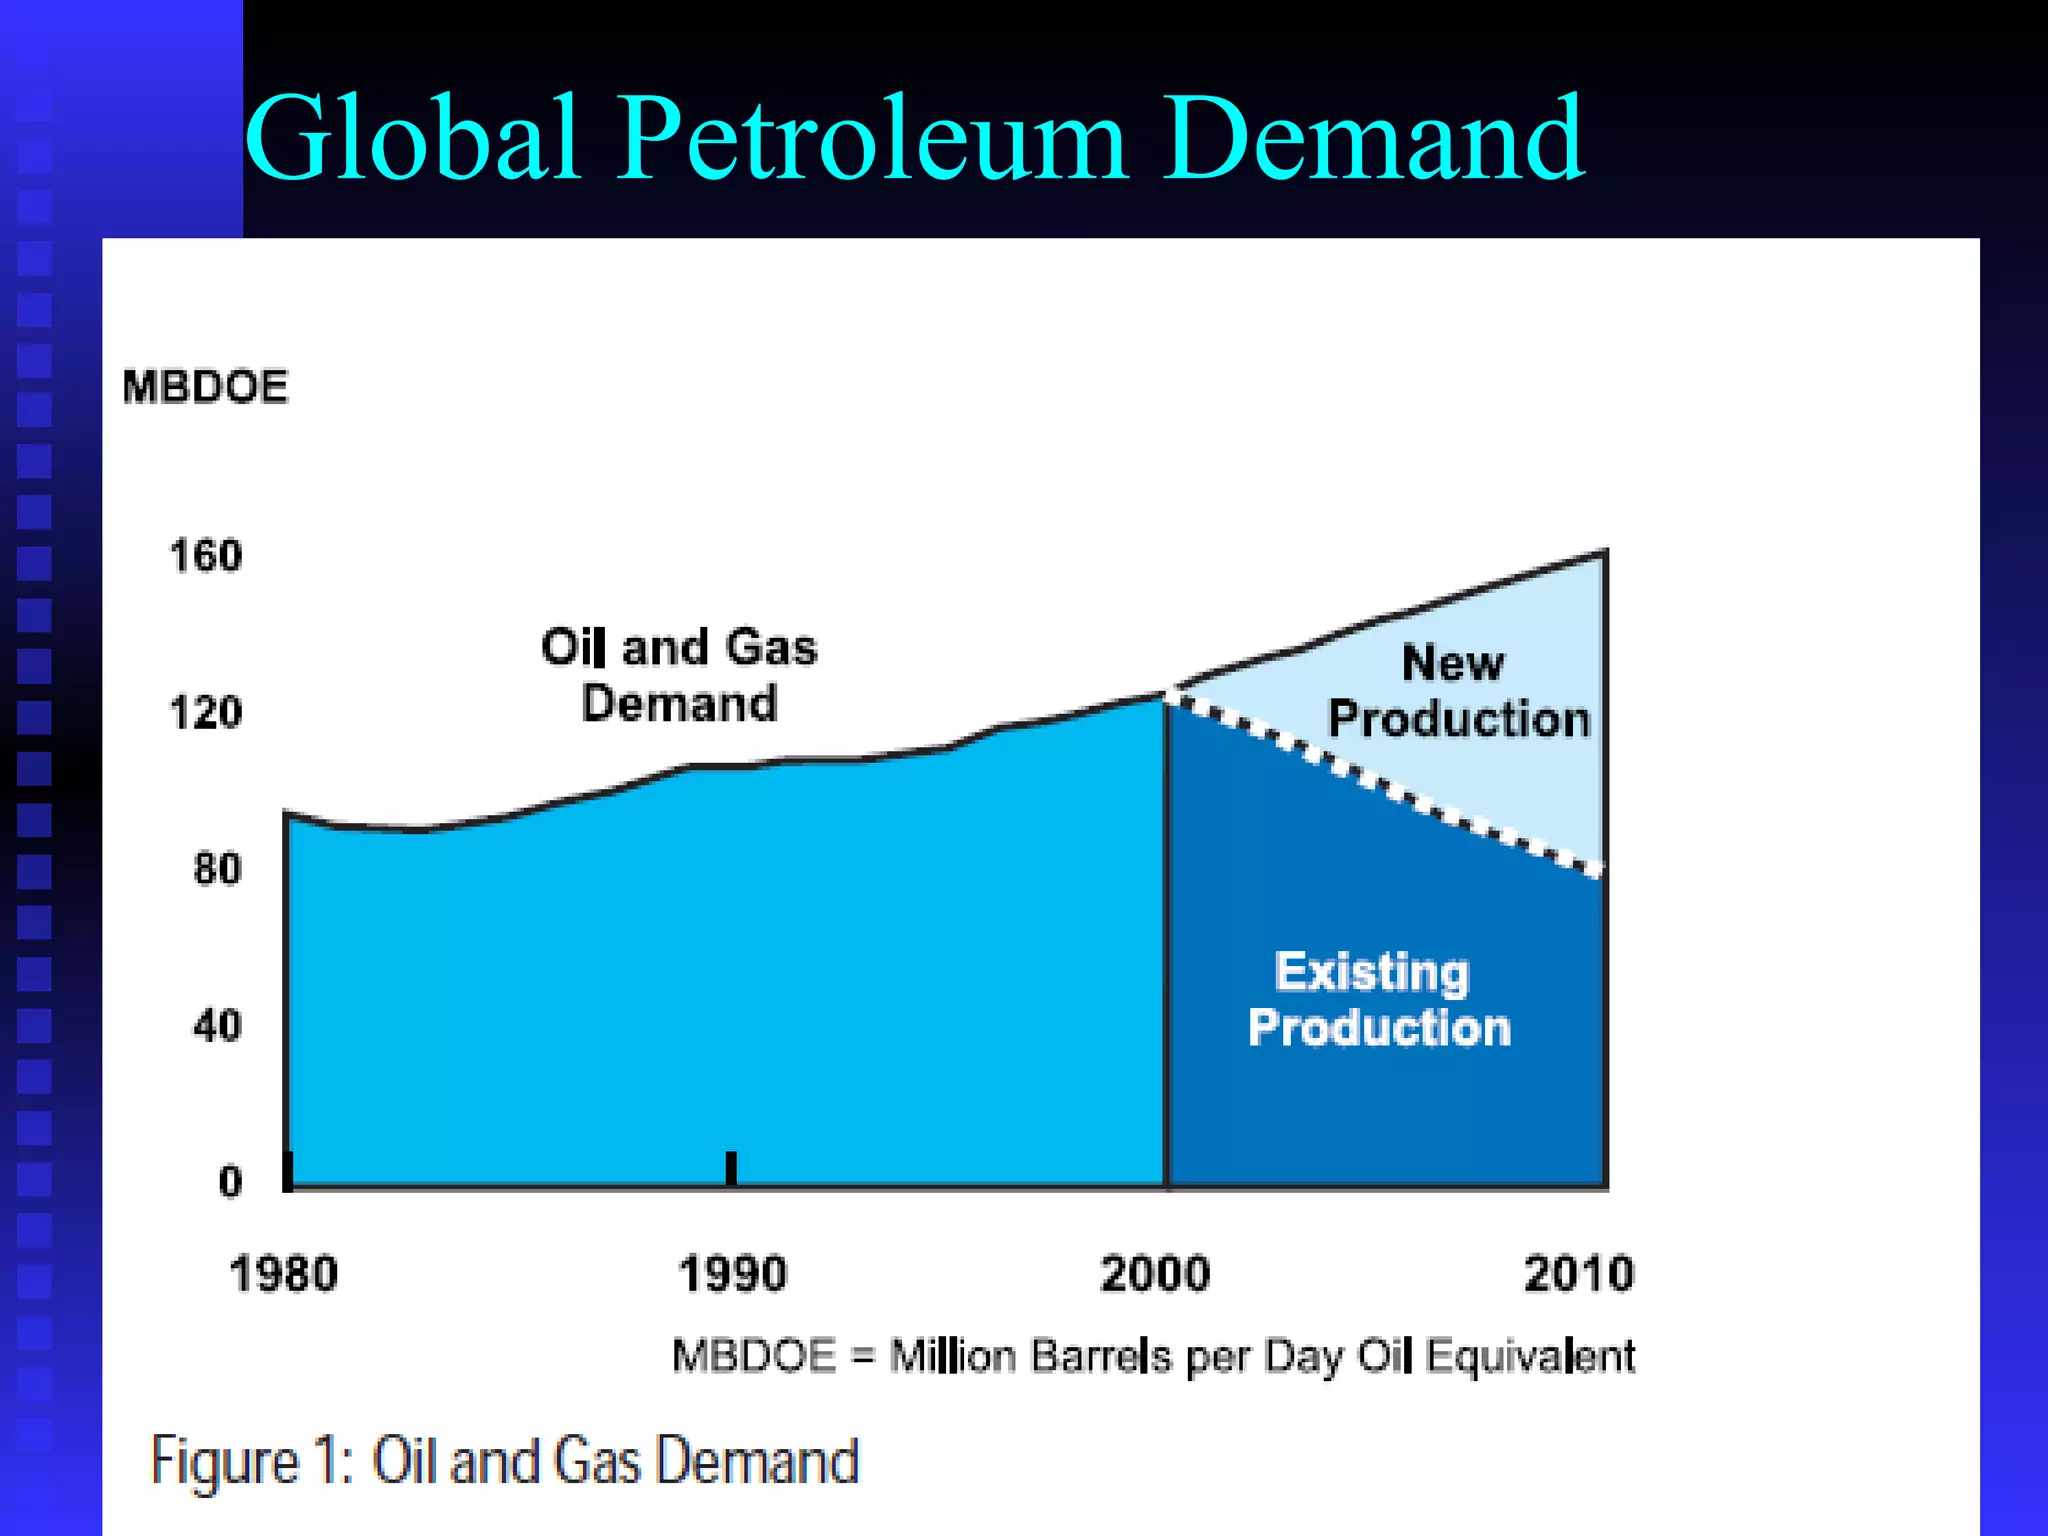
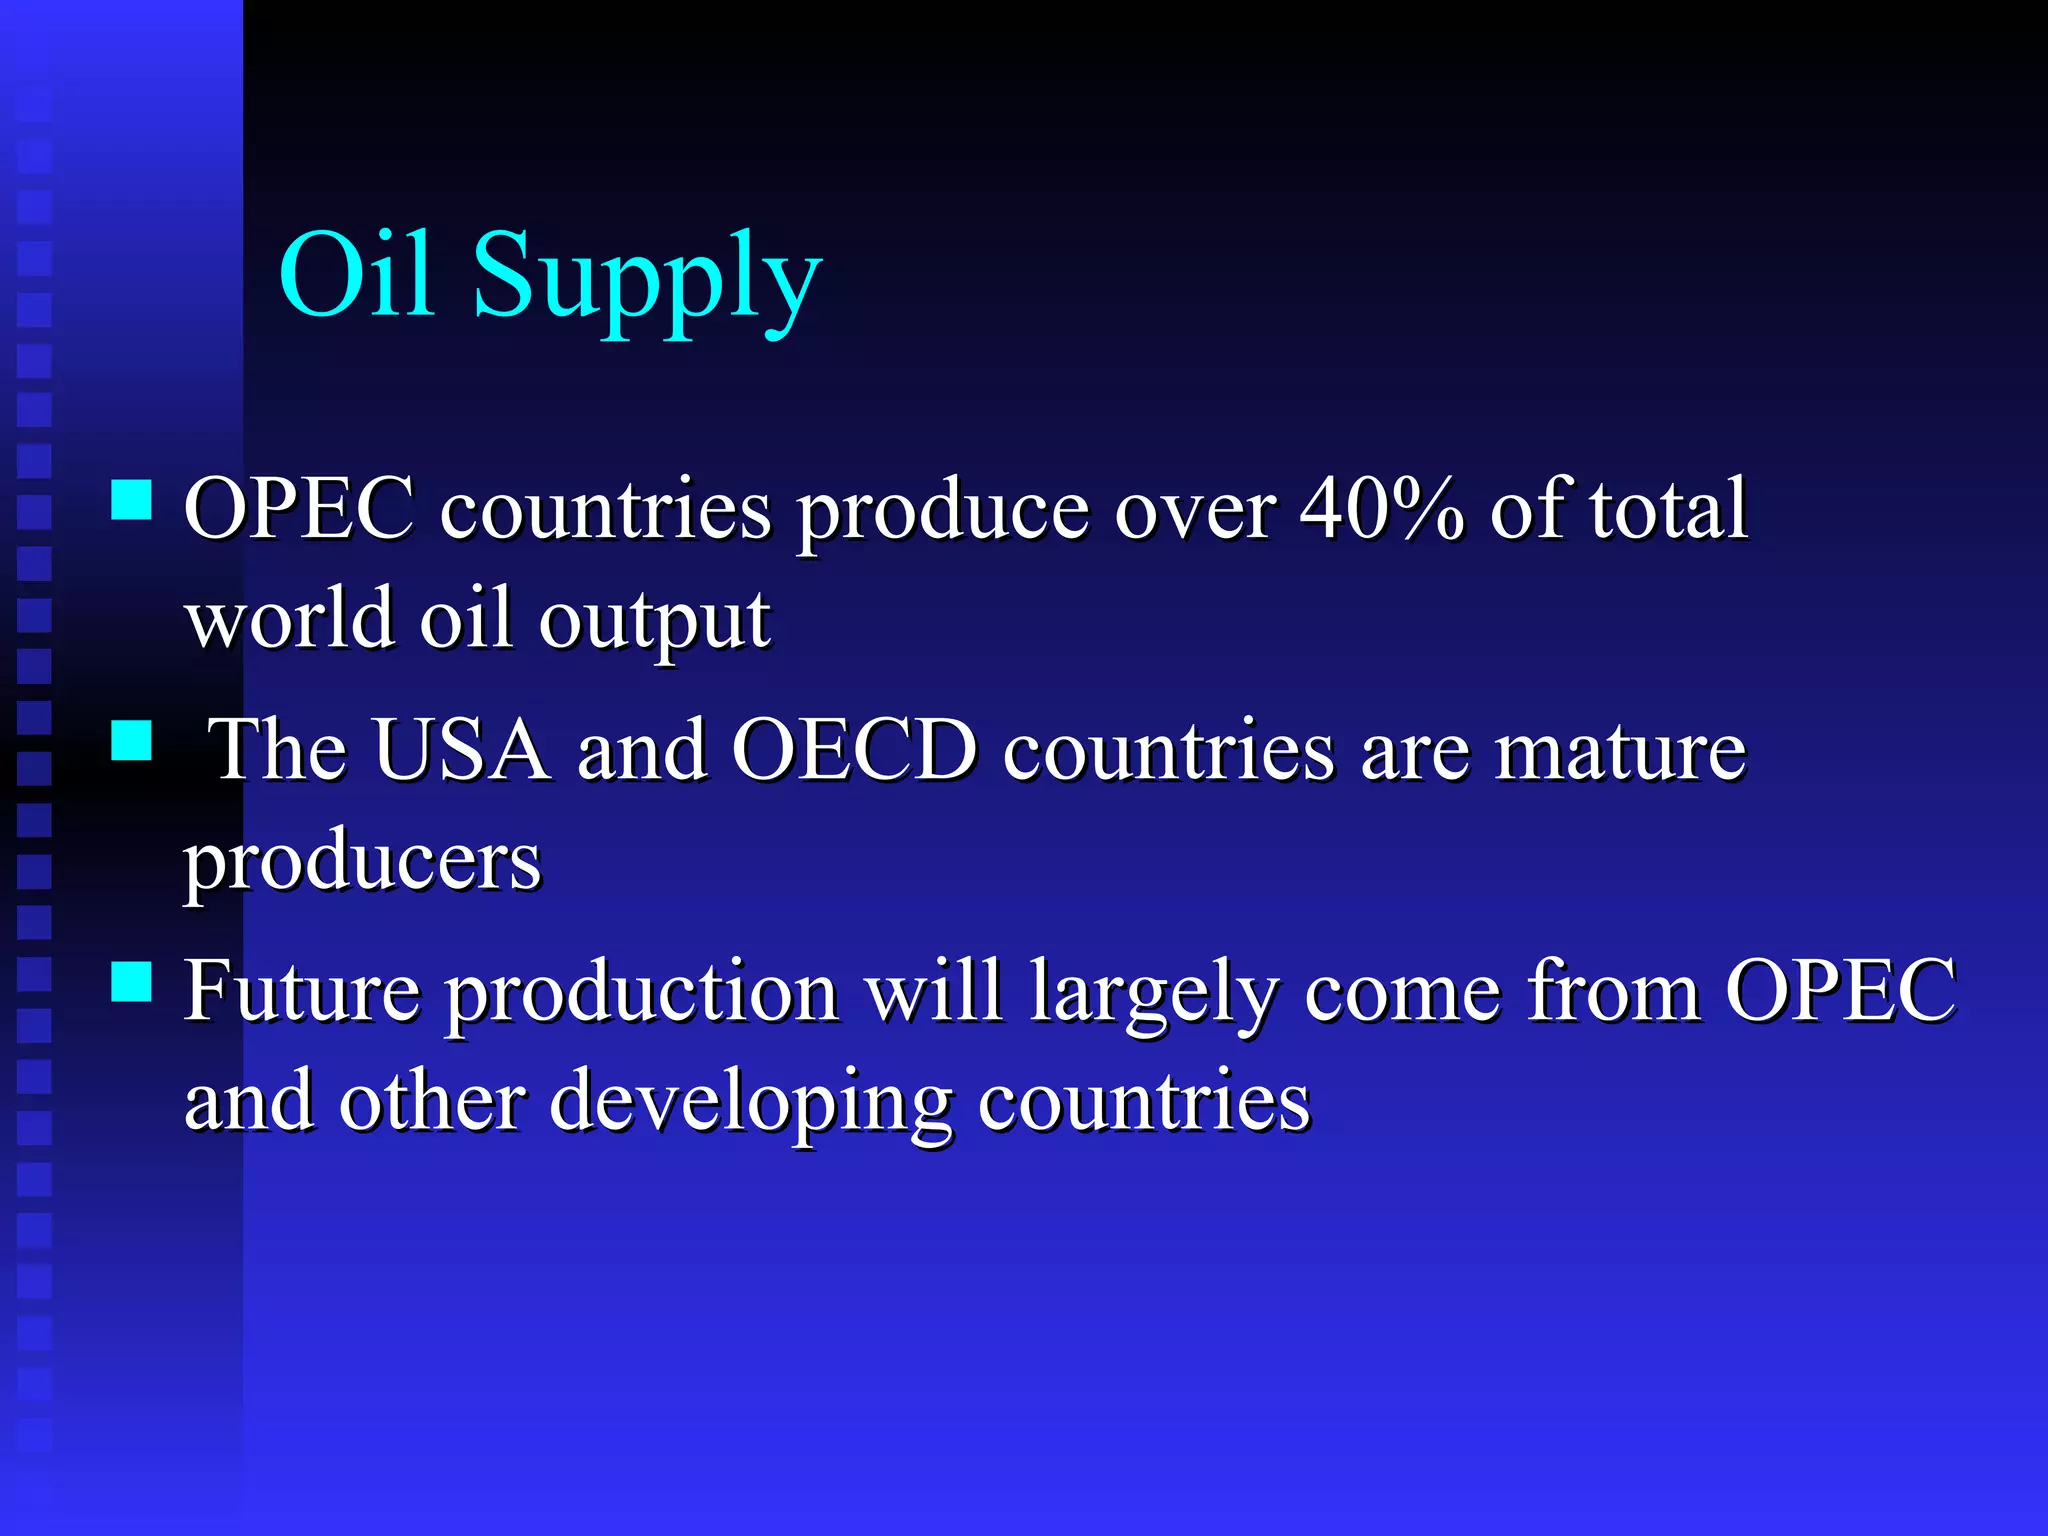
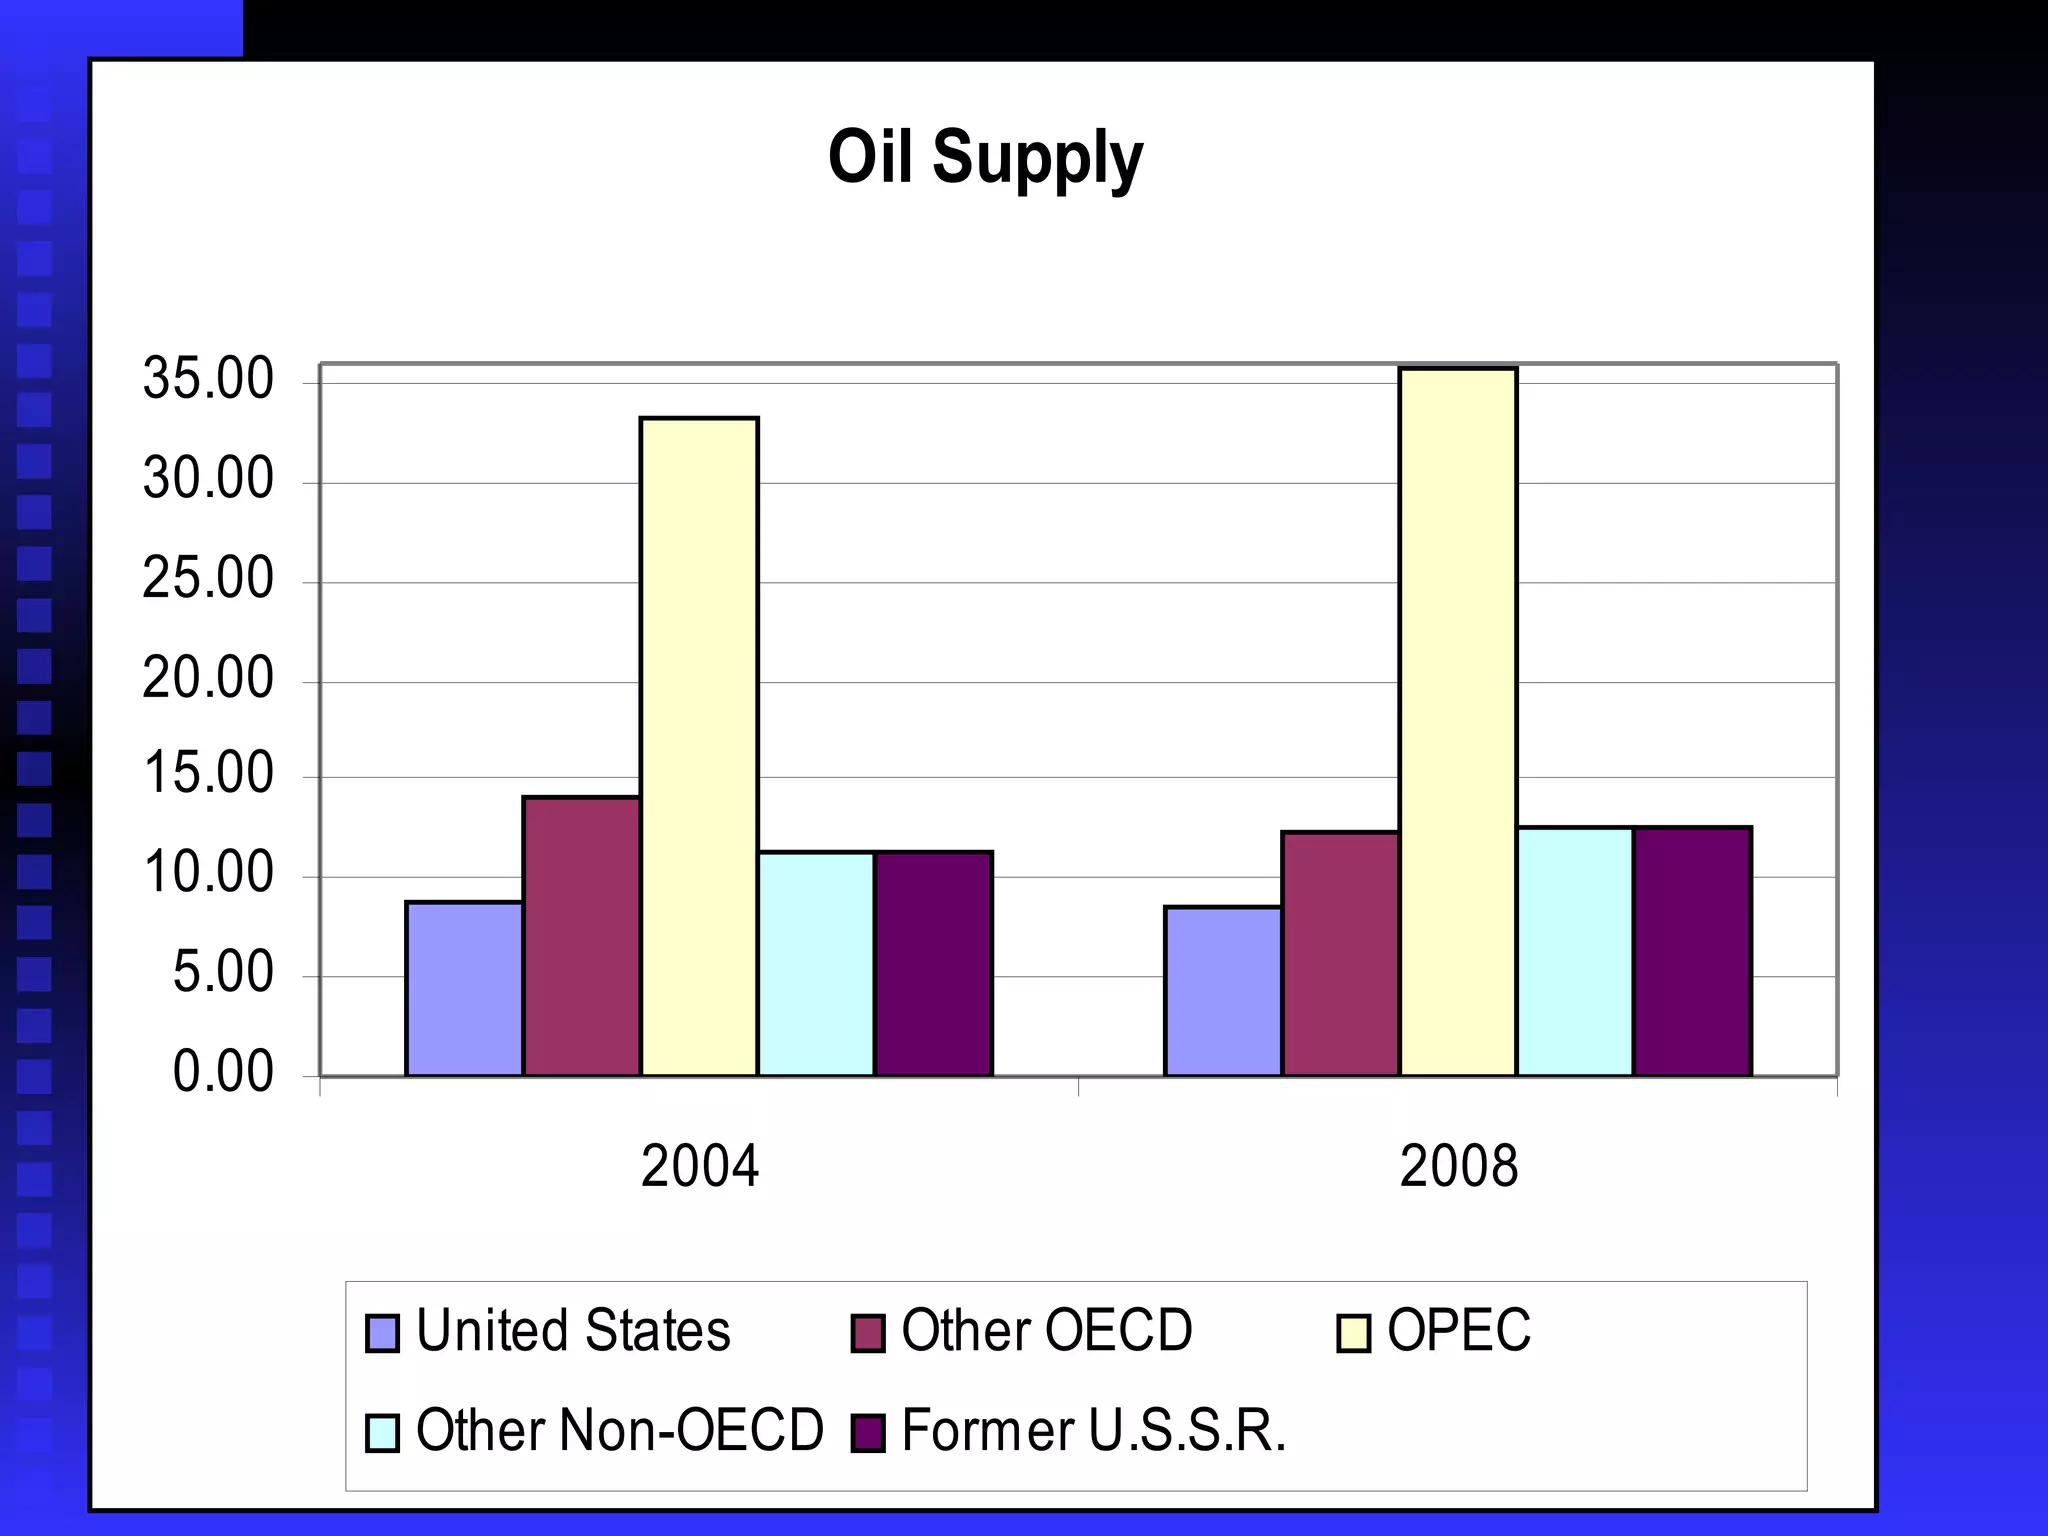
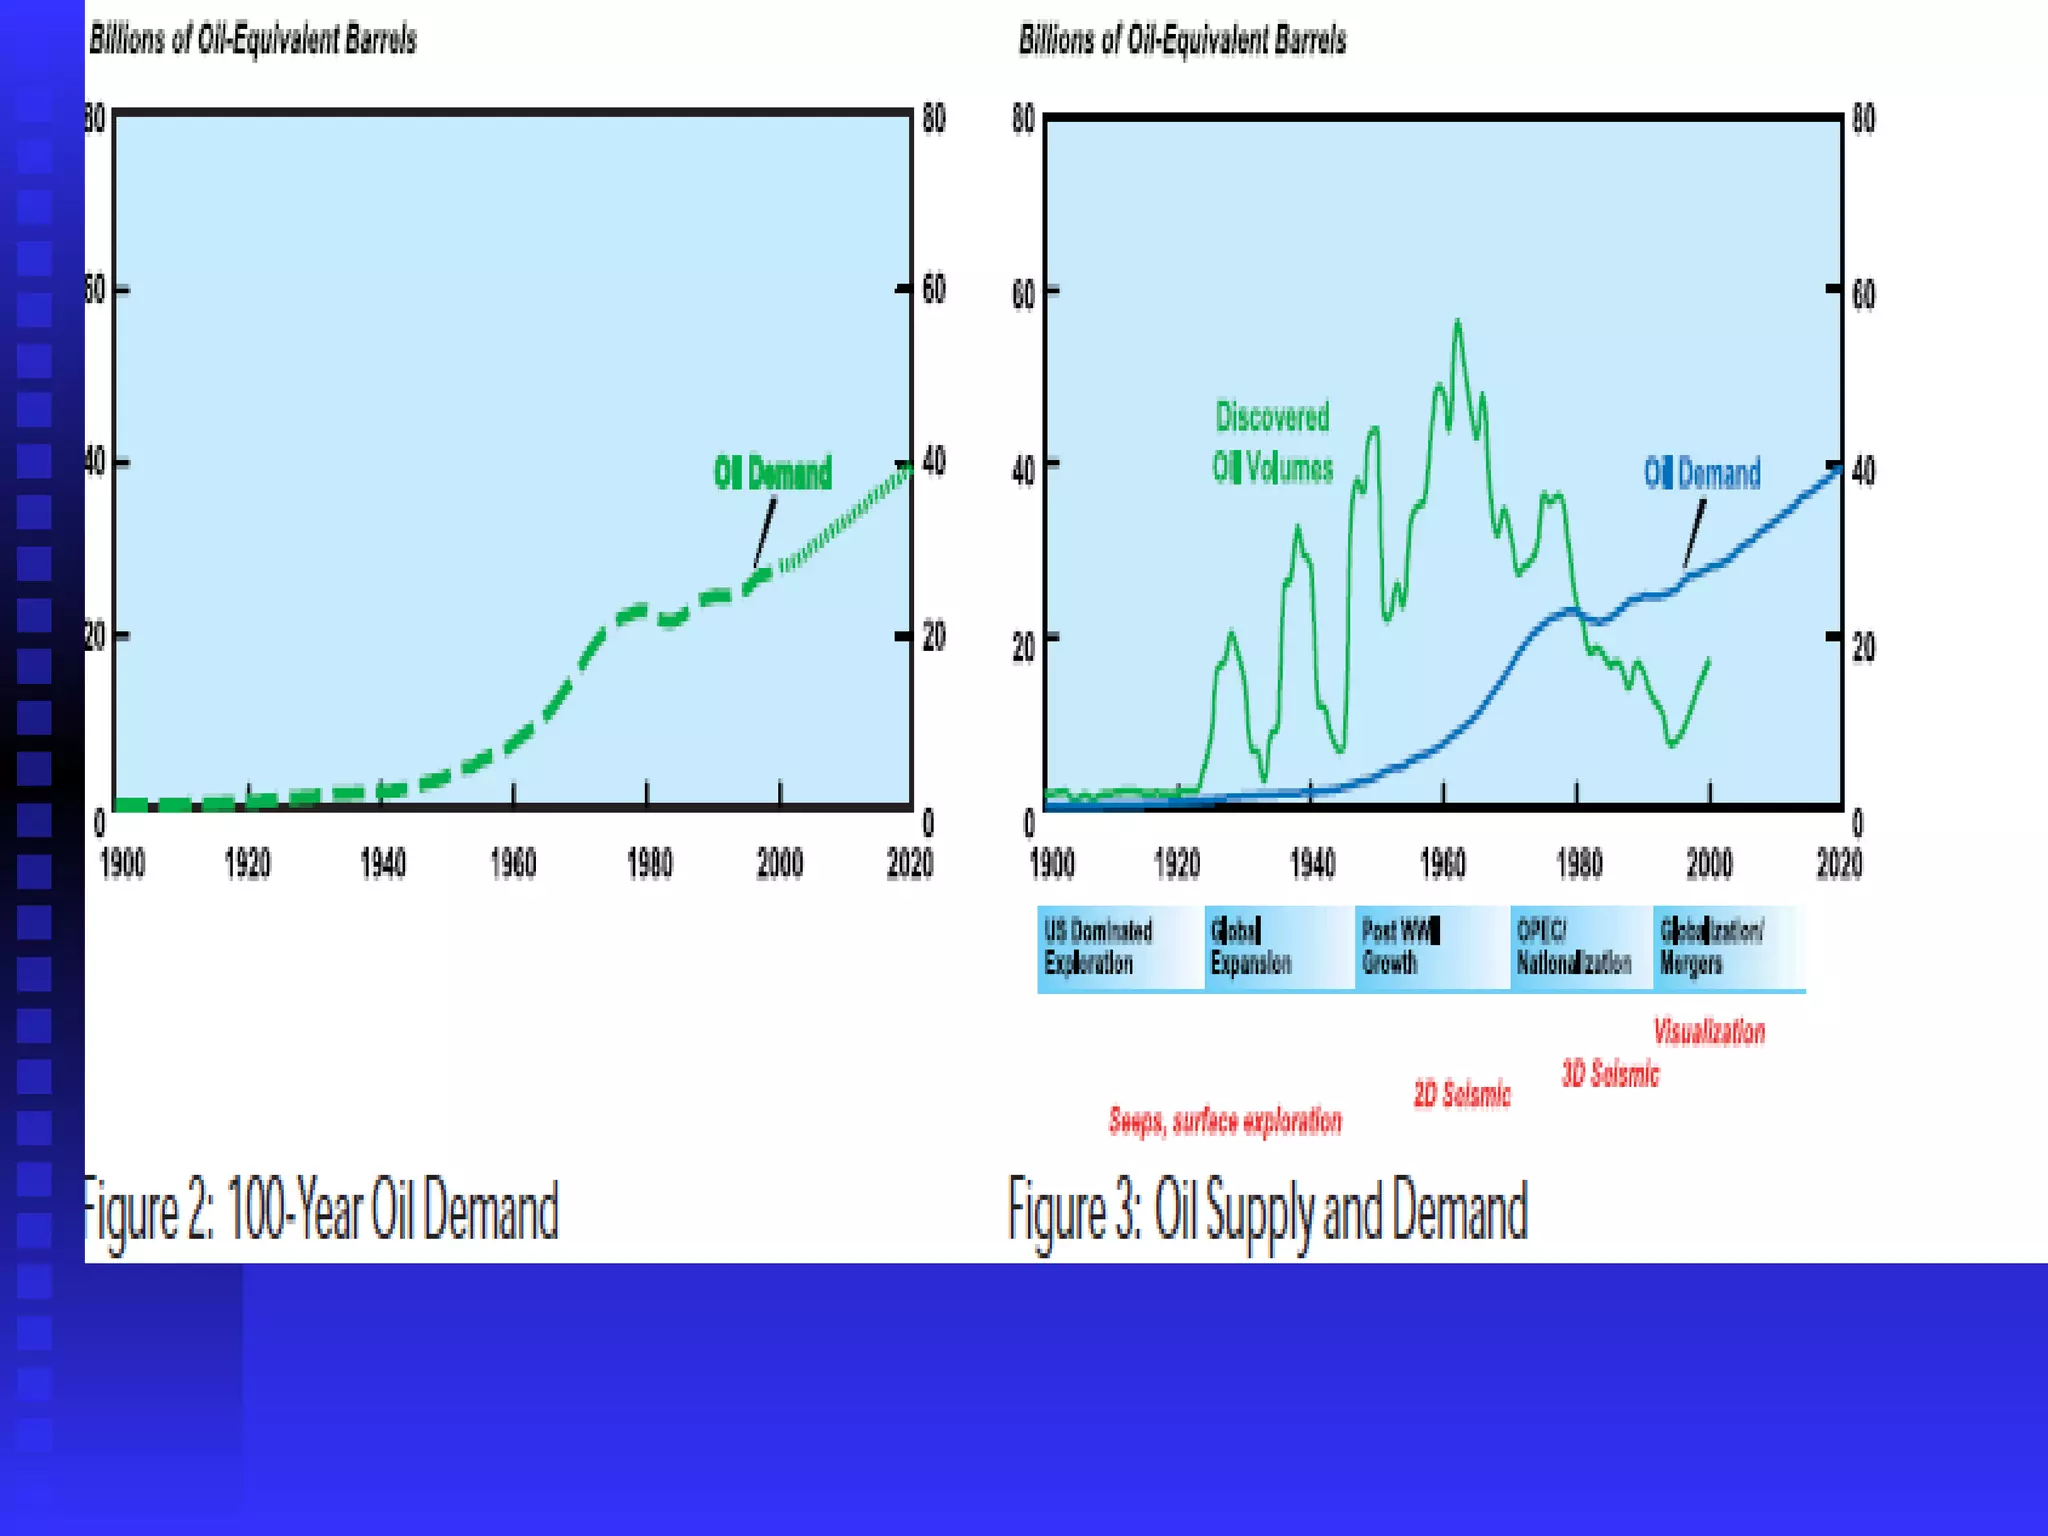
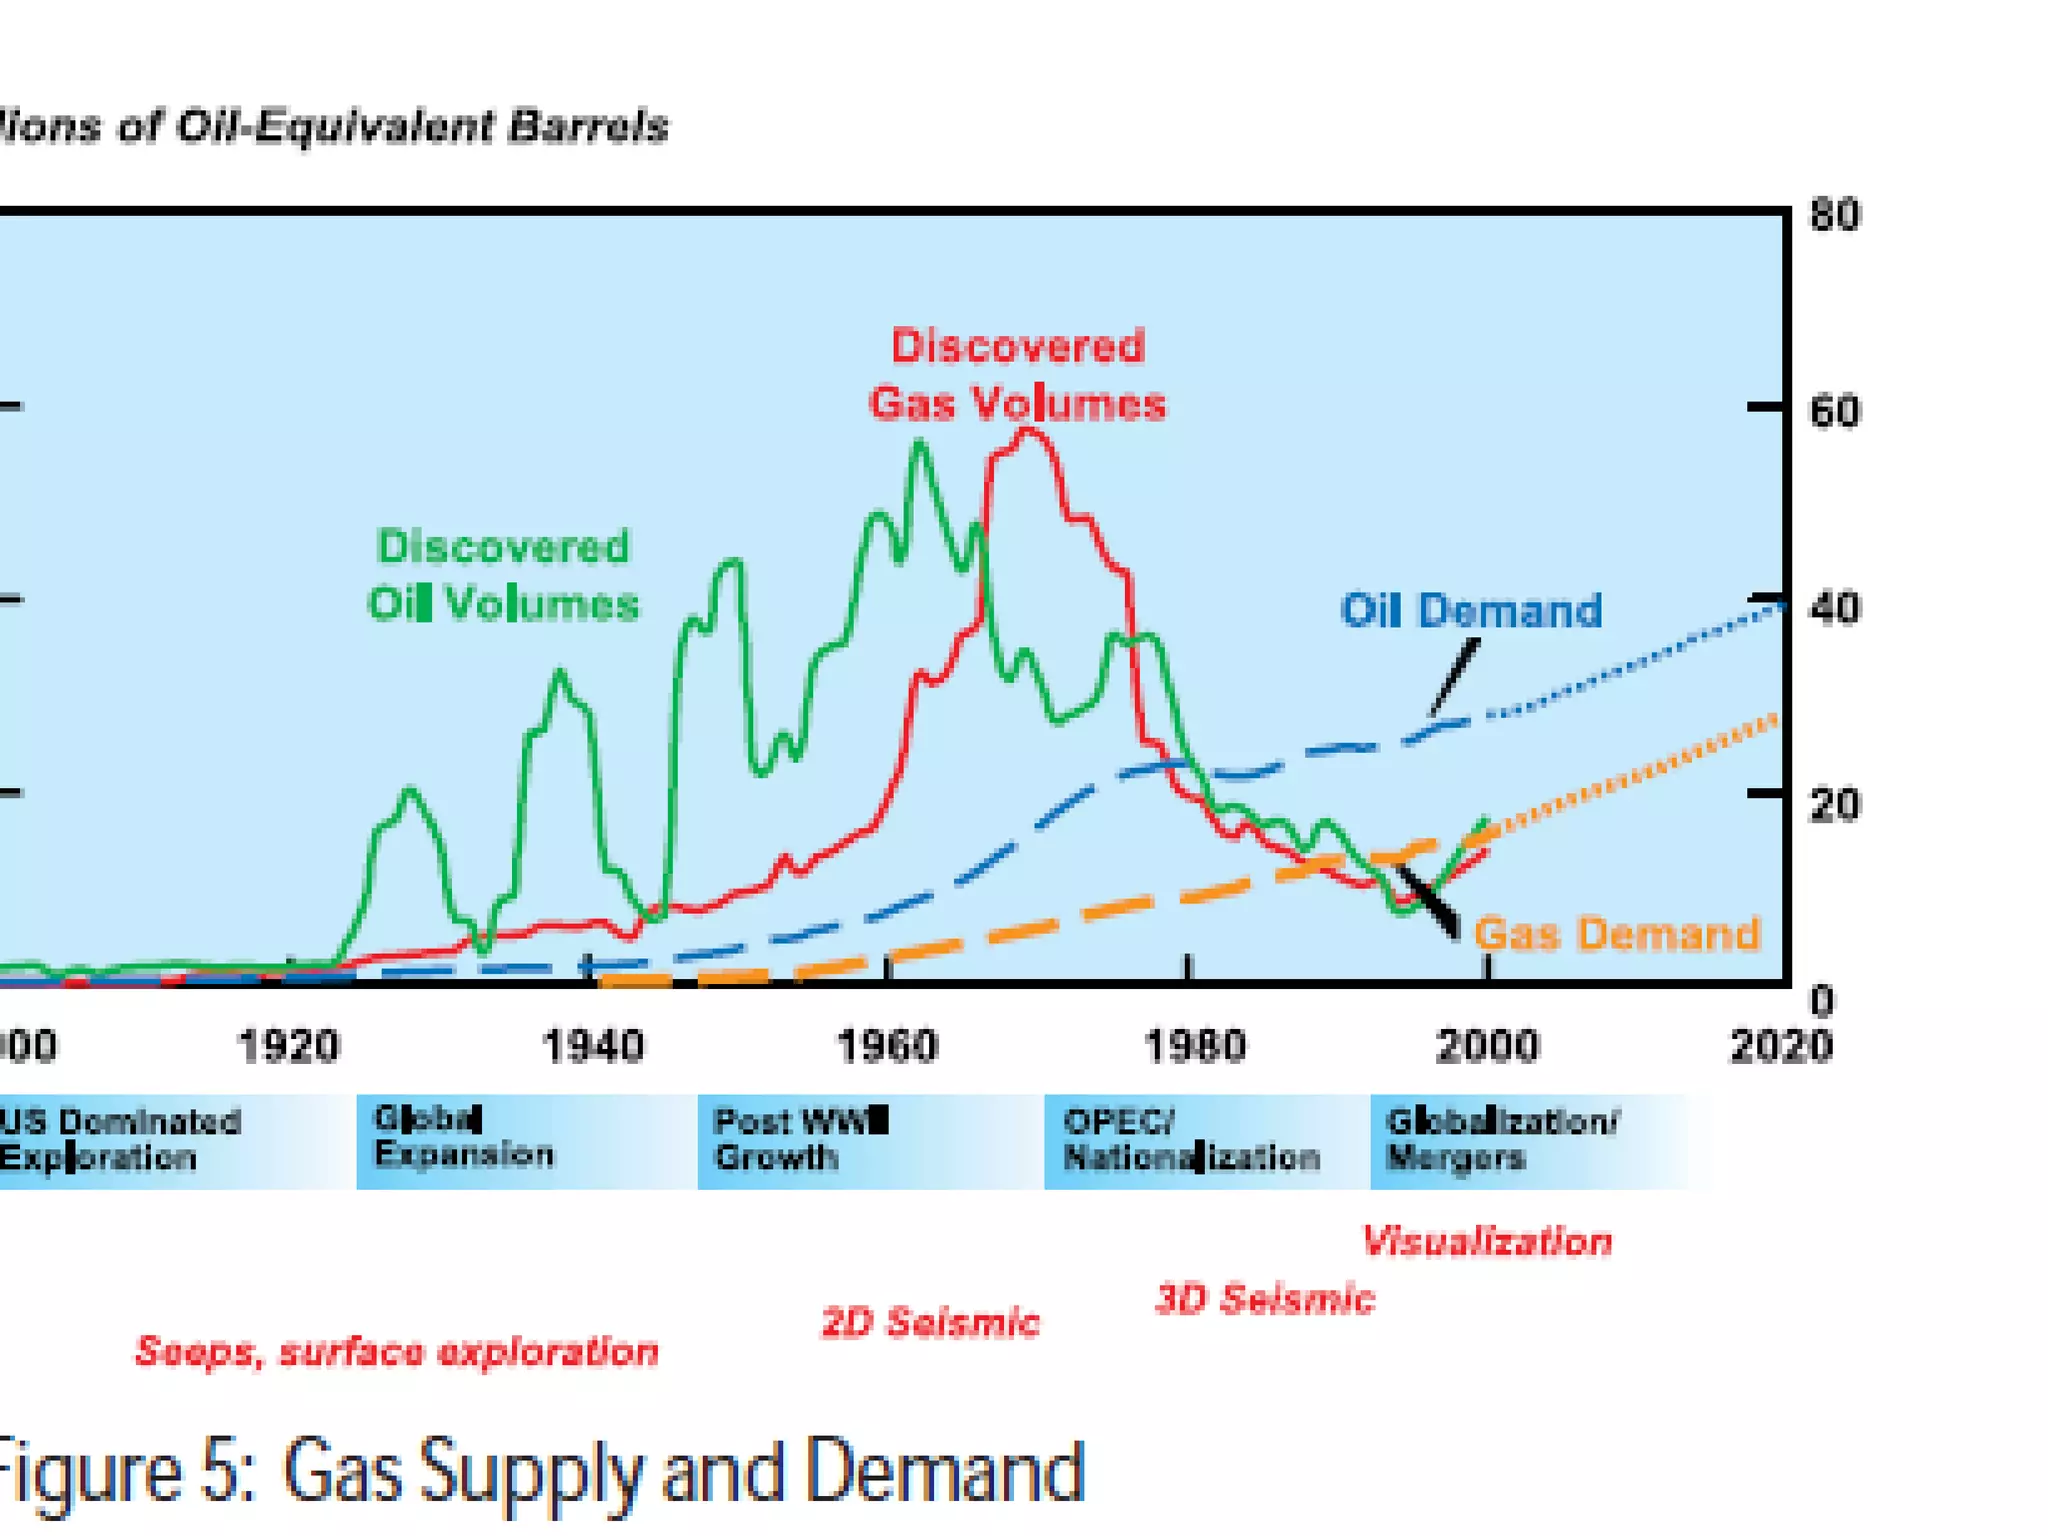
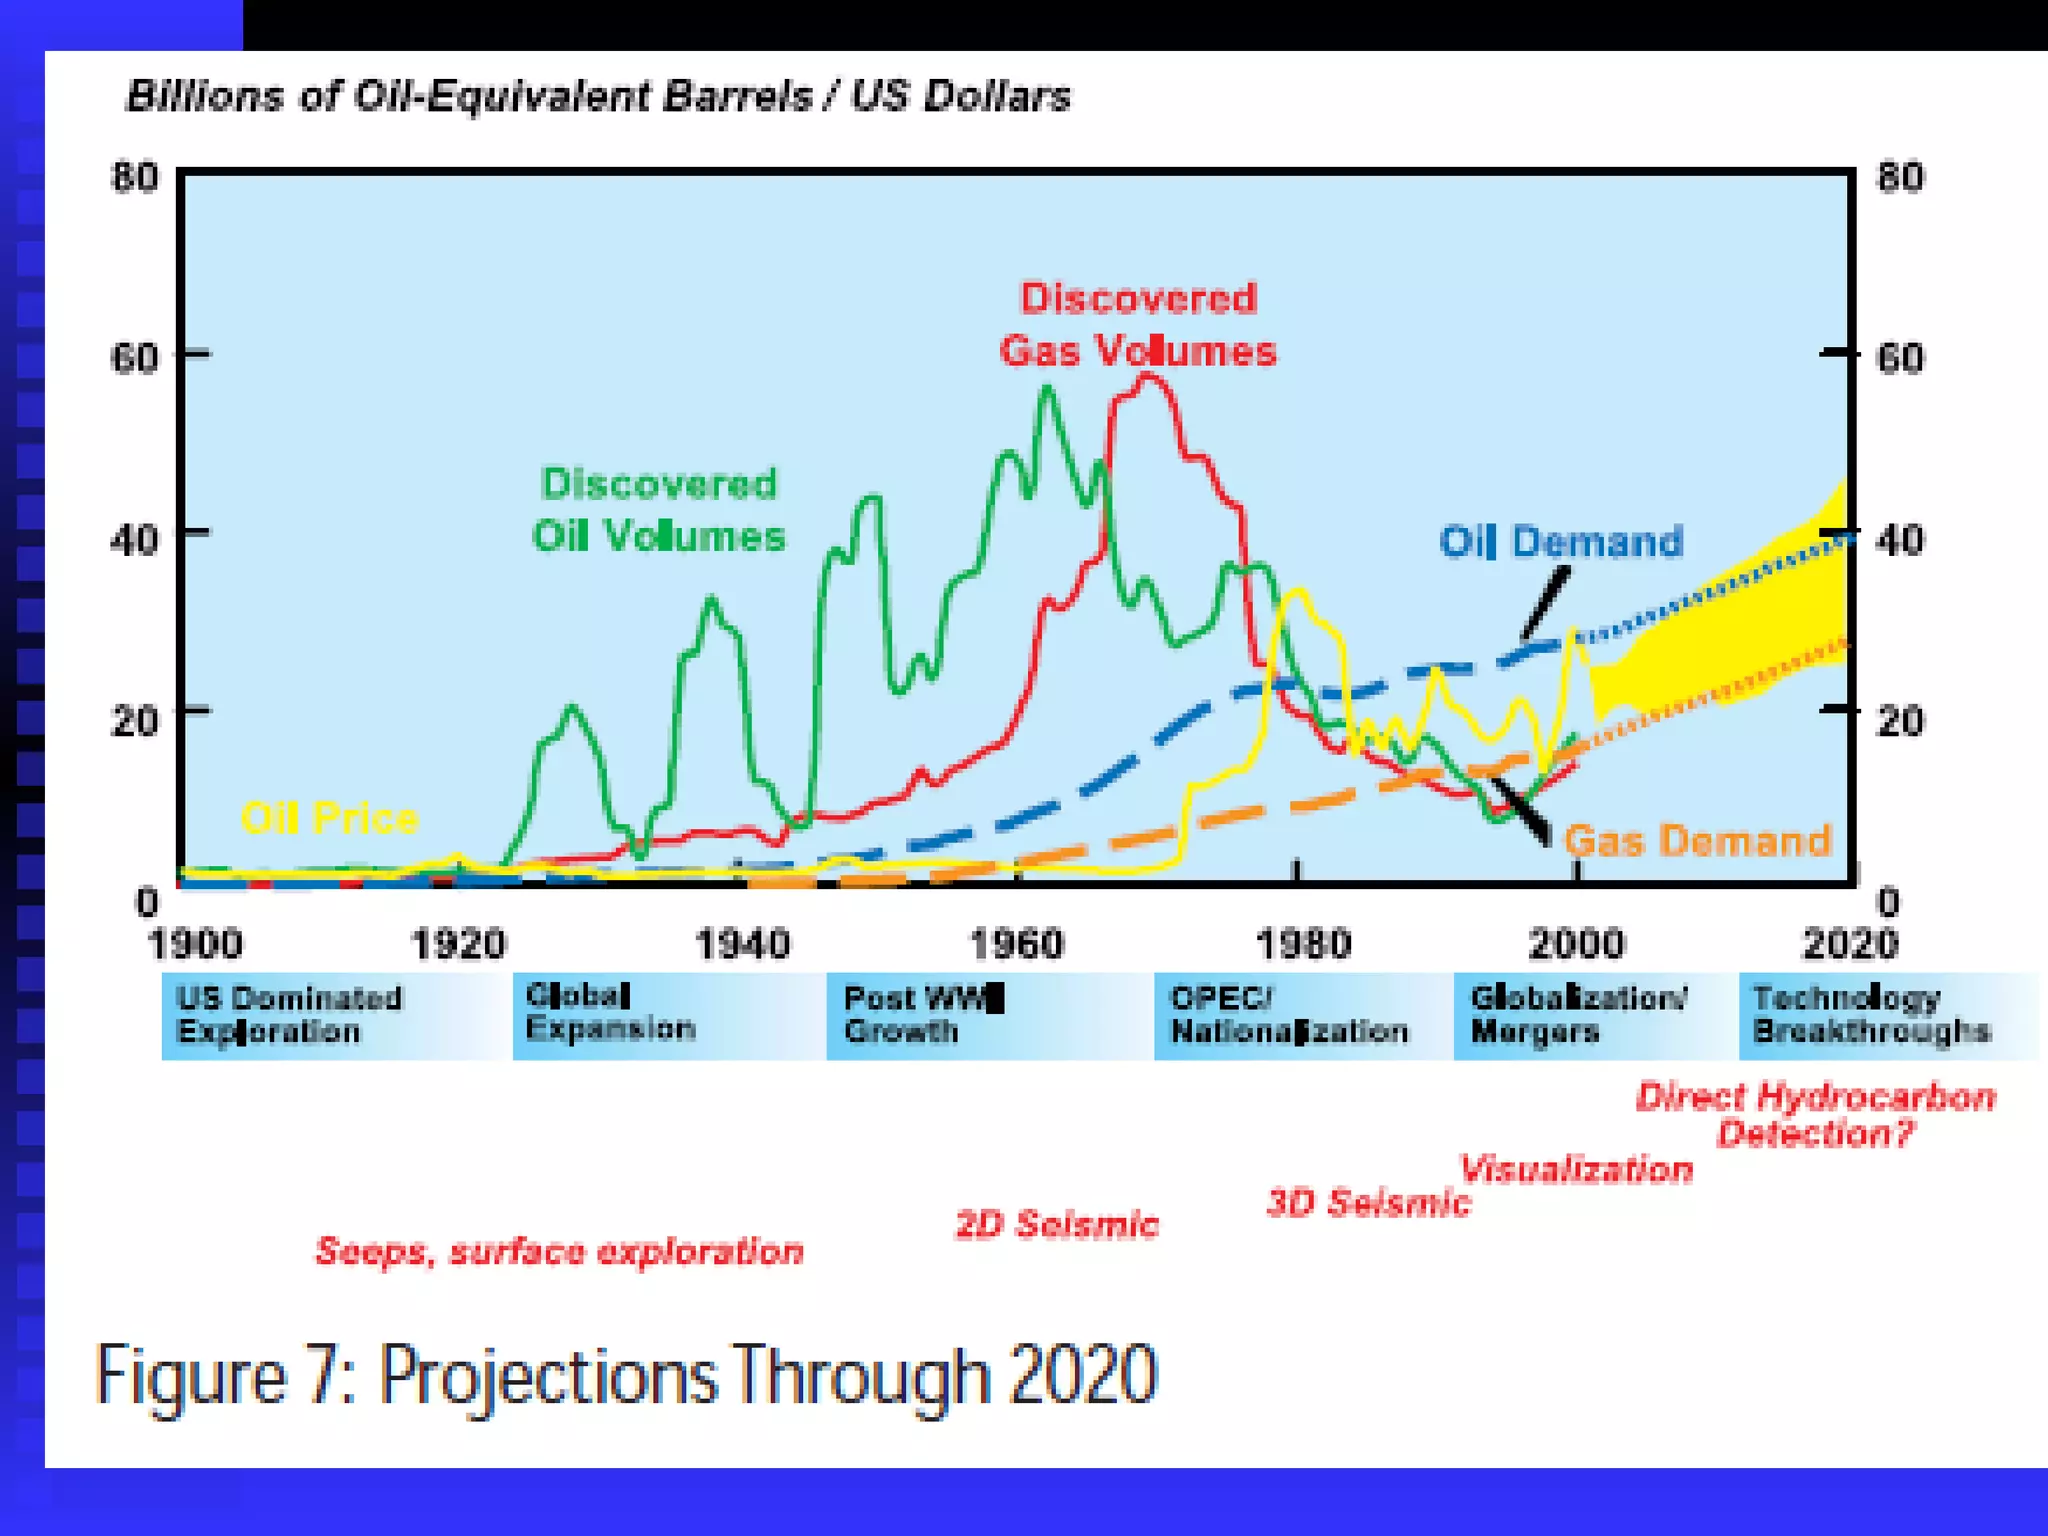
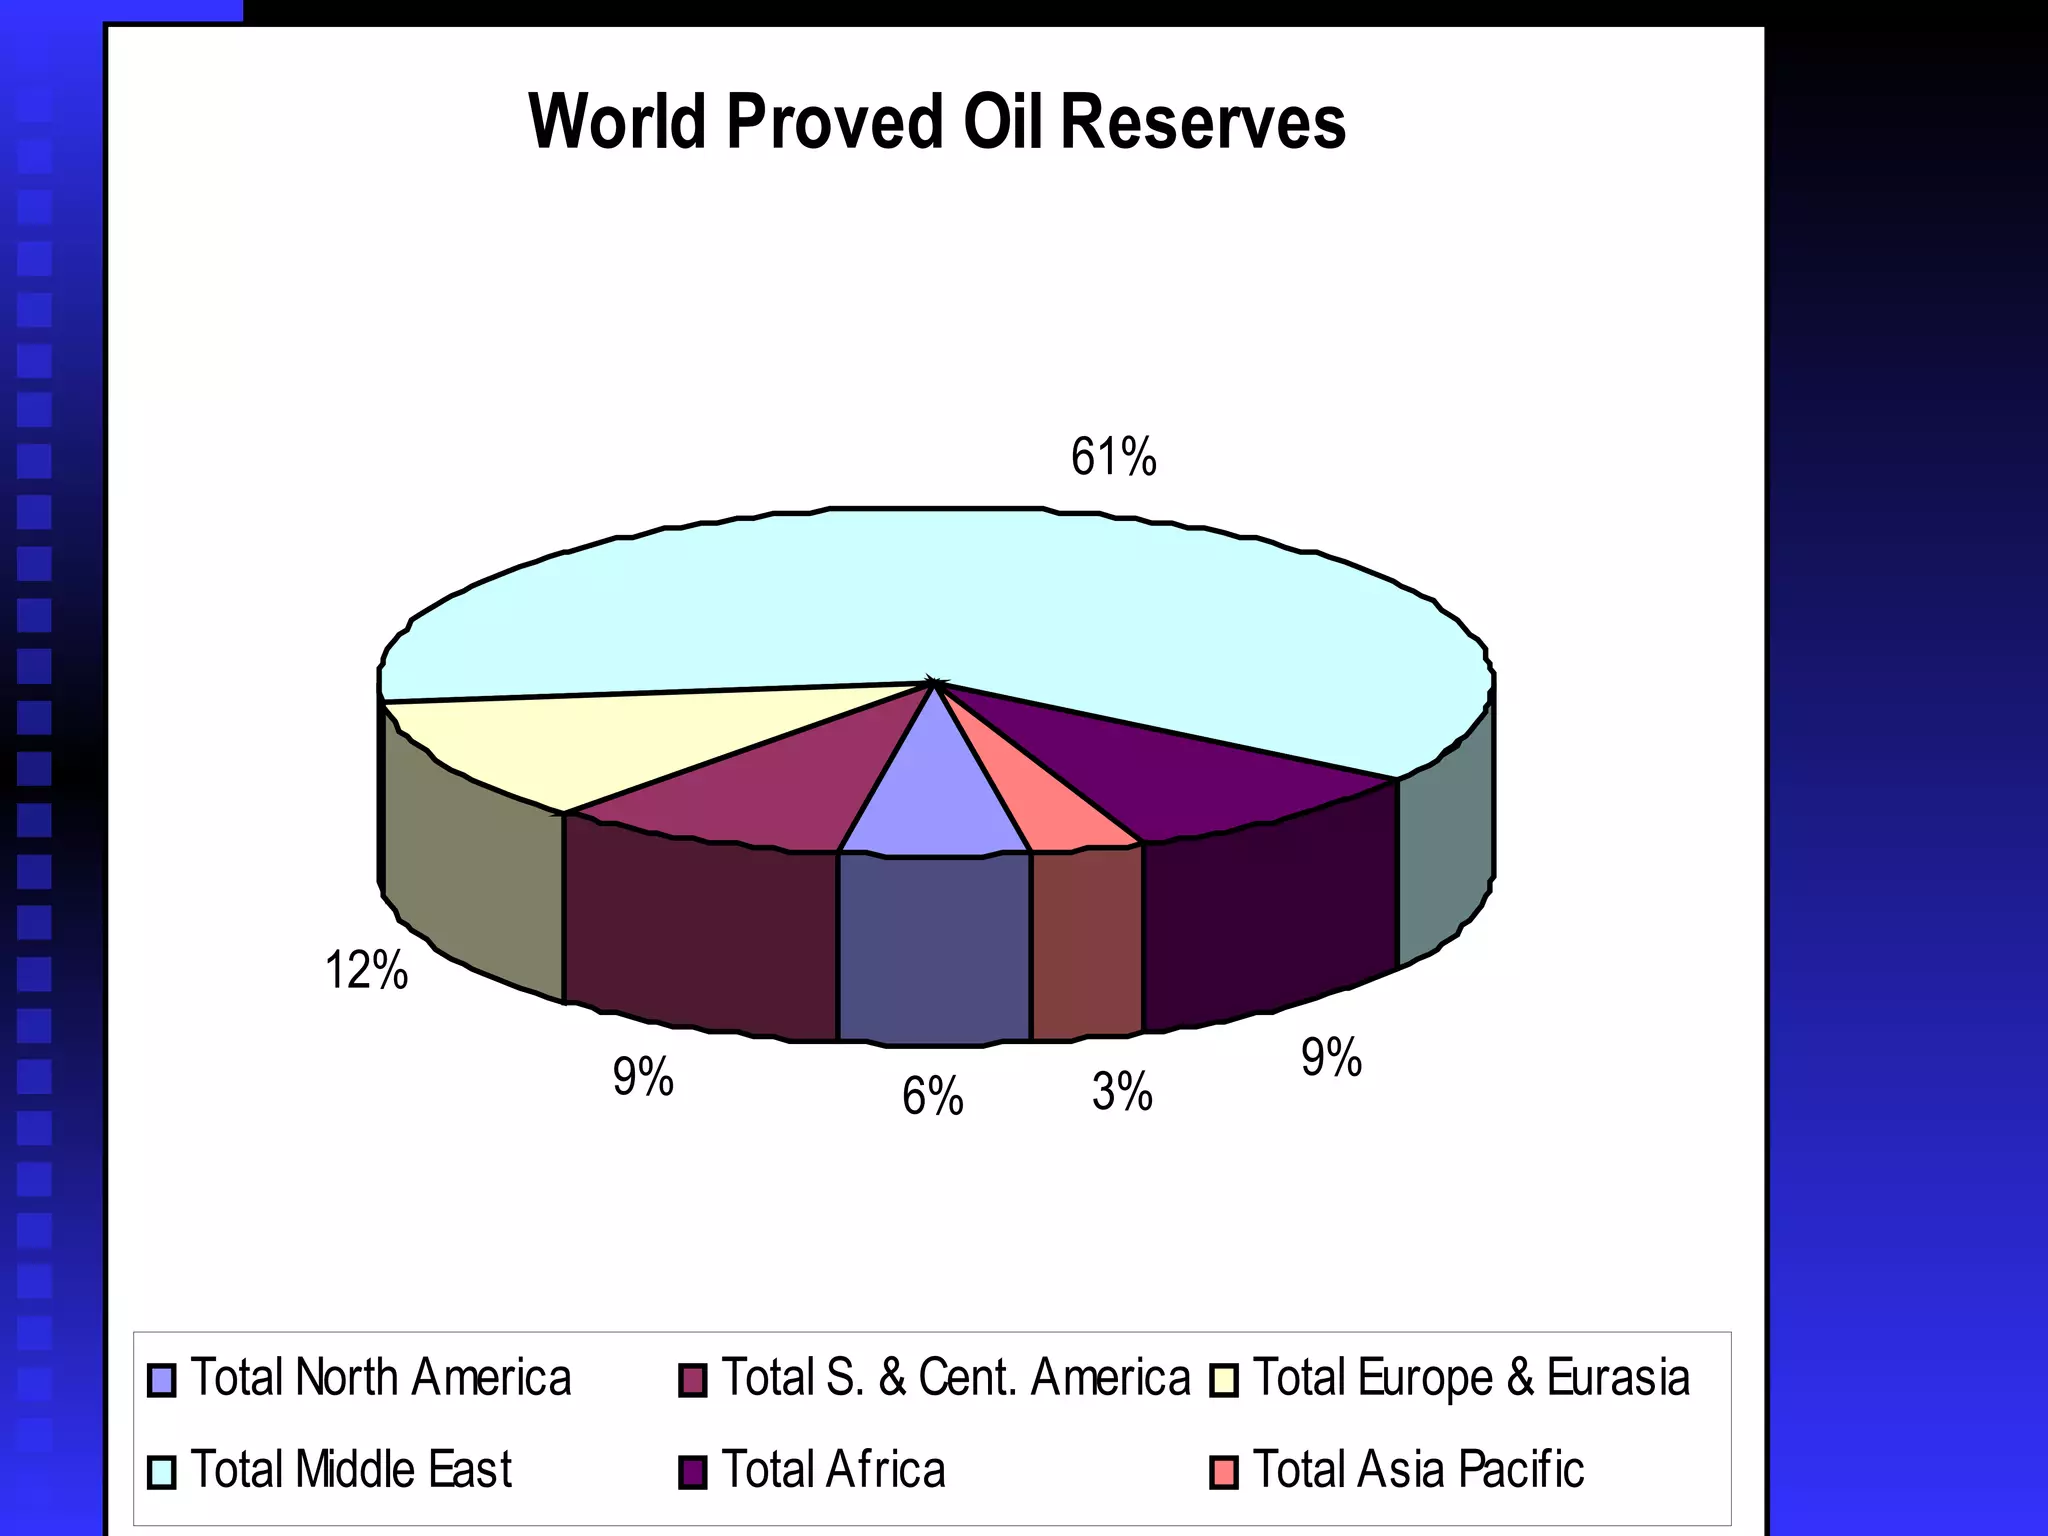
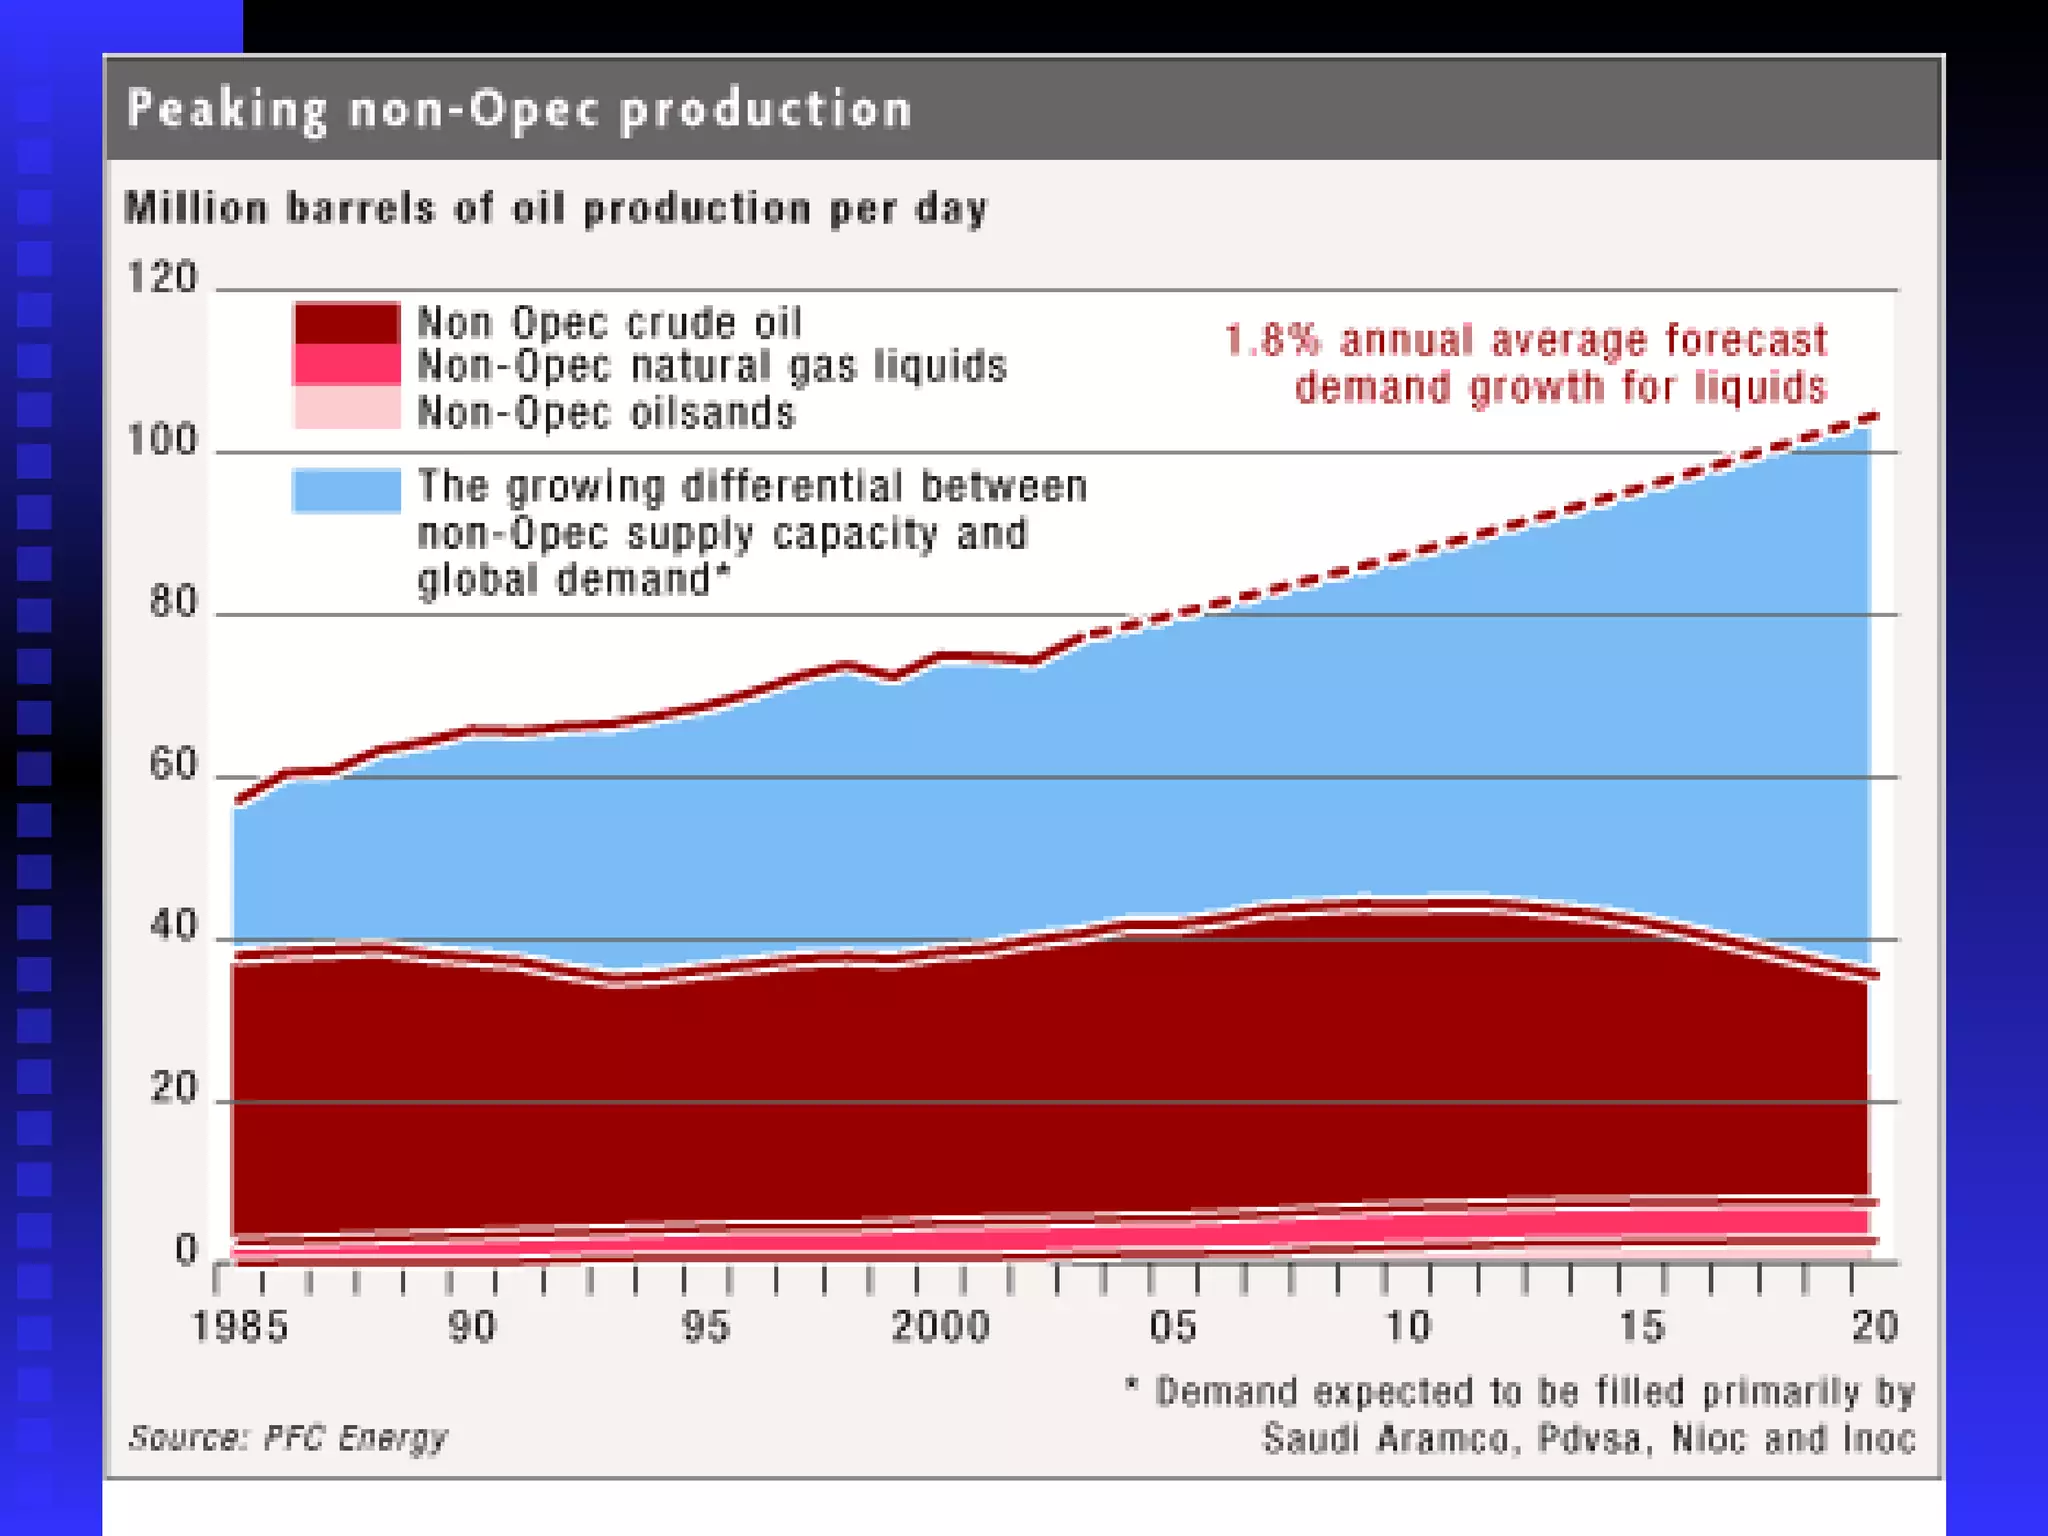
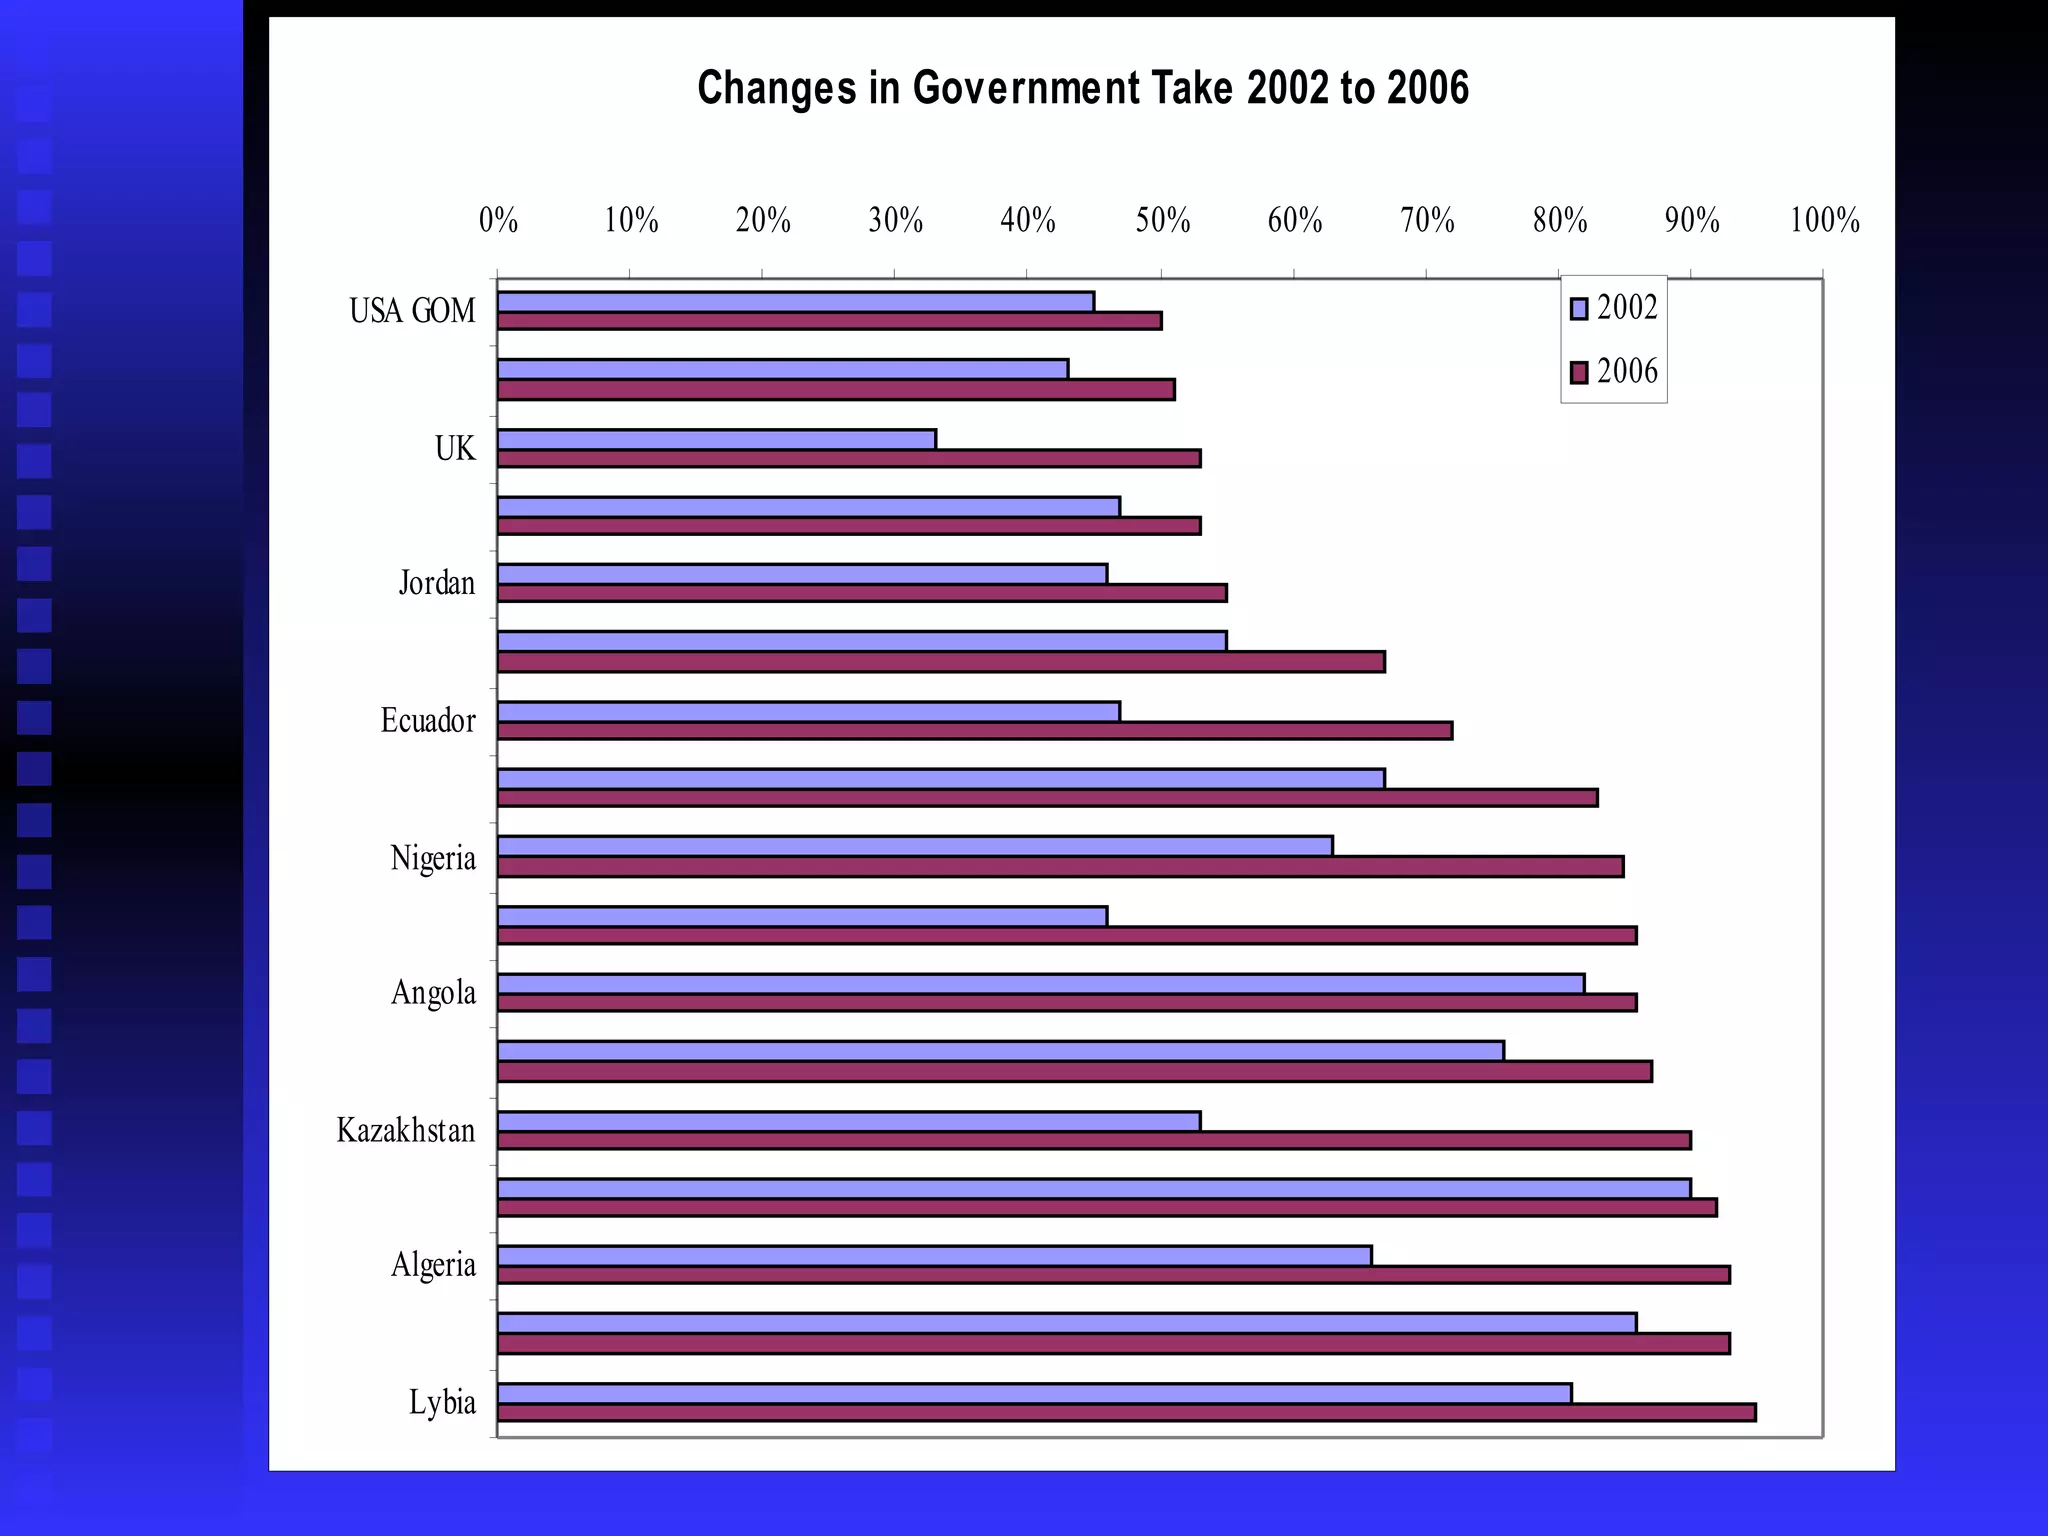
GLOBAL STRUCTURE AND TRENDS IN THE OIL AND GAS INDUSTRIES Thomas Akabzaa, Dept of Earth Science, University of Ghana
Petroleum Explained Petroleum comes from the Greek word,  Petro -rock; and  oleum -oil. Two possible theories of the origin have been postulated; biogenic and abiogenic sources.
Chemical composition of petroleum  Petroleum - all naturally occurring hydro carbons – gas, crude oil, bitumen and other some solid substances Main composition: Carbon, hydrogen,  Minor sulphur, nitrogen, oxygen Petroleum – gas, liquid and solid Gas consists of lighter paraffin Liquid Petroleum consist of  heavier paraffin hydrocarbons Petroleum solids and semi solids are asphalts, bitumen, tar, pitch etc.
Petroleum System Components of a Petroleum System: Mature  Source Rock, Migration Pathway Reservoir Rock, Trap and  Seal Rock Appropriate relative timing of formation of these elements and the processes of  generation , migration and  accumulation  are necessary for hydrocarbons to accumulate and be preserved. (Un itization)
Anticlinal trap
Crude oil include non carbon and hydrogen constituents namely: sulphur, nitrogen, helium, and oxygen together with organic compounds of some heavy metals, mainly vanadium and  nickel Sulphur is present in nearly all crudes in quantities up to about 3%.  higher in heavier than in lighter oils  Most refineries would normally prefer lower sulphur crudes. Average weight crude oils have °API of between 25 – 35. Classification of crudes
Light oils have 35-45 °API, rich in gasoline and are most valuable.  Heavy oils have below 25 °API .  Crude oils are classified as sweet and sour based on their suphur content.  Sweet crudes have less than 1% sulphur by weight Sour crudes have more than 1%  sulphur by weight.
The first function of all refineries is to separate the crude oil into fractions by fractional distillation. The break down of the heavy hydrocarbons in to lighter and more useful and more valuable products  is  called  cracking.  Because of their compositional variation in different oilfields may have to be distilled in specified refineries  designed to process oils of particular specification Basic consideration in the refining crude oil
Benchmark Crude Oils It is a standard against which other crude oils are compared and prices are set.  In the United States, West Texas Intermediate (WTI) is 30 - 40 °API and 0.3% S Brent , the benchmark crude oil for the North Sea is 38 °API and 0.3% S.  ` Bonny light benchmark crude for Nigeria is 37.6 °API and 0.13% S. Brass River benchmark crude for Nigeria is 43 °API and 0.08% S.  Dubai benchmark crude oil for the Middle East.  It is 31 °API and 2% S.
Global Structure of oil and gas industry Independent upstream and downstream companies Vertically  integrated companies National oil and gas and mining companies Private oil and gas and mining companies Commodity associations Industry associations (ICME, GMI etc)
Investment in upstream prospects Nominal upstream investment tripled between 2000 and 2009, from an estimated $120 billion to $500 billion. In real terms,  investment in 2009 was over 300% higher than in 2000.  The bulk of upstream investment will continue to be made by international companies .
Investment in upstream prospects
State of the industry at 2006. Recent boom meant more investment.  Together with greater competition among IOCs and NOCs, these conditions generated larger revenues for producing countries .
Global trends in the last two decades and their implications and effects  Commodity cycles, demand and supply centres Less emphasis on state owned companies for mining and increasing state involvement for oil and gas. Increasing mergers  Vertically integrated companies Increasing role of Junior companies at exploration stage
Stake your opinions on the following: Which countries are the major a) globally  countries b) Africa:  i) oil and gas producers producing countries ii) List the countries you consider major consumers of oil and gas iii)  Provide reasons for this.
Global Petroleum Demand
Consumption of petroleum The US and OECD countries consume over half the world petroleum resources.  However, China and other non-OECD countries have also increased their oil consumption.
 
Prices are random, the last boom just busted.
Oil Supply OPEC countries produce over 40% of total world oil output The USA and OECD countries are mature producers Future production will largely come from OPEC and other developing countries


World proved oil reserves Proved oil reserves are concentrated in the Middle East and other OPEC countries. Most of oil reserves are located in places out of reach for IOC.  Many oil rich countries have taken the decision to create a NOC.
 
Future production With non-OPEC production capacity declining, future production is expected to come from Saudi Arabia, Venezuela, Iran and Iraq. Lack of access is promoting greater competition for acreage. Between 2002 and 2009 over 35 countries increased their fiscal requirements for oil and gas operations.
 
National trends and their implications Increasing role for the Breton Wood institutions and multilateral donors in natural resource governance of developing countries including Design of sector policies Facilitating privatization in the sector Multi donor support  Quest for transparency and accountability Slow but increasing mainstreaming of sustainable development concepts
What have been the Implications and Impacts on development at your country level? Employment  Livelihoods  Conflicts  Human Rights Environmental  Human health Poverty
Trends and threats Increased demand, surging commodity prices and their implications Explosion of Junior and major companies Invasion of countries emerging from war  (tagged virgin grounds) Strategic Resource competition  The US and  the Gulf of Guinea The Growing presence of Brazil, China, India etc. Growing call for good governance in the sector
Current state of the industry. Recent boom meant more investment. Together with greater competition among IOCs and NOCs, these conditions generated larger revenues for producing countries.
 
THANK YOU

Overview Of The Structure And Trends In The Global Petroleum Industry

  • 1.
    GLOBAL STRUCTURE ANDTRENDS IN THE OIL AND GAS INDUSTRIES Thomas Akabzaa, Dept of Earth Science, University of Ghana
  • 2.
    Petroleum Explained Petroleumcomes from the Greek word, Petro -rock; and oleum -oil. Two possible theories of the origin have been postulated; biogenic and abiogenic sources.
  • 3.
    Chemical composition ofpetroleum Petroleum - all naturally occurring hydro carbons – gas, crude oil, bitumen and other some solid substances Main composition: Carbon, hydrogen, Minor sulphur, nitrogen, oxygen Petroleum – gas, liquid and solid Gas consists of lighter paraffin Liquid Petroleum consist of heavier paraffin hydrocarbons Petroleum solids and semi solids are asphalts, bitumen, tar, pitch etc.
  • 4.
    Petroleum System Componentsof a Petroleum System: Mature Source Rock, Migration Pathway Reservoir Rock, Trap and Seal Rock Appropriate relative timing of formation of these elements and the processes of generation , migration and accumulation are necessary for hydrocarbons to accumulate and be preserved. (Un itization)
  • 5.
  • 6.
    Crude oil includenon carbon and hydrogen constituents namely: sulphur, nitrogen, helium, and oxygen together with organic compounds of some heavy metals, mainly vanadium and nickel Sulphur is present in nearly all crudes in quantities up to about 3%. higher in heavier than in lighter oils Most refineries would normally prefer lower sulphur crudes. Average weight crude oils have °API of between 25 – 35. Classification of crudes
  • 7.
    Light oils have35-45 °API, rich in gasoline and are most valuable. Heavy oils have below 25 °API . Crude oils are classified as sweet and sour based on their suphur content. Sweet crudes have less than 1% sulphur by weight Sour crudes have more than 1% sulphur by weight.
  • 8.
    The first functionof all refineries is to separate the crude oil into fractions by fractional distillation. The break down of the heavy hydrocarbons in to lighter and more useful and more valuable products is called cracking. Because of their compositional variation in different oilfields may have to be distilled in specified refineries designed to process oils of particular specification Basic consideration in the refining crude oil
  • 9.
    Benchmark Crude OilsIt is a standard against which other crude oils are compared and prices are set. In the United States, West Texas Intermediate (WTI) is 30 - 40 °API and 0.3% S Brent , the benchmark crude oil for the North Sea is 38 °API and 0.3% S. ` Bonny light benchmark crude for Nigeria is 37.6 °API and 0.13% S. Brass River benchmark crude for Nigeria is 43 °API and 0.08% S. Dubai benchmark crude oil for the Middle East. It is 31 °API and 2% S.
  • 10.
    Global Structure ofoil and gas industry Independent upstream and downstream companies Vertically integrated companies National oil and gas and mining companies Private oil and gas and mining companies Commodity associations Industry associations (ICME, GMI etc)
  • 11.
    Investment in upstreamprospects Nominal upstream investment tripled between 2000 and 2009, from an estimated $120 billion to $500 billion. In real terms, investment in 2009 was over 300% higher than in 2000. The bulk of upstream investment will continue to be made by international companies .
  • 12.
  • 13.
    State of theindustry at 2006. Recent boom meant more investment. Together with greater competition among IOCs and NOCs, these conditions generated larger revenues for producing countries .
  • 14.
    Global trends inthe last two decades and their implications and effects Commodity cycles, demand and supply centres Less emphasis on state owned companies for mining and increasing state involvement for oil and gas. Increasing mergers Vertically integrated companies Increasing role of Junior companies at exploration stage
  • 15.
    Stake your opinionson the following: Which countries are the major a) globally countries b) Africa: i) oil and gas producers producing countries ii) List the countries you consider major consumers of oil and gas iii) Provide reasons for this.
  • 16.
  • 17.
    Consumption of petroleumThe US and OECD countries consume over half the world petroleum resources. However, China and other non-OECD countries have also increased their oil consumption.
  • 18.
  • 19.
    Prices are random,the last boom just busted.
  • 20.
    Oil Supply OPECcountries produce over 40% of total world oil output The USA and OECD countries are mature producers Future production will largely come from OPEC and other developing countries
  • 21.
  • 22.
  • 23.
  • 24.
  • 25.
    World proved oilreserves Proved oil reserves are concentrated in the Middle East and other OPEC countries. Most of oil reserves are located in places out of reach for IOC. Many oil rich countries have taken the decision to create a NOC.
  • 26.
  • 27.
    Future production Withnon-OPEC production capacity declining, future production is expected to come from Saudi Arabia, Venezuela, Iran and Iraq. Lack of access is promoting greater competition for acreage. Between 2002 and 2009 over 35 countries increased their fiscal requirements for oil and gas operations.
  • 28.
  • 29.
    National trends andtheir implications Increasing role for the Breton Wood institutions and multilateral donors in natural resource governance of developing countries including Design of sector policies Facilitating privatization in the sector Multi donor support Quest for transparency and accountability Slow but increasing mainstreaming of sustainable development concepts
  • 30.
    What have beenthe Implications and Impacts on development at your country level? Employment Livelihoods Conflicts Human Rights Environmental Human health Poverty
  • 31.
    Trends and threatsIncreased demand, surging commodity prices and their implications Explosion of Junior and major companies Invasion of countries emerging from war (tagged virgin grounds) Strategic Resource competition The US and the Gulf of Guinea The Growing presence of Brazil, China, India etc. Growing call for good governance in the sector
  • 32.
    Current state ofthe industry. Recent boom meant more investment. Together with greater competition among IOCs and NOCs, these conditions generated larger revenues for producing countries.
  • 33.
  • 34.

Editor's Notes

  • #12 Source: IEA, World Energy Outlook 2008.
  • #14 Source: Chevron, citing CERA data. From "Alberta Royalty Commission Final Report 2007", p. 29. This information is available at: http://www.albertaroyaltyreview.ca/panel/final_report.pdf
  • #18 Source: EIA World Oil Balance.
  • #20 Source: EIA
  • #28 Source: Carola Hoyos, “The New Seven Sisters.” Financial Times, March 11, 2007.
  • #33 Source: Chevron, citing CERA data. From "Alberta Royalty Commission Final Report 2007", p. 29. This information is available at: http://www.albertaroyaltyreview.ca/panel/final_report.pdf