2. 2 A09-10-0001
To “cry wolf” over the availability of oil has the sole effect of perpetuating a misguided obsession
with oil security and control that is already rooted in Western public opinion—an obsession that
historically has invariably led to bad political decisions.2
Regardless of whether the peak has or has not been reached, oil and natural gas are an indispensable source
of the world’s energy and petrochemical feedstocks, and will be for many years to come. The difficulty in deter-
mining oil and gas reserves is that “true reserves” are a complex combination of technology, price, and politics.
While technical change continues to reveal new sources of oil and gas, prices have demonstrated more volatility
than ever, and governments have sought more control over resource information and access than ever. As prices
rise, reserves once considered non-economic to develop may become feasible.
As illustrated by Exhibit 1, crude oil prices ranged between $2.50 and $3.00 from 1948 through the end of
the 1960s. The Arab oil embargo of 1974 resulted in a large price increase. Events in Iran and Iraq led to another
round of crude oil price increases in 1979 and 1980. The 1990s saw another spike in prices that ended with the
1997 Asian financial crisis. Prices then started back up, only to fall after September 11, 2001. After 9/11, prices
rose until the recession at the end of the decade.
Oil and Gas Reserves
Discovering new oil and gas reserves is the lifeblood of the industry. Without new reserves to replace oil and gas
production, the industry would die. However, measuring and valuing reserves is a scientific and business challenge
because reserves can only be measured if they have value in the marketplace.The oil sands of Alberta, Canada, are
a good illustration of how difficult it is to accurately measure oil and gas reserves. Oil sands are deposits of bitu-
men, a molasses-like viscous oil that will not flow unless heated or diluted with lighter hydrocarbons. Although
the oil sands in Alberta are now considered second only to the Saudi Arabia reserves in the potential amount of
recoverable oil, for many years these were not viewed as real reserves because they were non-economical to develop.
By the mid-2000s, the main town in the oil sands region, Fort McMurray, was in the midst of a boom not unlike
the gold rush booms of the 1800s. Housing and labor were scarce and the infrastructure was struggling to keep
pace with the influx of people, companies, and capital. The development of the oil sands occurred because of a
combination of rising oil prices and technological innovation. There were estimates that oil sands production
could reach three million barrels per day (b/d) by 2020, and possibly even five million b/d by 2030.
Exhibit 1. The Price of Oil, 1860-2009 (US$ per barrel)
$0
$10
$20
$30
$40
$50
$60
$70
$80
1860
1864
1868
1872
1876
1880
1884
1888
1892
1896
1900
1904
1908
1912
1916
1920
1924
1928
1932
1936
1940
1944
1948
1952
1956
1960
1964
1968
1972
1976
1980
1984
1988
1992
1996
2000
2004
2008
$0
$10
$20
$30
$40
$50
$60
$70
$80
1860
1864
1868
1872
1876
1880
1884
1888
1892
1896
1900
1904
1908
1912
1916
1920
1924
$0
$10
$20
$30
$40
$50
$60
$70
$80
1860
1864
1868
1872
1876
1880
1884
1888
1892
1896
1900
1904
1908
1912
1916
1920
1924
1928
1932
1936
1940
1944
1948
1952
1956
1960
1964
1968
1972
1976
1980
1984
1988
1992
1996
2000
2004
2008
Source: Annual average prices in US$ per barrel. Based on “BP Statistical Review of World
Energy,” June 2008.
3. A09-10-0001 3
Oil and Gas in the Global Economy
Oil and gas play a vital role in the global economy. The International Energy Agency (IEA) predicts that energy
demand will rise by an average of 1.5% each year through 2030. Demand in 2030 will be about 60% higher than
in 2000. Demand in the non-OECD nations will account for approximately 80% of the global increase. Most
of the world’s growing energy needs through 2030 will continue to be met by oil, gas, and coal. With increased
energy efficiency, energy as a percentage of total GDP has fallen and is expected to continue to fall.
Oil and Gas Supply
One of the fascinating aspects of the industry is the fact that all countries are consumers of products derived from
the oil and gas industry, but only a small set of nations are major producers of oil and gas. Over the past decades,
the large developed economies of the world have become net importers of oil and gas, giving rise to challenging
geo-political issues involving a diverse set of oil consumers and producers. Exhibit 2 shows the major oil and
gas-producing nations and their change in output over a decade. Countries like Angola and Brazil have made
their way into the top tier of oil producers, whereas the U.S. and Mexico, for different reasons, are on their way
down. In natural gas, newcomers like Qatar and Turkmenistan have become major players.
Industry Financial Performance
The oil and gas industry has been widely criticized by politicians and the media for its high profits of recent years.
In the U.S., there has been talk of an excess profits tax, prompting Lee Raymond, former ExxonMobil CEO,
to comment in 2005, “I can’t remember any of these people seven years ago, when the price was $10 a barrel,
coming forward and saying, ‘Are you guys going to have enough money to be able to continue to invest in this
business?’ I don’t recall my phone ringing and anybody asking me that question.”3
The oil and gas industry is highly cyclical, and the cycles can last many years. In the 1990s, crude oil prices
fell steadily, and in the new millennium the first few years saw steadily rising prices. The Great Recession put a
damper on some experts’ prediction of $200 per barrel prices. Although the oil industry is highly profitable in
Exhibit 2. Major Oil and Gas-Producing Nations
Oil-Producing Nations Natural Gas-Producing Nations
Country
Percent of World
Supply, 2008
Output Change
Since 1998
Percent of World
Supply, 2008
Output Change
Since 1998
Saudi Arabia 13.1 14.1% Russia 19.6 12.5%
Russia 12.4 60.3% United States 19.3 8.1%
United States 7.8 -15.9% Canada 5.7 1.0%
Iran 5.3 12.2% Iran 3.8 1.3%
China 4.8 18.1% Norway 3.2 1.2%
Canada 4.0 21.2% Algeria 2.8 13.0%
Mexico 4.0 -9.8% Saudi Arabia 2.5 66.8%
United Arab Emirates 3.6 12.8% Qatar 2.5 2.9%
Kuwait 3.5 24.7% China 2.5 2.3%
Venezuela 3.4 26.3% Indonesia 2.3 7.9%
Iraq 3.0 14.2% United Kingdom 2.3 22.8%
Norway 2.9 21.8% Netherlands 2.2 4.3%
Nigeria 2.7 0.1% Turkmenistan 2.1 4.5%
Brazil 2.4 89.3% Malaysia 2.0 62.6%
Angola 2.3 156.6% Uzbekistan 2.0 25.4%
Algeria 2.2 36.4%
Libya 2.2 24.7%
Kazakhstan 1.8 189.5%
United Kingdom 1.8 -45.0%
Qatar 1.5 96.5%
Total 84.7 Total 74.8
Source: BP Statistical Review of World Energy 2009.
4. 4 A09-10-0001
some years, its long-term profitability is not much higher than average profitability across many industries. In the
U.S., the oil and gas industry has earned return on sales (net income divided by revenue) of about 8%, compared
to an average of about 6% for all U.S. manufacturing, mining, and wholesale trade corporations.
As evidence of the cyclical nature of the industry, some years ago Fortune reported that the oil industry
ranked 30th out of 36 industries in return to investors over the 1985-95 period, 34th out of 36 U.S. industries
in return on equity in 1995, and 32nd in return on sales.4
The Role of OPEC
The oil and gas industry has seen a remarkable bevy of government regulations and interventions over the past
century, from heavy taxation of petrol in Europe to U.S. price controls on domestic production in the 1970s.The
creation of the Organization of the Petroleum Exporting Countries (OPEC) represents government intervention
on a global scale. OPEC was founded in 1960 with the objective of shifting bargaining power to the producing
countries and away from the large oil companies. In 2006, Angola became the 12th member of OPEC, and there
was speculation that Sudan might be next.
OPEC’s mission is “to coordinate and unify the petroleum policies of Member Countries and ensure the
stabilization of oil prices in order to secure an efficient, economic, and regular supply of petroleum to consumers,
a steady income to producers, and a fair return on capital to those investing in the petroleum industry.”5
Despite
being a cartel, OPEC’s ability to control prices is questionable. Surging oil prices in the 1980s resulted in energy
conservation and increased exploration outside OPEC. Maintaining discipline among OPEC members has been a
major problem (as is typical in all cartels). Massive cheating was blamed for the oil price crash of 1986, and in the
1990s Venezuela was considered one of the bigger OPEC cheats in regularly producing more than its quota.
Exhibit 3 shows OPEC production and crude oil prices. Although it is difficult to identify any clear continu-
ing relationship between OPEC’s production over time and the movement of crude oil prices, the organization
has clearly been instrumental in periodic “shocks to the system,” as characterized by one analyst.
Exhibit 3. OPEC Production and Crude Oil Prices
Source: WTRG Economics.
5. A09-10-0001 5
The Resource Curse
The resource curse is a paradox of the oil and gas industry. Despite high resource prices, the living standards in
many oil-producing countries are low.This condition has led to the inability of countries rich in natural resources
to use that wealth to strengthen their economies and, counter-intuitively, to have lower economic growth than
countries without an abundance of natural resources.6
When times are good and oil prices are high, oil-rich
countries may prosper. When oil prices fall, as they inevitably do, an overreliance on the oil sector can leave a
country in a perilous situation. Moreover, the oil industries of the petroleum-nationalistic countries often suffer
from a lack of investment and heavily subsidized domestic petroleum products. For example, although Iran is
second to Saudi Arabia in the size of its reserves, the country’s oil industry is in a shambles. Iran’s 2009 production
was only about two-thirds of the level reached under the government of the former Shah of Iran in 1979. Iran
imported about 40% of its gasoline and is unable to produce sufficient crude to meet its OPEC quota. In June
2007, Iran introduced gasoline rationing, which reduced imports and resulted in widespread black marketeering.
Some experts predicted that without huge foreign direct investment in the industry, Iran’s oil production would
decline precipitously over the next few decades. According to one analyst:
Iran burns its candle at both ends, producing less and less [oil] while consuming more and more.
Absent some change in Iranian policy, a rapid decline in exports seems likely. Policy gridlock and a
Soviet-style command economy make practical problem-solving almost impossible.7
Mexico also has declining production and significant imports of refined products. The Mexican constitu-
tion does not allow foreign direct investment in the oil and gas industry. After many years of under-investment
and of Mexican governments using the oil industry as their primary source of revenue, the industry is in dire
straits. Without major investment and new technology, Mexico’s oil production is poised to fall. For example,
production at the Cantarell oil field, one of the largest fields in the world, fell from more than 2 million b/d in
2004 to substantially less than 1 million b/d in 2009.
Major Industry Players and Competitors
The organizations which have dominated the global oil and gas industry for more than a century have changed
dramatically over time—in who they are, what they do, and of critical significance for the future of the industry—
what they want.
Integrated Oil Companies
The term integrated oil companies (IOCs) refers to companies that operate in many industry segments from
exploration to refining, marketing, and retail. In the early days of the industry, there was true vertical integra-
tion in which producers refined 100% of their production and then marketed refined products through their
retail outlets. In the modern industry, the IOCs operate in many segments, but also buy and sell oil and gas to
and from other firms.
For many years, the largest IOCs (also known as oil majors) were the “Seven Sisters,” and included:
1. Standard Oil of New Jersey (Esso), which later became Exxon and then merged with Mobil to create
ExxonMobil
2. Royal Dutch Shell
3. Anglo-Persian Oil Company, which became British Petroleum, then BP Amoco following a merger
with Amoco (which was formerly Standard Oil of Indiana). The company is now known as BP.
4. Standard Oil of New York (Socony) became Mobil, which merged with Exxon
5. Standard Oil of California (Socal) became Chevron
6. Gulf Oil, most of which became part of Chevron
7. Texaco, which merged with Chevron in 2001
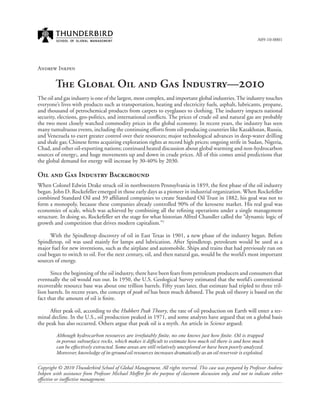
Exhibit 4’s list of the largest IOCs today is evidence of two factors: mergers and acquisitions, and the extent
to which the industry globalized in production and ownership. Based on market capitalization, the top 15 publicly
6. 6 A09-10-0001
traded (and in some cases, government-controlled) companies includes a diverse and global set of firms such as
Petrochina (China), Gazprom (Russia), Sinopec (China), Petrobras (Brazil), Total (France), and Eni (Italy).
The urge to get larger and more integrated can be seen in comments from the ONGC chairman. ONGC,
an Indian state-controlled firm and primarily an upstream company, had made public its commitment to par-
ticipate in the entire hydrocarbon value-chain. According to the former chairman of ONGC:
We have to be an integrated oil company. Every major global oil company is an integrated player.
I’m not being arrogant, but oil and gas is big business where the big boys play. You can survive in
this business only if you are integrated; otherwise, you will be out.8
Given the long product life cycles and the huge capital investment required in the oil industry, the large
IOCs were often described as stodgy and conservative. Before bankruptcy, Enron executives regularly derided
the oil majors as dinosaurs that were too slow moving and that would eventually become extinct. The reality,
of course, is very different. Oil majors like BP, Shell, ExxonMobil, and their predecessor companies have been
around for more than a century. Through experience that is occasionally painful, the IOCs have learned how
to deal with the enormous financial and political risks of the oil and gas industry. The IOCs take a long-term
view and recognize that cycles and uncertainty are an inherent part of the industry. Lee Raymond, former Exx-
onMobil CEO, said:
We’re in a commodity [business]. We go through peaks and valleys, but our business is to level
out the peaks and valleys, so that, over the cycle, our shareholders see an adequate return on their
investment.9
On the surface, the IOCs looked similar in terms of the activities they performed. All appeared to be
vertically integrated from exploration to retail distribution. However, there are fundamental organizational and
financial differences among the firms.The IOCs used various organizational designs to deal with vertical integra-
tion. ExxonMobil, for example, is organized around global businesses and global functions, with common global
operating processes, global enterprise back-office systems, such as SAP, and integrated operating structures at
major sites. BP announced in 2007 that it would adopt a global structure organized around different businesses.
The other IOCs tended to use more regional processes and regional management structures.
Exhibit 4. Top 15 Integrated Oil and Gas Companies, 2008
0
50
100
150
200
250
300
350
400
450
ExxonM
obil(U
SA
)
PetroC
hina
(C
hina)
R
oyalD
utchShell
C
hevron
(U
SA
)
BP
(UK
)
Total(France)
Petrobras(BR
Z)
Eni(Italy)
G
azprom
(R
ussia)
Sinopec(C
hina)
C
onocoPhillips(U
SA
)
StatoilH
ydro
(N
O
R
)
BG
(UK
)
R
osneft(R
ussia)
Ecopetrol(C
olom
bia)
Market Capitalization (billions of US$)
Source: PFC Energy. Eni, Gazprom, Petrochin, Petrobras, Sinopec, Rosneft, and StatoilHydro have both
publicly traded shares and government-owned shares. The government ownership ranges from 90% for
Petrochina to 32% for Petrobras. Gazprom is an integrated natural gas company. The other companies
on the list are involved in oil and/or natural gas.
7. A09-10-0001 7
Exhibit 5 provides one perspective on the origins and distinctive capabilities of a few major companies.
National Oil Companies
One of the most important trends of the new century has been the growing importance of the national oil com-
panies (NOCs). Although ExxonMobil, BP, and Shell are among the largest publicly traded companies in the
world, they do not rank in the top ten of the world’s largest oil and gas firms measured by reserves. The largest
oil and gas firms based on reserves are, by a large margin, national oil companies (NOCs) partially or wholly
state-owned. The NOCs control about 90% of the world’s oil and gas, and most new oil is expected to be found
in their territories.
Viewed from a business perspective, the NOCs have a mixed reputation. The national oil company of
Indonesia, Pertamina, was described a few years ago as a bloated and inefficient bureaucracy:
. . . [Pertamina] operated almost as a sovereignty unto itself, ignoring transparent business practices,
often acting independently of any ministry, and increasingly taking on the role of a cash cow for
then-President Suharto and his cronies. During the 32-year tenure of President Suharto, Pertamina
awarded 159 contracts to companies linked to his family and cronies. These contracts were awarded
without formal bidding or negotiation processes. . . Indonesian petroleum law dictated that every
aspect of operation in the country was subject to approval by Pertamina’s foreign contractor man-
agement body, Bppka. Dealing with the incomprehensible Bppka bureaucracy on simple matters,
such as acquiring work permits for expatriate personnel, can take hours of filling in applications
and months of waiting.10
Venezuela nationalized its oil industry in the 1970s and created Petróleos de Venezuela (PDVSA). PDVSA
developed a reputation for professionalism and competence and was relatively free from the corruption and
cronyism that pervaded, and continues to pervade, so many of the NOCs.11
By 1998, 36 foreign oil firms were
operating in Venezuela, and PDVSA had ambitious expansion plans. In 1999, Hugo Chávez became president
and almost immediately began to question the management and autonomy of PDVSA. After a bitter strike in
2002, PDVSA lost about two-thirds of its managerial and technical staff. From a peak of 2.9 million b/d in
1998, output was estimated by OPEC to be about 2.3 million b/d at the end of the decade, and the company
imported a significant amount of gasoline. As a company, PDVSA is indistinguishable from the government. Its
CEO, Rafael Ramírez, is also Minister of Energy. The company is required to spend a tenth of its investment
budget on social programs, which included sending low-cost heating oil to poor Americans. Company hiring
policy is based on social and political goals; e.g., candidates from larger families are given priority. In 2006, the
Venezuelan Congress approved new guidelines to turn 32 privately run oil fields over to state-controlled joint
ventures. ExxonMobil, alone among the foreign oil companies, rejected the new joint venture agreements, and
sold its stake in the 15,000 b/d Quiamare-La Ceiba field to its partner, Repsol YPF. ExxonMobil subsequently
filed an arbitration claim.
Exhibit 5. Distinctive Capabilities as a Consequence of Childhood Experiences: The Oil Majors
Company Distinctive Capability Historical Origin
Exxon Financial management Exxon’s predecessor, Standard Oil (NJ), was the
holding company for Rockefeller’s Standard Oil Trust
Royal Dutch/Shell Group Coordinating a decentralized
global network of 200+
operating companies
Shell Transport & Trading headquartered in London
and founded to sell Russian oil in China and the Far
East
BP “Elephant hunting” Discovered huge Persian reserves; went on to find the
Forties field (North Sea) and Prudhoe Bay (Alaska)
Eni Deal-making in politicized
environments
The Enrico Mattei legacy; the challenge of managing
government relations in post-war Italy
Mobil Lubricants Vacuum Oil Co. founded in 1866 to supply patented
petroleum lubricants
Source: Robert M. Grant, Contemporary Strategy Analysis, Oxford: Blackwell Publishing, 2005, p. 166.
8. 8 A09-10-0001
According to The Economist, nationalization has failed to live up to expectations almost everywhere. All
NOCs suffered to some extent from government intervention. Many NOCs operated as the de facto treasury
for the country. In Nigeria, for example, oil revenues represented more than 90% of hard currency earnings and
about 60% of GDP. Nigeria’s economic and financial crimes commission estimated that more than $380 billion
of government revenues had been stolen or misused since 1960.12
Some of the Middle Eastern NOCs are required
to hire large numbers of locals, leaving them heavily overstaffed. Others, for example in India and Russia, must
sell their products at subsidized prices. Underinvestment is a chronic problem for many NOCs, resulting in
countries like Indonesia and Iran, with huge reserves, having to import petroleum. Monopoly positions held by
many NOCs contribute to underinvestment. In Russia, Gazprom controls the pipeline network, making it dif-
ficult for other Russian gas producers, such as TNK-BP, to expand their production. Russia increasingly is using
its NOCs as agents of foreign policy. A dispute between Belarus and Russia in early 2007 resulted in disruption
of oil shipments to Western Europe. This prompted speculation in Germany that the government might rethink
its decision to phase out nuclear power because of uncertainty about oil supplied from Russia.
Some NOCs are well-run and profitable enterprises. Statoil of Norway is considered to be among the best
of the NOCs. In 2007, Statoil acquired Norsk Hydro in a $30 billion deal. According to analysts, the motivation
for the deal was that a larger company would make it easier for expansion outside Norway. The NOCs of Brazil
and Malaysia are also viewed as reasonably well-run companies. Petrobras has developed leading technology in
deep-water drilling and has a market capitalization rivaling that of the IOCs.
The role that NOCs will play in the future is not clear. Some analysts saw the NOCs as inefficient and
corrupt arms of government that would never compete in a true economic sense. Other analysts raise different
issues, suggesting that the NOCs are in a period of transition and will become competitive forces to be reckoned
with. Regardless of what happens, the NOCs and their sovereign owners control most of the world’s oil and gas
reserves. As Paolo Scaroni, the chairman of ENI, the Italian IOC, commented:
Big Western oil firms are like addicts in denial. The oil giants are trying to do business as usual as if
nothing was wrong. Yet they are, in fact, having trouble laying their hands on their own basic product.
State-owned national or state-controlled oil companies are sitting on as much as 90% of the world’s
oil and gas and are restricting outsiders’access to it. Worse, the best NOCs are beginning to expand
beyond their own frontiers and to compete with the oil majors for control over the remaining 10% of
resources. The first step in overcoming this predicament is admitting that it is a problem.13
Independents
Independents are the non-government-owned companies that focus on either the upstream or the downstream.
Many of these companies are sizable players and rank in the top 50 of all non-government-owned oil and gas
companies. As shown in Exhibit 6, the large independents in the upstream include EnCana and Talisman
(Canada), Devon Energy, Apache, Anadarko (United States), and Woodside (Australia).
In the downstream refining and marketing area, the largest independents are scattered around the world’s
largest energy-consuming countries (see Exhibit 7).The downstream independents have lower market capitaliza-
tions than the upstream independents.
Other Firms
In addition to the IOCs, NOCs, and independents, the oil and gas industry includes a huge number of other
firms that perform important functions. The oilfield services firms, the three largest of which are Schlumberger
(87,000 employees), Halliburton (51,000 employees), and Baker Hughes (35,000 employees), play a critical role
throughout the exploration, development, and production phases.These firms provide both products and services
that, according to Baker Hughes’ Web site, help oil and gas producers “find, develop, produce, and manage oil
and gas reservoirs.” Because the oil field service firms do not seek ownership rights to oil and gas reserves, many
analysts predict that their role will become increasingly important in the future as partners to the NOCs.
9. A09-10-0001 9
Thousands of other firms provide a vast array of services and products for the industry. For example, gas
utilities such as Gaz de France andTokyo Gas are major customers for gas producers. Pipeline companies distribute
gas, crude oil, and petroleum products. The firms involved in drilling and seismic services provide drilling rigs
and expertise for onshore and offshore wells.
The Oil and Gas Industry Value Chain
In every industry, there are various activities that must take place to transform inputs of raw materials, knowl-
edge, labor, and capital into end products purchased by customers. A value chain is a device that helps identify
the independent, economically viable segments of an industry.14
The oil and gas industry value chain is shown
Exhibit 6. Top 15 Independent Upstream Oil and Gas Companies
Based on Market Share
0
5
10
15
20
25
30
35
40
45
50
O
ccidental
C
N
O
O
C
Encana
O
N
G
C
D
evonBH
P
Billiton
A
pache
C
anadian
N
at'lX
TO
Energy
IN
PEX
W
oodside
A
nadarko
EO
G
R
esources
Talism
anSouthw
estern
Market Share (eoy, 2008)
0
5
10
15
20
25
30
35
40
45
50
O
ccidental
C
N
O
O
C
Encana
O
N
G
C
D
evonBH
P
Billiton
A
pache
C
anadian
N
at'lX
TO
Energy
IN
PEX
W
oodside
A
nadarko
EO
G
R
esources
Talism
anSouthw
estern
0
5
10
15
20
25
30
35
40
45
50
O
ccidental
C
N
O
O
C
Encana
O
N
G
C
D
evonBH
P
Billiton
A
pache
C
anadian
N
at'lX
TO
Energy
IN
PEX
W
oodside
A
nadarko
EO
G
R
esources
Talism
anSouthw
estern
Market Share (eoy, 2008)
Source: PFC Energy. BHP Billiton is a diversified company primarily focused on minerals.
The value of its oil and gas E&P business was estimated by PFC to be $25-28 billion.
Exhibit 7. Top 15 Independent Downstream Oil and Gas Companies
Based on Market Share
0
5
10
15
20
25
30
35
40
R
elianceForm
osa
Petro
V
alero
Indian
O
il
N
ippon
O
il
TonenG
eneralSekiyu
SK
Energy
S-O
il
Sunoco
N
esteO
il
PK
N
O
rlen
Tupras
C
osm
o
O
il
Idem
itsu
K
osan
Tesoro
Market Share (eoy, 2008)
0
5
10
15
20
25
30
35
40
R
elianceForm
osa
Petro
V
alero
Indian
O
il
N
ippon
O
il
TonenG
eneralSekiyu
SK
Energy
S-O
il
Sunoco
N
esteO
il
PK
N
O
rlen
Tupras
C
osm
o
O
il
Idem
itsu
K
osan
Tesoro
0
5
10
15
20
25
30
35
40
R
elianceForm
osa
Petro
V
alero
Indian
O
il
N
ippon
O
il
TonenG
eneralSekiyu
SK
Energy
S-O
il
Sunoco
N
esteO
il
PK
N
O
rlen
Tupras
C
osm
o
O
il
Idem
itsu
K
osan
Tesoro
Market Share (eoy, 2008)
Source: PFC Energy. Besides refining, Reliance is also involved in exploration and
production, chemicals, and textiles.
10. 10 A09-10-0001
in Exhibit 8. Value refers to what customers are willing to pay for, and so the value chain helps to identify the
specific activities that create value throughout the chain. Companies can use value chains to determine where
they are strong and where they have limited competitive strength. All industries have upstream (close to raw
materials and basic inputs) and downstream (close to the customer) segments. In the oil and gas industry, the
terms upstream, downstream, and midstream are important descriptors of the industry activities.
Upstream: Exploration, Development, and Production
Upstream activities include exploration, development, and production. In simple terms, after a lease is obtained,
oil and gas are discovered during exploration; the discovery requires development; and production is the long-
term process of drilling and extracting oil and gas. Since exploration and development must take place where
resources are located and most oil ownership regimes are based on state sovereignty, companies have to deal
with very complex government policies and regulations. Most countries grant oil and gas development rights to
private companies through a process of either negotiation or bidding. The main aim of the private company is
profit maximization, whereas the host country government is interested in maximizing revenue. Not surprisingly,
these two aims often conflict. Most agreements between oil companies and governments come under the term
production sharing agreements.
The method used to bid for, grant, and then renew or extend oil and gas rights varies from country to
country. Once the rights to explore are acquired, a well is drilled. A financial analysis is a determining factor in
the classification of a well as an oil well, natural gas well, or dry hole. If the well can produce enough oil or gas
to cover the cost of completion and production, it will be put into production. Otherwise, it is classified as a dry
hole, even if oil or gas is found. The percentage of wells completed is used as a measure of success. Immediately
after World War II, 65% of the wells drilled were completed as oil or gas wells. This percentage declined to about
57% by the end of the 1960s. It then rose steadily during the 1970s to reach 70% at the end of that decade,
primarily because of the rise in oil prices. This was followed by a plateau or modest decline through most of the
1980s. Beginning in 1990, completion rates increased dramatically to 77%.The increases of the 1990s had more
to do with new technology than higher prices.15
Most upstream projects are done in some type of partnership structure. For example, a production sharing
agreement for the Azeri, Chirag, and Gunashli development in Azerbaijan was signed in September 1994. BP is
the operator with a 34.1% stake; the partners were Chevron with 10.3%, Socar 10%, Inpex 10%, Statoil 8.56%,
ExxonMobil 8%, TPAO 6.8%, Devon 5.6%, Itochu 3.9%, and Hess 2.7%.
Exhibit 8. Global Oil and Gas Value Chain
Development
Production
Transportation
Ship, Pipeline
Refining
Jet Fuel
Heating Oil
Lubricants
Asphalt
R&D
Motor Fuels
(gas/diesel)
Exploration
Commodity Chemicals
Specialty Chemicals
Upstream
(Exploration & Production)
Downstream
(Refining & Marketing)
Oil Trading
Lease Access
Gas Oil
Gas Processing
LNG Liquefaction
Transportation
Pipeline Gas to Market
Transportation
Ship
LNG Regasification
Petrochemicals
Midstream
(Transportation & Trading)
11. A09-10-0001 11
Reservoir Management
For companies involved in the upstream, reservoir management is an essential skill. Reservoir management involves
ensuring that reserves are replaced and that existing oil and gas fields are efficiently managed. Asset acquisition,
divestiture, and partnering are key aspects of reservoir management. Upstream companies try to replace more
than 100% of the oil and gas produced. Determining the level of proved reserves (the amount of oil and gas the
firm is reasonably certain to recover under existing economic and operating conditions) is a complex process.
Consider the following comment on the auditing of reserves:
Though the word “audit” is customarily used for these evaluations, oil and gas reserves cannot be
“audited” in the conventional sense of a warehouse inventory or a company’s cash balances. Rather,
“proved reserves” are an approximation about formations thousands and even tens of thousands of
feet below ground. Their size, shape, content, and production potential are estimated in a complex
combination of direct evidence and expert interpretation from a variety of scientific disciplines and
methodologies. Added to the science is economics; if it costs more to produce oil from a reservoir
than one can sell it for profitably, then one cannot “book it” as a reserve. Reserves are “proved”
if there is a 90% chance that ultimate recovery will exceed that level. As perverse as it may sound,
under the “production sharing agreements” that are common in many oil-producing countries, when
the price goes up, proved reserves go down.16
Matthew Simmons, founder of the energy-focused investment bank Simmons and Company, commented
that “95% of world ‘proven reserves’ are in-house guesses”; “most reserve appreciation is exaggerated”; and “95%
of the world’s ‘proven reserves’ are unaudited.”17
The pressure to replace reserves has on occasion resulted in some
unintended behaviors. In 2004, Shell’s CEO left earlier than anticipated after revelations that the company had
overstated its reserves by nearly 25%.
Upstream Profitability
Profitability is a function of costs and commodity prices. According to Simmons and Company, Saudi Arabia
oil producers could make a profit if the price of crude oil fell to $10/barrel; the Canadian oil sands company
Suncor could be profitable at $25/barrel with existing facilities; North Sea oil producers could be profitable at
$25/barrel with existing facilities; Venezuelan heavy oil required a price of $25-30/barrel for profitability; new
facilities in the Canadian oil sands would need a price of at least $50/barrel to make a profit; and for U.S. ethanol
production to be competitive, the price of crude had to be at least $50/barrel.18
Midstream: Trading and Transportation
The midstream in the value chain comprises the activities of storing, trading, and transporting crude oil and
natural gas. As shown in Exhibit 8, once oil and gas are in production, there is a divergence in the value chain.
Crude oil that is produced must be sold and transported from the wellhead to a refinery. Natural gas must also
be moved to markets via pipeline or ship; we provide an overview of the gas business in a later section.
Crude oil has little or no value until it is refined into products such as gasoline and diesel. Thus, producers
of crude oil must sell and transport their product to refineries. The market for crude oil involves many players,
including refiners, speculators, commodities exchanges, shipping companies, IOCs, NOCs, independents, and
OPEC. Market-making activities in the oil business have become front page news, and the daily price of crude
oil is as frequently reported in the news as the weather.
The ease by which liquids can be transported is a key reason why crude oil has become such an important
source of energy. Although pipelines, ships, and barges are the most common transportation platforms for crude
oil, railroads and tank trucks are also used in some parts of the world. The shipping industry is very fragmented
and, because oil tankers travel for the most part in international waters, largely unregulated. New technologies
in ship building in recent decades have allowed ships to become larger and safer.
12. 12 A09-10-0001
Pipelines in Alaska, Chad and Cameroon, Russia, and other countries have allowed oil to be transported
from very remote locations to markets. The construction and management of pipelines is fraught with geo-
political intrigue, which means the pipeline development process takes many years or even decades. Pipelines
that cross national borders are enormously complex to negotiate and build. Countries with pipelines that cross
their territory have been known to use them as bargaining chips. Terrorists often sabotage pipelines and, in some
countries, such as Nigeria and Iraq, oil theft from pipelines and the associated environmental and safety issues
are daily occurrences.
Downstream: Oil Refining and Marketing
The refining of crude oil produces a variety of products, including gasoline, diesel fuel, jet fuel, home heating
oil, and chemical feedstocks. In the U.S., about 60% of refinery product volume is gasoline. Products are sold
directly to end users though retail locations, directly to large users, such as utilities and commercial customers,
and through wholesale networks. A merchant refinery is stand-alone refinery not part of an integrated distribu-
tion system. For example, Hess and PDVSA jointly operate a merchant refinery in St. Croix, U.S. Virgin Islands,
with a crude oil processing capacity of 495,000 b/d, one of the largest in the world. Increasingly, NOCs such as
Saudi Aramco are jumping into the merchant refining business as a means of capturing additional value added
from their crude production. Although it is more economical to transport crude oil versus refinery products such
as gasoline, the U.S. imports about 10% of its gasoline supply. The volume of imported refinery products is a
function of regional arbitrage opportunities due to short-term swings in local supply and demand balances.
The financial performance of the refining industry has always been volatile.The primary measure of industry
profitability is the refining margin, which is the difference between the price of crude oil and that of the refined
products. Crude prices can fluctuate for many reasons. Weather in the Gulf Coast states, political instability in
oil-producing countries, or OPEC actions, for example, all influence the price of crude oil. These fluctuations
were not always accompanied by matching changes in the price of finished products, leading to large expansions
or contractions of the margin.
Exhibit 9 shows that profits on refining are usually lower than profits in other lines of business for petroleum
companies. To put the downstream business in perspective, Lee Raymond, former ExxonMobil CEO, said in
1997, “I’ve been pessimistic on refining for 30 years, and I’ve run the damn places.”19
In 1999, BP CEO John
Browne announced an aggressive plan to improve returns at BP by sharply reducing global refining capacity in
the expectation of persistently weak profit margins.
Shell’s head of downstream operations described the business as, “Grubbing [i.e., begging] for pennies in
a streetYIf this industry, and especially the downstream, were to let its cost base slip, then we’re going to have
difficulty getting through those down-low cycles.”20
There are several reasons why the price of finished products does not track that of the crude inputs. Ac-
cording to the New York Mercantile Exchange:
A petroleum refiner, like most manufacturers, is caught between two markets: the raw materials he
needs to purchase and the finished products he offers for sale. The prices of crude oil and its principal
refined products, heating oil and unleaded gasoline, are often independently subject to variables of
supply, demand, production economics, environmental regulations, and other factors. As such, refin-
ers and non-integrated marketers can be at enormous risk when the prices of crude oil rise while the
prices of the finished products remain static, or even decline. Such a situation can severely narrow
the crack spread, the margin a refiner realizes when he procures crude oil while simultaneously sell-
ing the products into an increasingly competitive market. Because refiners are on both sides of the
market at once, their exposure to market risk can be greater than that incurred by companies who
simply sell crude oil at the wellhead, or sell products to the wholesale and retail markets.21
What this means is that profitability of refining is set by a combination of:
1. The supply and demand for refinery products (i.e., if refining capacity is tight, the refining margins
are high and refineries make a lot of money) and,
13. A09-10-0001 13
2. Refinery product prices, which are set by a combination of the supply and demand of refinery products
and crude oil prices.
Gasoline prices can be high because of high crude prices, but refining margins and refining profitability can
be weak if the demand for refinery products is also weak. In 2005-2006, U.S. refining experienced an unusual
situation with both high crude prices and high refining margins.
The number of operating U.S. refineries dropped from 195 in 1987 to 141 in 2009, but during that period
U.S. production capacity increased from less than 15 million b/d to more than 17 million b/d.22
The increased
refining capacity came from de-bottlenecking and expanding existing refineries, which is much cheaper than
building new ones. Refinery capacity utilization and profitability is cyclical and highly dependent on overall
economic activity. In the early 1980s, U.S. refinery utilization was about 70%. In 2007, capacity utilization was
90% and profit margins were high. By 2009, utilization was about 85% and margins were falling.
In contrast to the situation in the United States and Europe, new refineries are being built in other countries.
In 2009, Reliance Industries completed the world’s largest refinery complex at Jamnagar in India. The Jamnagar
complex has a capacity of 1.24 million b/d, and the number of construction workers at the site reached about
150,000. In the near term, Jamnagar is expected to focus on export markets. The largest market for Jamnagar
is in the Middle East followed by Africa, Europe, and the United States. Shipping costs are only pennies per
gallon for finished products.
Gasoline Retailing
In the gasoline retail sector, competition is intense and margins have eroded over the past 10-15 years. For the
IOCs, returns on capital employed are much lower in retail than in other business areas. The entry of hypermar-
kets/supermarkets into retail gasoline sales in Western Europe had displaced small dealer networks and national
players found they could make good money from convenience store sales. That said, Shell’s head of downstream
dismissed the notion that convenience store sales should be the focus for the fuels marketing business:
The industry thought it could save itself with Coke. We found out that maybe the fuels game is more
our game than the convenience store game. It’s not a saviour for our industry. The important thing
Exhibit 9. ROI on Domestic Refining and Marketing versus
Other Lines of Business
Return on Investment (percent)
-5
0
5
10
15
20
25
30
1977
1979
1981
1983
1985
1987
1989
1991
1993
1995
1997
1999
2001
2003
2005
2007
ROI on Domestic
Refining & Marketing
ROI on Other Lines
Of Business
Return on Investment (percent)
-5
0
5
10
15
20
25
30
1977
1979
1981
1983
1985
1987
1989
1991
1993
1995
1997
1999
2001
2003
2005
2007
-5
0
5
10
15
20
25
30
1977
1979
1981
1983
1985
1987
1989
1991
1993
1995
1997
1999
2001
2003
2005
2007
ROI on Domestic
Refining & Marketing
ROI on Other Lines
Of Business
Source: “Return on Investment in U.S. and Foreign Refining and Marketing and All Other
Lines of Business for U.S. Major Oil and Gas Companies 1981-2008,” United States Energy
Information Agency (EIA), December 2009.
14. 14 A09-10-0001
in retail is that you need to keep on changing things: that you keep different customer value proposi-
tions and you keep changing them all the time.23
In the U.S., supermarket and “petropreneur” entry into gasoline sales is also occurring, although not with
the same speed as in Europe. In most countries, gasoline is seen as a commodity product, which meant spending
money on brand development has questionable results. The weakness of brands favored the entry of supermar-
kets because they compete on price and proximity and sell fuel as a loss leader. With traditional retail barriers to
competition gone, the largest IOC retailers are selling company-owned stores. In the U.S., new entrants, such
as Tosco (subsequently part of ConocoPhillips) and Valero, were able to buy refinery and retail assets and knit
together profitable retail networks integrated with their refinery acquisitions.
Natural Gas
Natural gas, an important global energy source, is a naturally occurring fossil fuel found by itself or near crude
oil deposits in deep underground pockets. Like oil, the largest gas reserves are found in countries such as Rus-
sia, Venezuela, Iran, and throughout the Middle East. In the U.S., gas accounts for approximately a quarter of
the energy consumed, and the OECD average is 22%. Natural gas represented less than 4% of China’s energy
consumption in 2009, but demand is rising by more than 20% per year.
For many years, natural gas was a niche product because, unlike crude oil, natural gas is not easily trans-
ported. Without a pipeline infrastructure, natural gas in its gas form cannot be transported far from its source.
In some parts of the world, such as Canada, the U.S., and Western Europe, a network of pipelines allows gas to
be distributed efficiently. In the U.S., there are 160 gas pipeline companies operating more than 285,000 miles
of pipe. In other parts of the world, such as offshore Africa or Aceh province in Indonesia, pipelines to customers
are not feasible. To transport the “stranded” gas, it must be converted to LNG. To liquefy natural gas, impurities
such as water, carbon dioxide, sulfur, and some of the heavier hydrocarbons are removed. The gas is then cooled
to about -259 degrees F (-162 degrees C) at atmospheric pressure to condense the gas to liquid form. LNG is
transported by specially designed cryogenic sea vessels and road tankers.
Historically, the costs of LNG treatment and transportation were so huge that development of gas reserves
was slow. In recent years, LNG has moved from being a niche product to a vital part of the global energy busi-
ness. As more players take part in investment, both in upstream and downstream, and as new technologies are
adopted, the prices for construction of LNG plants, receiving terminals, and ships have fallen, making LNG
a more competitive energy source. LNG ships are also getting much larger. The larger ships, plus larger LNG
trains (i.e., plants to convert the gas to LNG), are expected to result in a 25% reduction in delivery cost relative
to the cost in 2000. In addition, natural gas to liquid technology provides an alternative to LNG and converts
gas to liquid products, such as fuels and lubricants, that can be easily transported.
Major structural changes are occurring in the gas business. A short-term LNG market was virtually non-
existent a decade ago. Long-term contracts were sought to ensure security of supply for the buyer and security
of revenue for the producer. Recent changes in the LNG market and in LNG shipping have increased flexibility
for producers and consumers, and contracts are being negotiated for shorter periods of time. The agreement to
develop the huge Qatargas 2 project, jointly owned by ExxonMobil and Qatar Petroleum, was finalized in 2002
without contracts for gas sales in place. An LNG ship can deliver its gas anywhere there is an LNG terminal,
making LNG almost as flexible in delivery as crude oil (although a reluctance of many communities to allow
terminals to be developed has been a growth constraint).
There is also speculation that the rapid growth in Middle East LNG supply could lead to a global conver-
gence in gas pricing and markets, with LNG someday becoming a traded commodity. As well, buyers and sellers
have been taking on new roles. Buyers have been investing in the upstream, including liquefaction plants (e.g.,
Tokyo Gas and the Tokyo Electric Power Company have invested in the Darwin liquefaction plant in Australia).
Producers, such as BP and Shell, have leased capacity at terminals and are extending their role into trading.
New buyers have been emerging, including independent power producers. Finally, gas produced from shale is
becoming increasingly important as an energy source.
15. A09-10-0001 15
Petrochemicals
Although all of the major IOCs are involved in chemicals to some degree, they have different strategic approaches.
ExxonMobil Chemical, one of the world’s largest chemical businesses, included both cyclical commodity type
products, such as olefins and polyethylene, as well as a range of less cyclical specialty businesses. Many of Exxon-
Mobil’s refineries and chemical plants are co-located, providing opportunities for shared knowledge and support
services and the creation of product-based synergies. In the past, BP and Shell had chemical businesses that were
among the largest in the world.24
In 2005, BP decided that its chemical business was non-core and divested the
majority of the business. BP’s remaining chemicals businesses became part of the refining and marketing division,
and were no longer considered a separate corporate division. Shell also downsized its chemicals business. The
rising players in chemicals are in the Middle East and Asia, and included NOCs, such as Sabic (Saudi Arabia)
and Sinopec (China), and non-state-owned companies, such as Reliance (India). There is some concern in the
industry that excess capacity is being created in Asia and especially in commodity products in China.
Evolution of the Industry
Innovation and Technology
Innovation plays a key role in all parts of the oil and gas industry. Innovations in areas such as deep water drill-
ing and LNG shipping were discussed earlier. In the upstream, several key technological improvements have
been developed in the past few decades, including increased use of 3-D seismic data to reduce drilling risk, and
directional and horizontal drilling to improve production in reservoirs.25
Innovations in financial instruments
were used to limit exposure to resource price movements. In oilfield management, wireless technologies allowed
for faster and cheaper communication than the traditional wired underground infrastructure. In refining, nano-
technology has enabled refiners to tailor refining catalysts to accelerate reactions, increase product volumes, and
remove impurities, which has led to increased refining capacity. In retailing, innovations such as unmanned
stations have reduced retail costs.
Mergers and Acquisitions
Mergers and acquisitions have been an important element in the oil and gas industry since its inception. Although
the mega-mergers, such as BP-Amoco, Total-PetroFina, Chevron-Texaco and Exxon-Mobil, receive much of the
press, there are also many smaller deals. Exhibit 10 provides a list of the largest deals in 2008 (a relatively slow
year for deals because of the global recession). It is interesting to note that many of the acquiring firms are from
emerging markets.
In looking at the mega-M&A deals done over the past few decades, one might conclude that eventually
there will only be a handful of oil companies in the world. The reality is different. Research shows that the oil
industry is much less concentrated today than it was 50 years ago.26
There are opportunities for new entrants
despite the huge size of the largest IOCs and NOCs. In the downstream in the 1990s, new entrants, such as
Tosco, Premcor, and Petroplus, had a significant impact on industry structure. In chemicals, Ineos, the privately
held British company, grew through a series of related acquisitions to become the world’s third largest chemical
company with sales of about $33 billion. In the upstream, the huge financial scale of projects such as Sakhalin I
and II or Qatargas 2 make it unlikely that a new entrant could challenge the IOCs. However, if NOCs in China
and India continue to acquire and grow, they may develop the technological and financial skills to compete for
the largest and most complex upstream projects.
China and India
In 1998, China became a net importer of oil for the first time. In 2006, China overtook Japan to become the
world’s second largest importer. By 2030, China will likely be importing about 80% of its oil. Clearly, China
and Chinese companies are going to be major players in the oil and gas industry. Thousands of gas stations are
being built, and Chinese companies are aggressively investing in upstream projects around the world. Unlike
the U.S. and Europe, China has no qualms about allowing its oil industry to invest in countries like Sudan and
16. 16 A09-10-0001
Iran. On the retail side in China, prices are regulated, resulting in unintended consequences. If the government
increases prices, especially for diesel, there might be social unrest. Because refiners lose money on diesel, they
cut back on diesel production, which can lead to diesel shortages and increases in diesel imports. State-owned
refiners have little capital available for upgrades and modernization and often purchase low-quality crudes high
in sulfur content. China has much less stringent environmental regulations than the developed world. More
stringent regulations would mean higher fuel costs. As a comparison, the United States allowed maximum sulfur
concentrations of 15 parts per million for most diesel fuels, while China allowed up to 2,000 parts per million.27
China’s cities are among the most polluted in the world.
India is also a force to be reckoned with in the global oil and gas industry. India, the fifth largest oil con-
sumer, needs energy to feed its rapidly growing and industrializing economy. Companies such as Reliance are
moving aggressively into the upstream, and stodgy state-owned companies such as ONGC, Oil India Limited,
and Gas Authority of India are slowly becoming more productive. Like China, India is far from self-sufficient
in energy and must find new energy sources.
Industry Substitutes and Alternative Fuels
The role and future of non-hydrocarbon-based fuels and energy sources has become a critical issue for policy-
makers and energy companies. Various factors are contributing to a large investment flow into alternative fuel
projects, including the rapid rise in oil and gas prices in recent years, concerns about global climate change, per-
ceived competitive opportunities by energy companies (new entrants and entrenched players), and government
subsidies. Forecasts by the International Energy Agency suggest biofuels output could rise to the equivalent of
more than five million barrels of crude oil a day by 2011, close to triple the output of 2005. Deutsche Bank is-
sued a provocative industry report in 2009 called “The Peak Oil Market” that says, “We forecast a game change.
U.S. and then global oil demand will fall dramatically once the high-efficiency fleet hits critical mass; competing
structurally cheaper natural gas will exacerbate the pace of demand decline. In our view, global oil demand peaks
in 2016, with oil prices, before a long, tandem, decline.”28
Exhibit 10. Largest Deals in Oil and Gas in 2008
Target Target Country Acquiror Acquiror Country Deal Value*
Duvernay Oil Canada Shell Canada Canada 5.5
Hunt Petroleum United States XTO Energy United States 4.2
Queensland Gas Australia BG Group Australia 3.3
Imperial Energy United Kingdom Oil and Natural Gas Co.
(state-owned)
India 2.7
Awilco Offshore Norway China National Offshore Oil
Corporation (state-owned)
China 2.5
Tanganyika Oil Canada China Petroleum (state-owned) China 2.0
Anadarko Petroleo Brazil StatoilHydro Norway 1.8
Bois d’Arc United States Stone Energy United States 1.7
Grey Wolf United States Precision Drilling Trust Canada 1.6
First Calgary Petroleums Canada Eni SpA Italy 1.2
Esso Brasileira de Petroleo Brazil Cosan Brazil 1.0
PEARL Energy Singapore Mubadala Development United Arab
Emirates
0.9
Sunshine Gas Australia Queensland Gas Australia 0.8
Enterprise Texas Pipeline United States Duncan United States 0.7
Solana Resources Canada Gran Tierra Canada 0.7
Uranquity Power Station Australia Origin Energy Australia 0.7
Burlington Resources
Nederland Petroleum
Netherlands Nuon Netherlands 0.6
Saxon Energy Canada Schlumberger United States 0.6
Cyries Energy Canada Iteration Energy Canada 0.6
*Billions of U.S. dollars, including net debt of target company.
Source: Thomson Financial.
17. A09-10-0001 17
What’s Next for the Global Oil Industry?
In 2010, a few predictions seem fairly safe: the global demand for oil and gas will continue to rise over the next
few decades; the NOCs will continue to expand beyond their home markets; finding new sources of oil and gas
will get harder and require innovative new technologies; investment in non-hydrocarbon energy sources will
continue; the industry will remain one of the most vital for the global economy; and, despite the high prices
of recent years, the industry will continue to go though up-and-down cycles. Finally, the oil and gas firms, and
especially the IOCs, will continue to do what they have done for more than a century: take a long-term view,
invest for the future, push the boundaries of technology, and seek new resources and markets in every corner of
the world.
Notes
1
Alfred D. Chandler,”The Enduring Logic of Industrial Success,” Harvard Business Review, 1990, March-April, 68 Issue
2, pp. 130-140.
2
Leonardo Maugeri, “Oil: Never Cry Wolf—Why the Petroleum Age Is Far from Over,” Science, 2004, 304, pp. 1114-
1115.
3
Fox News, Transcript: Exxonmobil’s Lee Raymond, Monday, 2005, October 17, http://www.foxnews.com.
4
“The Fortune 500 Medians,” Fortune, 1996, April 29, pp. 23-25.
5
www.opec.org.
6
Richard Auty, Sustaining Development in Mineral Economies: The Resource Curse, Thesis, 1993, London: Routledge.
7
Roger Stern, “Iran Actually is Short of Oil: Muddled Mullahs,” International Herald Tribune, 2007, January 8, www.iht.
com.
8
“We Have to Be An Integrated Oil Company,” Hindu Business Line, 2003, August 10, www.thehindubusinessline.
com.
9
Fox News, Transcript.
10
“Indonesia Considers Legislation That Would End Pertamina’s 30-year Petroleum Monopoly,” Oil & Gas Journal, 1999,
July 26, pp. 27-32.
11
“Special Report, National Oil Companies,” The Economist, 2006, August 12, pp. 55-57.
12
Dino Mahtani, “Nigeria Struggles to Eliminate Corruption from Its Oil Industry,” Financial Times, 2007, January 11,
p. 8.
13
“Face Value: Thinking Small,” The Economist, 2006, July 22, p. 64.
14
ThevaluechainconceptwasdevelopedbyHarvardProfessorMichaelPorter,andisthemainthemeofthebookCompetitive
Advantage: Creating and Sustaining Superior Performance (Free Press, 1985). The concept was used by Porter to explain
how firms created competitive advantage. Porter’s generic value chain included primary and support activities. Primary
activities included: inbound logistics, operations (production), outbound logistics, marketing and sales (demand), and
services(maintenance).Supportactivitiesincluded:administrativeinfrastructuremanagement,humanresourcemanagement,
technology (R&D), and procurement.The extension of the firm value chain to the industry is logically consistent, especially
in the oil and gas industry where the IOCs compete across most of the major industry segments.
15
Oil Price History and Analysis, WTRG Economics, http://www.wtrg.com/prices.htm.
16
Daniel Yergin, “How Much Oil Is Really Down There?” Wall Street Journal, 2006, April 27, p. A.18.
17
http://www.simmonsco-intl.com/files/HBS%20Energy%20Forum.pdf.
18
http://www.simmonsco-intl.com.
19
Richard Teitelbaum, “Exxon: Pumping up Profits,” Fortune, 1997, April 28.
20
Ed Crooks, “Interview: Rob Routs: You have to Keep Changing,” Financial Times, 2006, October 20, Special Report
Energy, p. 10.
21
New York Mercantile Exchange, Crack Spread Handbook, 2000, p. 4.
22
http://tonto.eia.doe.gov.
23
Ed Crooks, Financial Times.
24
Peter Partheymuller, Chemicals, Hoover’s, http://premium.hoovers.com.
25
WTRG Economics, http://www.wtrg.com/prices.htm.
26
Pankaj Ghemawat & Fariborz Ghadar, “The Dubious Logic of Global Megamergers,” Harvard Business Review; 2000,
July-August, 78 Issue 4, pp. 65-72.
27
Keith Bradsher, “Trucks Power China’s Economy, at a Suffocating Cost,” New York Times, 2007, December 8, www.
nytimes.com.
28
Deutsche Bank Securities Inc., “The Peak Oil Market: Price Dynamics at the End of the Oil Age,” October 4, 2009, p.
2.