Download to read offline


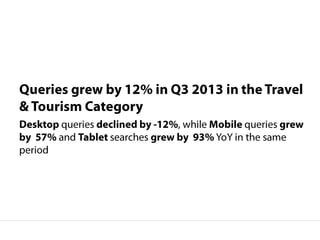
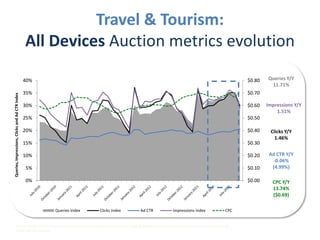
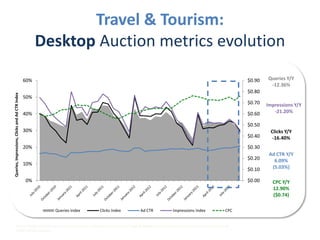
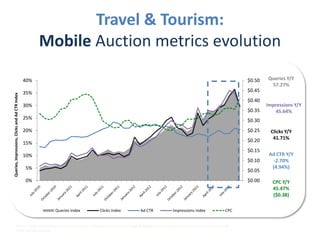
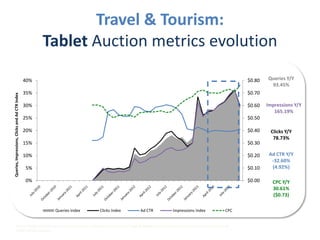
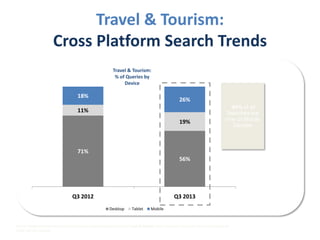


The document contains data on auction metrics and search trends for travel and tourism across different devices (all devices, desktop, mobile, tablet). It shows metrics like query volume year-over-year growth, impressions growth, click growth, average cost-per-click for Q3 2013 and 2012. It also shows the shifting share of queries by device from 2012 to 2013. Additional facts on traveler behavior and online activities are provided at the end.


