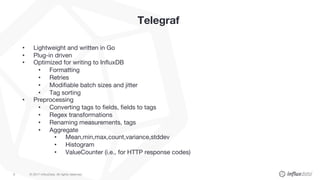
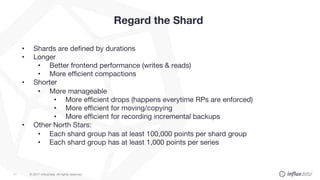
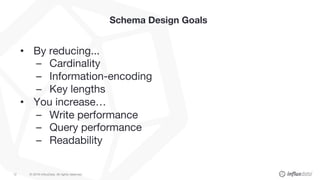
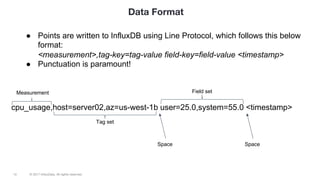
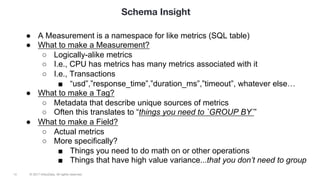
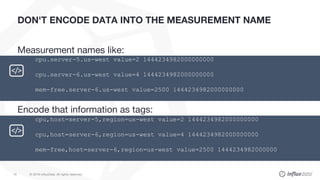
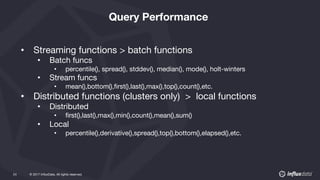
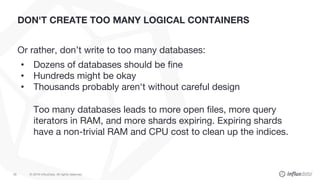
Sam Dillard, Solutions Architect
Getting Started Series
Optimizing your TICK Stack
© 2017 InfluxData. All rights reserved.2 © 2017 InfluxData. All rights reserved.2
✓ Optimizing
• Hardware/Architecture
• Schema
• Configuration
• Queries
✓ Q&A
Agenda
Hardware & Architecture
© 2017 InfluxData. All rights reserved.4
Resource Utilization
• No Specific OS Tuning Required
• OSS
• 70% cpu utilization - need head room for
• Peak periods
• Compactions
• Supporting node failure (clusters only)
• Backfilling data
• Enterprise (clustered)
• 49% cpu on each node (ideal)
© 2017 InfluxData. All rights reserved.5 © 2017 InfluxData. All rights reserved.5
© 2017 InfluxData. All rights reserved.6
Telegraf
• Lightweight and written in Go
• Plug-in driven
• Optimized for writing to InfluxDB
• Formatting
• Retries
• Modifiable batch sizes and jitter
• Tag sorting
• Preprocessing
• Converting tags to fields, fields to tags
• Regex transformations
• Renaming measurements, tags
• Aggregate
• Mean,min,max,count,variance,stddev
• Histogram
• ValueCounter (i.e., for HTTP response codes)
© 2017 InfluxData. All rights reserved.7
Telegraf
CPU
Mem
Disk
Docker
Kubernetes
/metrics
Kafka
MySQL
Process
-transform
-decorate
-filter
Aggregate
-mean
-min,max
-count
-variance
-stddev
File
InfluxDB
Kafka
CloudWatch
CloudWatch
© 2017 InfluxData. All rights reserved.8
Telegraf
InfluxDB
Telegraf
Telegraf
Telegraf
Telegraf
Telegraf
Telegraf
Telegraf
Telegraf
Telegraf
Telegraf
Telegraf
Telegraf
Message Queue Telegraf
© 2017 InfluxData. All rights reserved.9
Telegraf
InfluxDB
Telegraf
Telegraf
Telegraf
Telegraf
Telegraf
Telegraf
Telegraf
Telegraf
Telegraf
Telegraf
Telegraf
Telegraf
Telegraf
Telegraf
Telegraf
Schema
© 2017 InfluxData. All rights reserved.11
Regard the Shard
• Shards are defined by durations
• Longer
• Better frontend performance (writes & reads)
• More efficient compactions
• Shorter
• More manageable
• More efficient drops (happens everytime RPs are enforced)
• More efficient for moving/copying
• More efficient for recording incremental backups
• Other North Stars:
• Each shard group has at least 100,000 points per shard group
• Each shard group has at least 1,000 points per series
© 2018 InfluxData. All rights reserved.12
Schema Design Goals
• By reducing...
– Cardinality
– Information-encoding
– Key lengths
• You increase…
– Write performance
– Query performance
– Readability
© 2018 InfluxData. All rights reserved.13 © 2017 InfluxData. All rights reserved.13
Data Format
● Points are written to InfluxDB using Line Protocol, which follows this below
format:
<measurement>,tag-key=tag-value field-key=field-value <timestamp>
● Punctuation is paramount!
cpu_usage,host=server02,az=us-west-1b user=25.0,system=55.0 <timestamp>
Measurement
Tag set
Field set
Space Space
© 2018 InfluxData. All rights reserved.14 © 2017 InfluxData. All rights reserved.14
Schema Insight
● A Measurement is a namespace for like metrics (SQL table)
● What to make a Measurement?
○ Logically-alike metrics
○ I.e., CPU has metrics has many metrics associated with it
○ I.e., Transactions
■ “usd”,”response_time”,”duration_ms”,”timeout”, whatever else…
● What to make a Tag?
○ Metadata that describe unique sources of metrics
○ Often this translates to “things you need to `GROUP BY`”
● What to make a Field?
○ Actual metrics
○ More specifically?
■ Things you need to do math on or other operations
■ Things that have high value variance...that you don’t need to group
© 2018 InfluxData. All rights reserved.15
DON'T ENCODE DATA INTO THE MEASUREMENT NAME
Measurement names like:
Encode that information as tags:
cpu.server-5.us-west value=2 1444234982000000000
cpu.server-6.us-west value=4 1444234982000000000
mem-free.server-6.us-west value=2500 1444234982000000000
cpu,host=server-5,region=us-west value=2 1444234982000000000
cpu,host=server-6,region=us-west value=4 1444234982000000000
mem-free,host=server-6,region=us-west value=2500 1444234982000000
© 2018 InfluxData. All rights reserved.16
DON’T OVERLOAD TAGS
BAD
GOOD: Separate out into different tags:
xxx
cpu,server=localhost.us-west value=2 1444234982000000000
cpu,server=localhost.us-east value=3 1444234982000000000
cpu,host=localhost,region=us-west value=2 1444234982000000000
cpu,host=localhost,region=us-east value=3 1444234982000000000
© 2018 InfluxData. All rights reserved.17 © 2018 InfluxData. All rights reserved.17
Cardinality
• The number of unique database, measurement, tag set, and field key combinations in an InfluxDB instance.
• In practice we generally just care about the tagset
For example:
Measurement:
• http
Tags:
• host -- 35 possible hosts
• appName -- 10 possible apps
• datacenter -- 4 possible DCs
Fields:
• responseCode
• responseTime
Assuming each app can reside on each host, total possible series cardinality for this measurement is 1*(35 * 10) + 2 = 352
Note 1: data center is a dependent tag since each host can only reside in 1 data center therefore adding data center as a tag does not increase cardinality
Note 2: all hosts probably don’t support all 10 apps. Therefore, “real” cardinality is likely less than 353.
Configuration
© 2017 InfluxData. All rights reserved.19
TSI - How does it help
• Memory use:
• TSI-->30M series = 1-2GB
• In-mem-->30M series = inconceivable
• Startup performance. Startup time should be insignificant, even
for very large indexes.
• The tsi1 index has its own index, while the inmem index is
shared across all shards.
• Write performance--tsi1 index will only need to consult index files
relevant to the hot data.
© 2017 InfluxData. All rights reserved.20
Tuning Parameters
• Max-concurrent-queries
• Max-select-point
• Max-select-series
• Max-select-buckets
• Rate limiting compactions
• Max-concurrent-compactions
• Compact-full-write-cold-duration
• Compact-throughput (new in v1.7!)
• Compact-throughput-burst (new in v1.7!)
© 2017 InfluxData. All rights reserved.21
Tuning Parameters
• Cache-max-memory-size
• Cache-snapshot-memory-size
• Cache-snapshot-write-cold-duration
• Max-series-per-database
• Max-values-per-tag
• Fine Grained Auth instead of multiple databases
Queries
© 2017 InfluxData. All rights reserved.23 © 2017 InfluxData. All rights reserved.23
Queries and Shards
• Shard durations should be longer than your longest typical
query
• When thinking about balancing writes/reads:
High Query load Low Query Load
High Write Load Balanced duration Shorter duration
Bursty or Low Write Load Longer duration Balanced duration
© 2017 InfluxData. All rights reserved.24 © 2017 InfluxData. All rights reserved.24
Query Performance
• Streaming functions > batch functions
• Batch funcs
• percentile(), spread(), stddev(), median(), mode(), holt-winters
• Stream funcs
• mean(),bottom(),first(),last(),max(),top(),count(),etc.
• Distributed functions (clusters only) > local functions
• Distributed
• first(),last(),max(),min(),count(),mean(),sum()
• Local
• percentile(),derivative(),spread(),top(),bottom(),elapsed(),etc.
© 2017 InfluxData. All rights reserved.25 © 2017 InfluxData. All rights reserved.25
Query Performance
• Boundaries!
• Time-bounding and series-bounding with `WHERE` clause
• `SELECT *` generally not a best practice
• Agg functions instead of raw queries
• `SELECT mean(<field>)` > `SELECT <field>`
• Subqueries
• When appropriate, process data from an already processed subset of
data
• SELECT SUM("max") FROM (SELECT MAX("water_level") FROM "h2o_feet" WHERE time >
now() - 1d GROUP BY "location")
© 2018 InfluxData. All rights reserved.26
DON'T CREATE TOO MANY LOGICAL CONTAINERS
Or rather, don’t write to too many databases:
• Dozens of databases should be fine
• Hundreds might be okay
• Thousands probably aren't without careful design
Too many databases leads to more open files, more query
iterators in RAM, and more shards expiring. Expiring shards
have a non-trivial RAM and CPU cost to clean up the indices.
sam@influxdata.com @SDillard12

OPTIMIZING THE TICK STACK

  • 1.
    Sam Dillard, SolutionsArchitect Getting Started Series Optimizing your TICK Stack
  • 2.
    © 2017 InfluxData.All rights reserved.2 © 2017 InfluxData. All rights reserved.2 ✓ Optimizing • Hardware/Architecture • Schema • Configuration • Queries ✓ Q&A Agenda
  • 3.
  • 4.
    © 2017 InfluxData.All rights reserved.4 Resource Utilization • No Specific OS Tuning Required • OSS • 70% cpu utilization - need head room for • Peak periods • Compactions • Supporting node failure (clusters only) • Backfilling data • Enterprise (clustered) • 49% cpu on each node (ideal)
  • 5.
    © 2017 InfluxData.All rights reserved.5 © 2017 InfluxData. All rights reserved.5
  • 6.
    © 2017 InfluxData.All rights reserved.6 Telegraf • Lightweight and written in Go • Plug-in driven • Optimized for writing to InfluxDB • Formatting • Retries • Modifiable batch sizes and jitter • Tag sorting • Preprocessing • Converting tags to fields, fields to tags • Regex transformations • Renaming measurements, tags • Aggregate • Mean,min,max,count,variance,stddev • Histogram • ValueCounter (i.e., for HTTP response codes)
  • 7.
    © 2017 InfluxData.All rights reserved.7 Telegraf CPU Mem Disk Docker Kubernetes /metrics Kafka MySQL Process -transform -decorate -filter Aggregate -mean -min,max -count -variance -stddev File InfluxDB Kafka CloudWatch CloudWatch
  • 8.
    © 2017 InfluxData.All rights reserved.8 Telegraf InfluxDB Telegraf Telegraf Telegraf Telegraf Telegraf Telegraf Telegraf Telegraf Telegraf Telegraf Telegraf Telegraf Message Queue Telegraf
  • 9.
    © 2017 InfluxData.All rights reserved.9 Telegraf InfluxDB Telegraf Telegraf Telegraf Telegraf Telegraf Telegraf Telegraf Telegraf Telegraf Telegraf Telegraf Telegraf Telegraf Telegraf Telegraf
  • 10.
  • 11.
    © 2017 InfluxData.All rights reserved.11 Regard the Shard • Shards are defined by durations • Longer • Better frontend performance (writes & reads) • More efficient compactions • Shorter • More manageable • More efficient drops (happens everytime RPs are enforced) • More efficient for moving/copying • More efficient for recording incremental backups • Other North Stars: • Each shard group has at least 100,000 points per shard group • Each shard group has at least 1,000 points per series
  • 12.
    © 2018 InfluxData.All rights reserved.12 Schema Design Goals • By reducing... – Cardinality – Information-encoding – Key lengths • You increase… – Write performance – Query performance – Readability
  • 13.
    © 2018 InfluxData.All rights reserved.13 © 2017 InfluxData. All rights reserved.13 Data Format ● Points are written to InfluxDB using Line Protocol, which follows this below format: <measurement>,tag-key=tag-value field-key=field-value <timestamp> ● Punctuation is paramount! cpu_usage,host=server02,az=us-west-1b user=25.0,system=55.0 <timestamp> Measurement Tag set Field set Space Space
  • 14.
    © 2018 InfluxData.All rights reserved.14 © 2017 InfluxData. All rights reserved.14 Schema Insight ● A Measurement is a namespace for like metrics (SQL table) ● What to make a Measurement? ○ Logically-alike metrics ○ I.e., CPU has metrics has many metrics associated with it ○ I.e., Transactions ■ “usd”,”response_time”,”duration_ms”,”timeout”, whatever else… ● What to make a Tag? ○ Metadata that describe unique sources of metrics ○ Often this translates to “things you need to `GROUP BY`” ● What to make a Field? ○ Actual metrics ○ More specifically? ■ Things you need to do math on or other operations ■ Things that have high value variance...that you don’t need to group
  • 15.
    © 2018 InfluxData.All rights reserved.15 DON'T ENCODE DATA INTO THE MEASUREMENT NAME Measurement names like: Encode that information as tags: cpu.server-5.us-west value=2 1444234982000000000 cpu.server-6.us-west value=4 1444234982000000000 mem-free.server-6.us-west value=2500 1444234982000000000 cpu,host=server-5,region=us-west value=2 1444234982000000000 cpu,host=server-6,region=us-west value=4 1444234982000000000 mem-free,host=server-6,region=us-west value=2500 1444234982000000
  • 16.
    © 2018 InfluxData.All rights reserved.16 DON’T OVERLOAD TAGS BAD GOOD: Separate out into different tags: xxx cpu,server=localhost.us-west value=2 1444234982000000000 cpu,server=localhost.us-east value=3 1444234982000000000 cpu,host=localhost,region=us-west value=2 1444234982000000000 cpu,host=localhost,region=us-east value=3 1444234982000000000
  • 17.
    © 2018 InfluxData.All rights reserved.17 © 2018 InfluxData. All rights reserved.17 Cardinality • The number of unique database, measurement, tag set, and field key combinations in an InfluxDB instance. • In practice we generally just care about the tagset For example: Measurement: • http Tags: • host -- 35 possible hosts • appName -- 10 possible apps • datacenter -- 4 possible DCs Fields: • responseCode • responseTime Assuming each app can reside on each host, total possible series cardinality for this measurement is 1*(35 * 10) + 2 = 352 Note 1: data center is a dependent tag since each host can only reside in 1 data center therefore adding data center as a tag does not increase cardinality Note 2: all hosts probably don’t support all 10 apps. Therefore, “real” cardinality is likely less than 353.
  • 18.
  • 19.
    © 2017 InfluxData.All rights reserved.19 TSI - How does it help • Memory use: • TSI-->30M series = 1-2GB • In-mem-->30M series = inconceivable • Startup performance. Startup time should be insignificant, even for very large indexes. • The tsi1 index has its own index, while the inmem index is shared across all shards. • Write performance--tsi1 index will only need to consult index files relevant to the hot data.
  • 20.
    © 2017 InfluxData.All rights reserved.20 Tuning Parameters • Max-concurrent-queries • Max-select-point • Max-select-series • Max-select-buckets • Rate limiting compactions • Max-concurrent-compactions • Compact-full-write-cold-duration • Compact-throughput (new in v1.7!) • Compact-throughput-burst (new in v1.7!)
  • 21.
    © 2017 InfluxData.All rights reserved.21 Tuning Parameters • Cache-max-memory-size • Cache-snapshot-memory-size • Cache-snapshot-write-cold-duration • Max-series-per-database • Max-values-per-tag • Fine Grained Auth instead of multiple databases
  • 22.
  • 23.
    © 2017 InfluxData.All rights reserved.23 © 2017 InfluxData. All rights reserved.23 Queries and Shards • Shard durations should be longer than your longest typical query • When thinking about balancing writes/reads: High Query load Low Query Load High Write Load Balanced duration Shorter duration Bursty or Low Write Load Longer duration Balanced duration
  • 24.
    © 2017 InfluxData.All rights reserved.24 © 2017 InfluxData. All rights reserved.24 Query Performance • Streaming functions > batch functions • Batch funcs • percentile(), spread(), stddev(), median(), mode(), holt-winters • Stream funcs • mean(),bottom(),first(),last(),max(),top(),count(),etc. • Distributed functions (clusters only) > local functions • Distributed • first(),last(),max(),min(),count(),mean(),sum() • Local • percentile(),derivative(),spread(),top(),bottom(),elapsed(),etc.
  • 25.
    © 2017 InfluxData.All rights reserved.25 © 2017 InfluxData. All rights reserved.25 Query Performance • Boundaries! • Time-bounding and series-bounding with `WHERE` clause • `SELECT *` generally not a best practice • Agg functions instead of raw queries • `SELECT mean(<field>)` > `SELECT <field>` • Subqueries • When appropriate, process data from an already processed subset of data • SELECT SUM("max") FROM (SELECT MAX("water_level") FROM "h2o_feet" WHERE time > now() - 1d GROUP BY "location")
  • 26.
    © 2018 InfluxData.All rights reserved.26 DON'T CREATE TOO MANY LOGICAL CONTAINERS Or rather, don’t write to too many databases: • Dozens of databases should be fine • Hundreds might be okay • Thousands probably aren't without careful design Too many databases leads to more open files, more query iterators in RAM, and more shards expiring. Expiring shards have a non-trivial RAM and CPU cost to clean up the indices.
  • 27.