Downloaded 12 times

![© 2018 InfluxData. All rights reserved.8
In today’s world: tcpdump
Documentation about the instruction set: https://www.kernel.org/doc/Documentation/networking/filter.txt
# tcpdump -d 'ip and tcp port 80'
(000) ldh [12]
(001) jeq #0x800 jt 2 jf 12
(002) ldb [23]
(003) jeq #0x6 jt 4 jf 12
(004) ldh [20]
(005) jset #0x1fff jt 12 jf 6
(006) ldxb 4*([14]&0xf)
(007) ldh [x + 14]
(008) jeq #0x50 jt 11 jf 9
(009) ldh [x + 16]
(010) jeq #0x50 jt 11 jf 12
(011) ret #262144
(012) ret #0
-d stands for: Dump the compiled packet-matching code in a human readable form to standard output and stop.
Is src (x+14) on port 80 (0x50)?
Is src (x+16) on port 80 (0x50)?
Is it an ethernet IP IPv4 packet?](https://image.slidesharecdn.com/distributedperformanceanalysisusinginfluxdbandthelinuxebpfvirtualmachine-181122135831/75/DISTRIBUTED-PERFORMANCE-ANALYSIS-USING-INFLUXDB-AND-THE-LINUX-EBPF-VIRTUAL-MACHINE-8-2048.jpg)
![In today’s world: seccomp
gcc -lseccomp seccomp-test.c
./a.out
hey there!
something's gonna happen!!
[1] 19463 killed ./a.out](https://image.slidesharecdn.com/distributedperformanceanalysisusinginfluxdbandthelinuxebpfvirtualmachine-181122135831/75/DISTRIBUTED-PERFORMANCE-ANALYSIS-USING-INFLUXDB-AND-THE-LINUX-EBPF-VIRTUAL-MACHINE-9-2048.jpg)
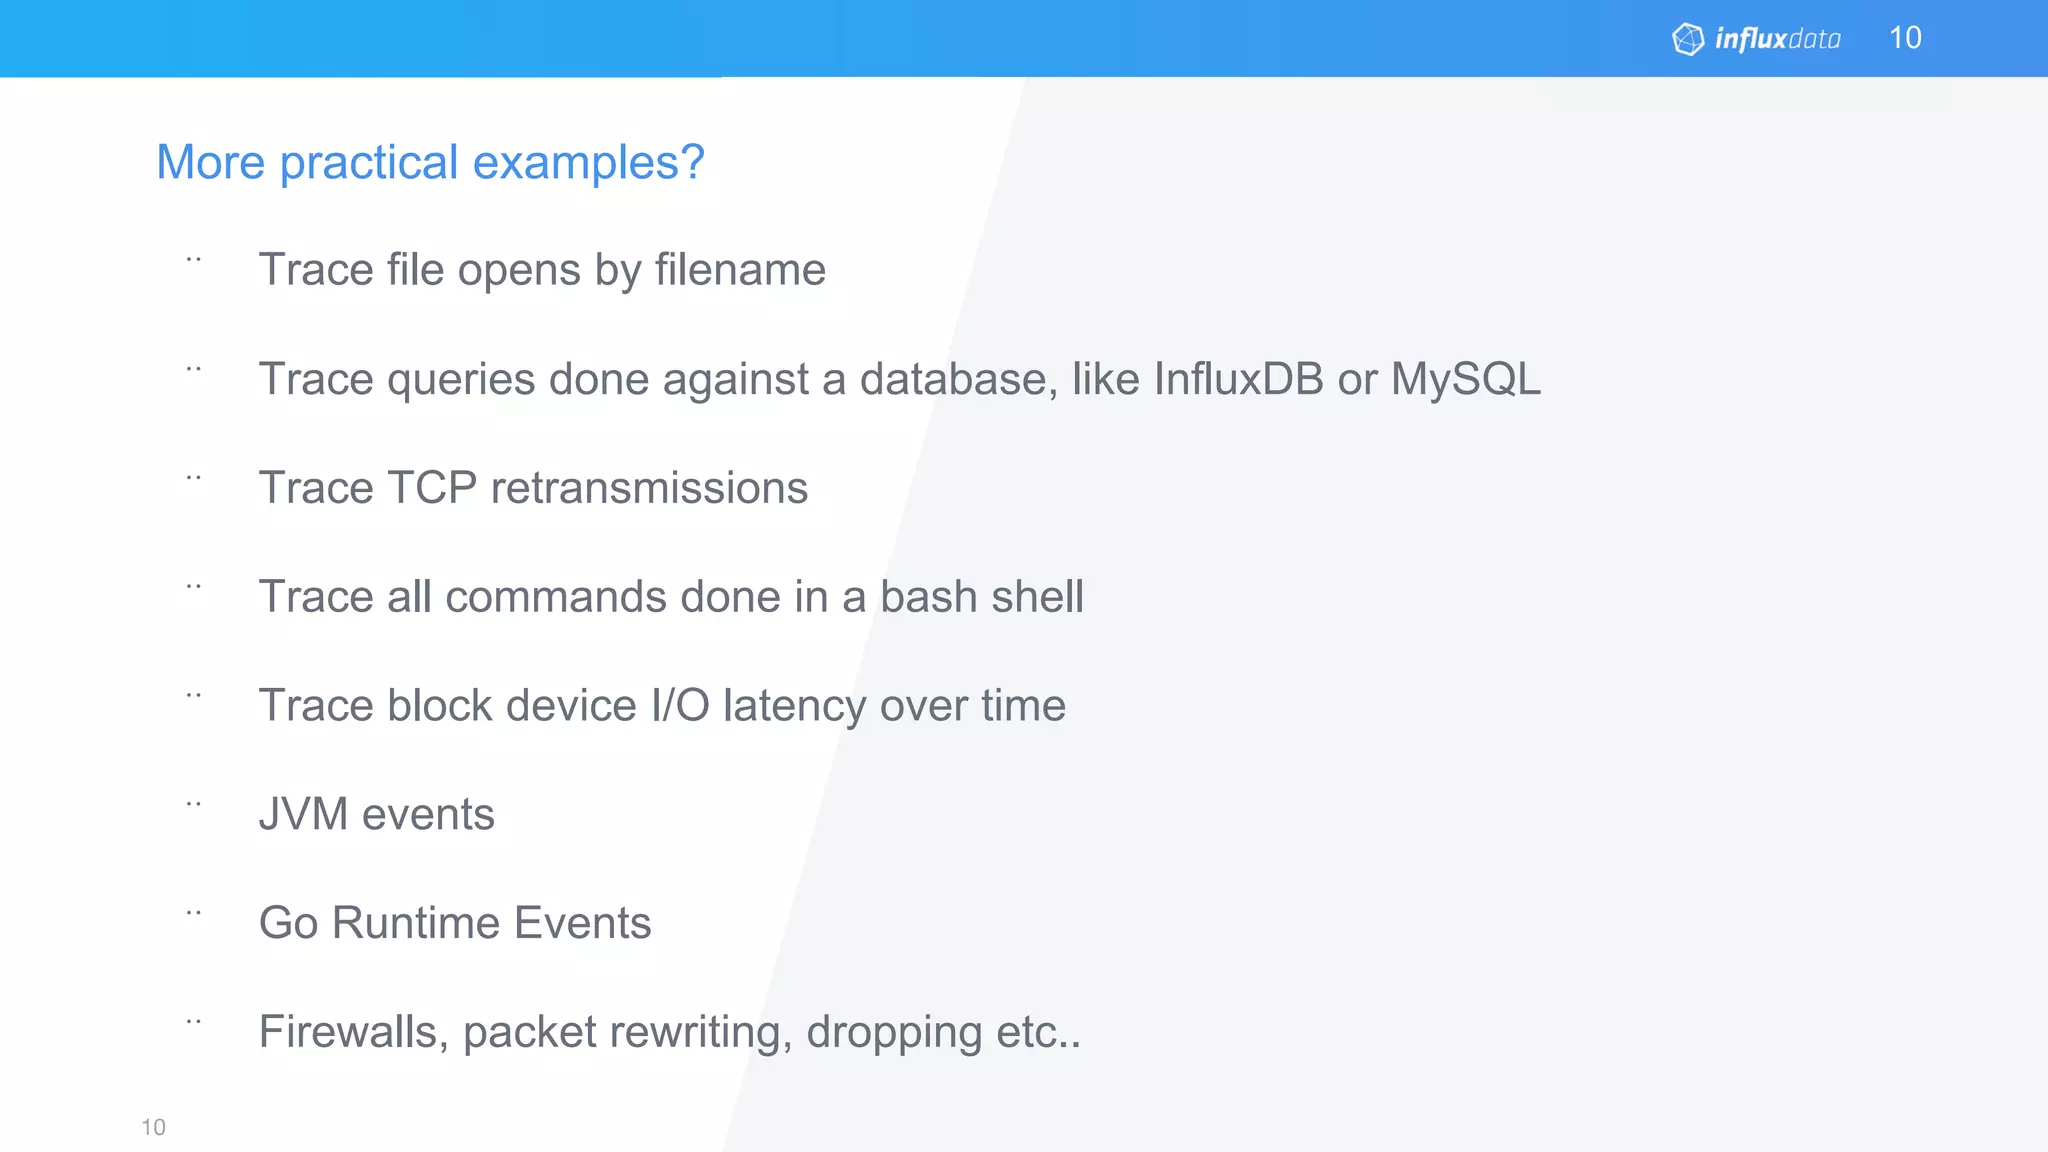
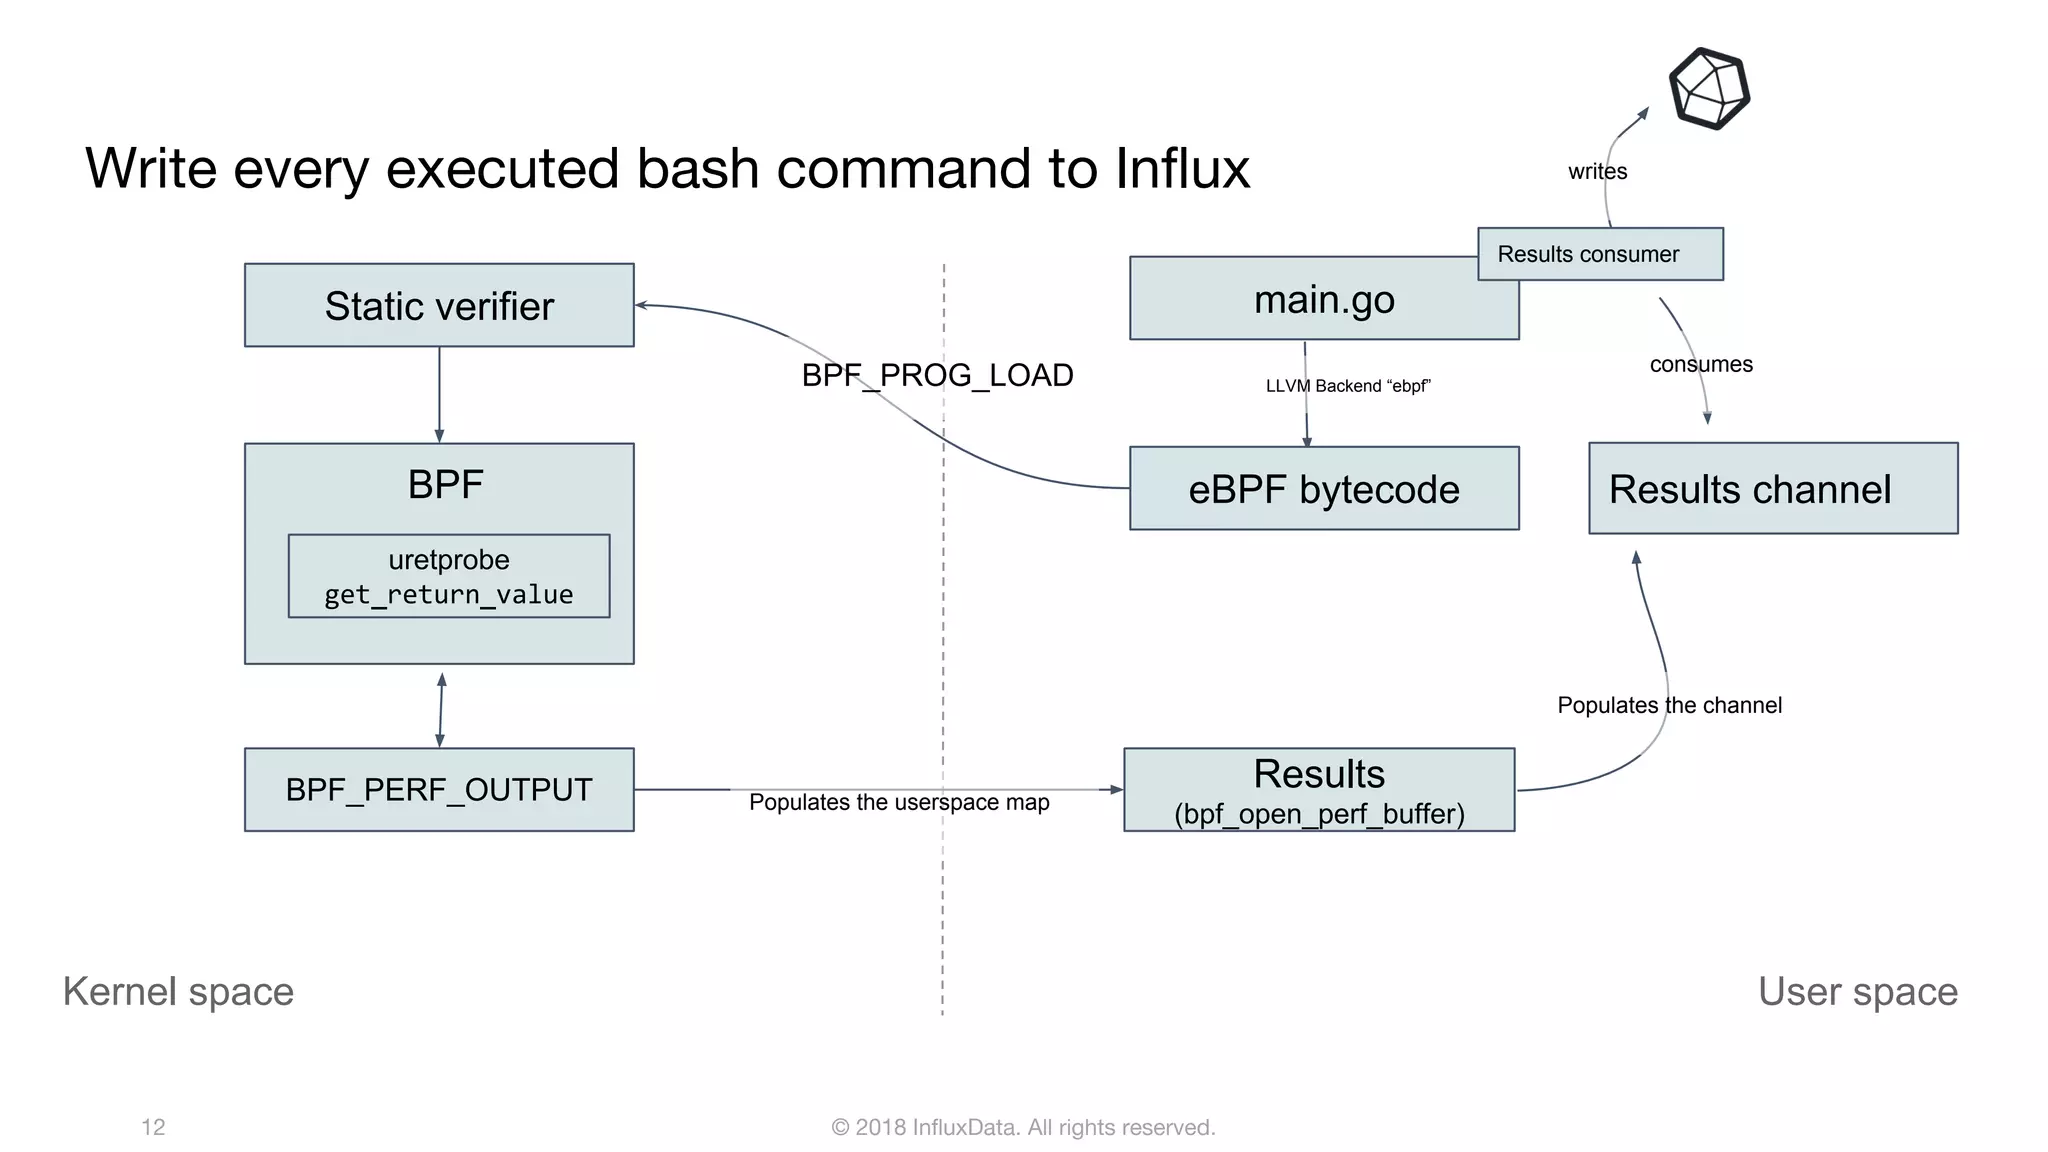
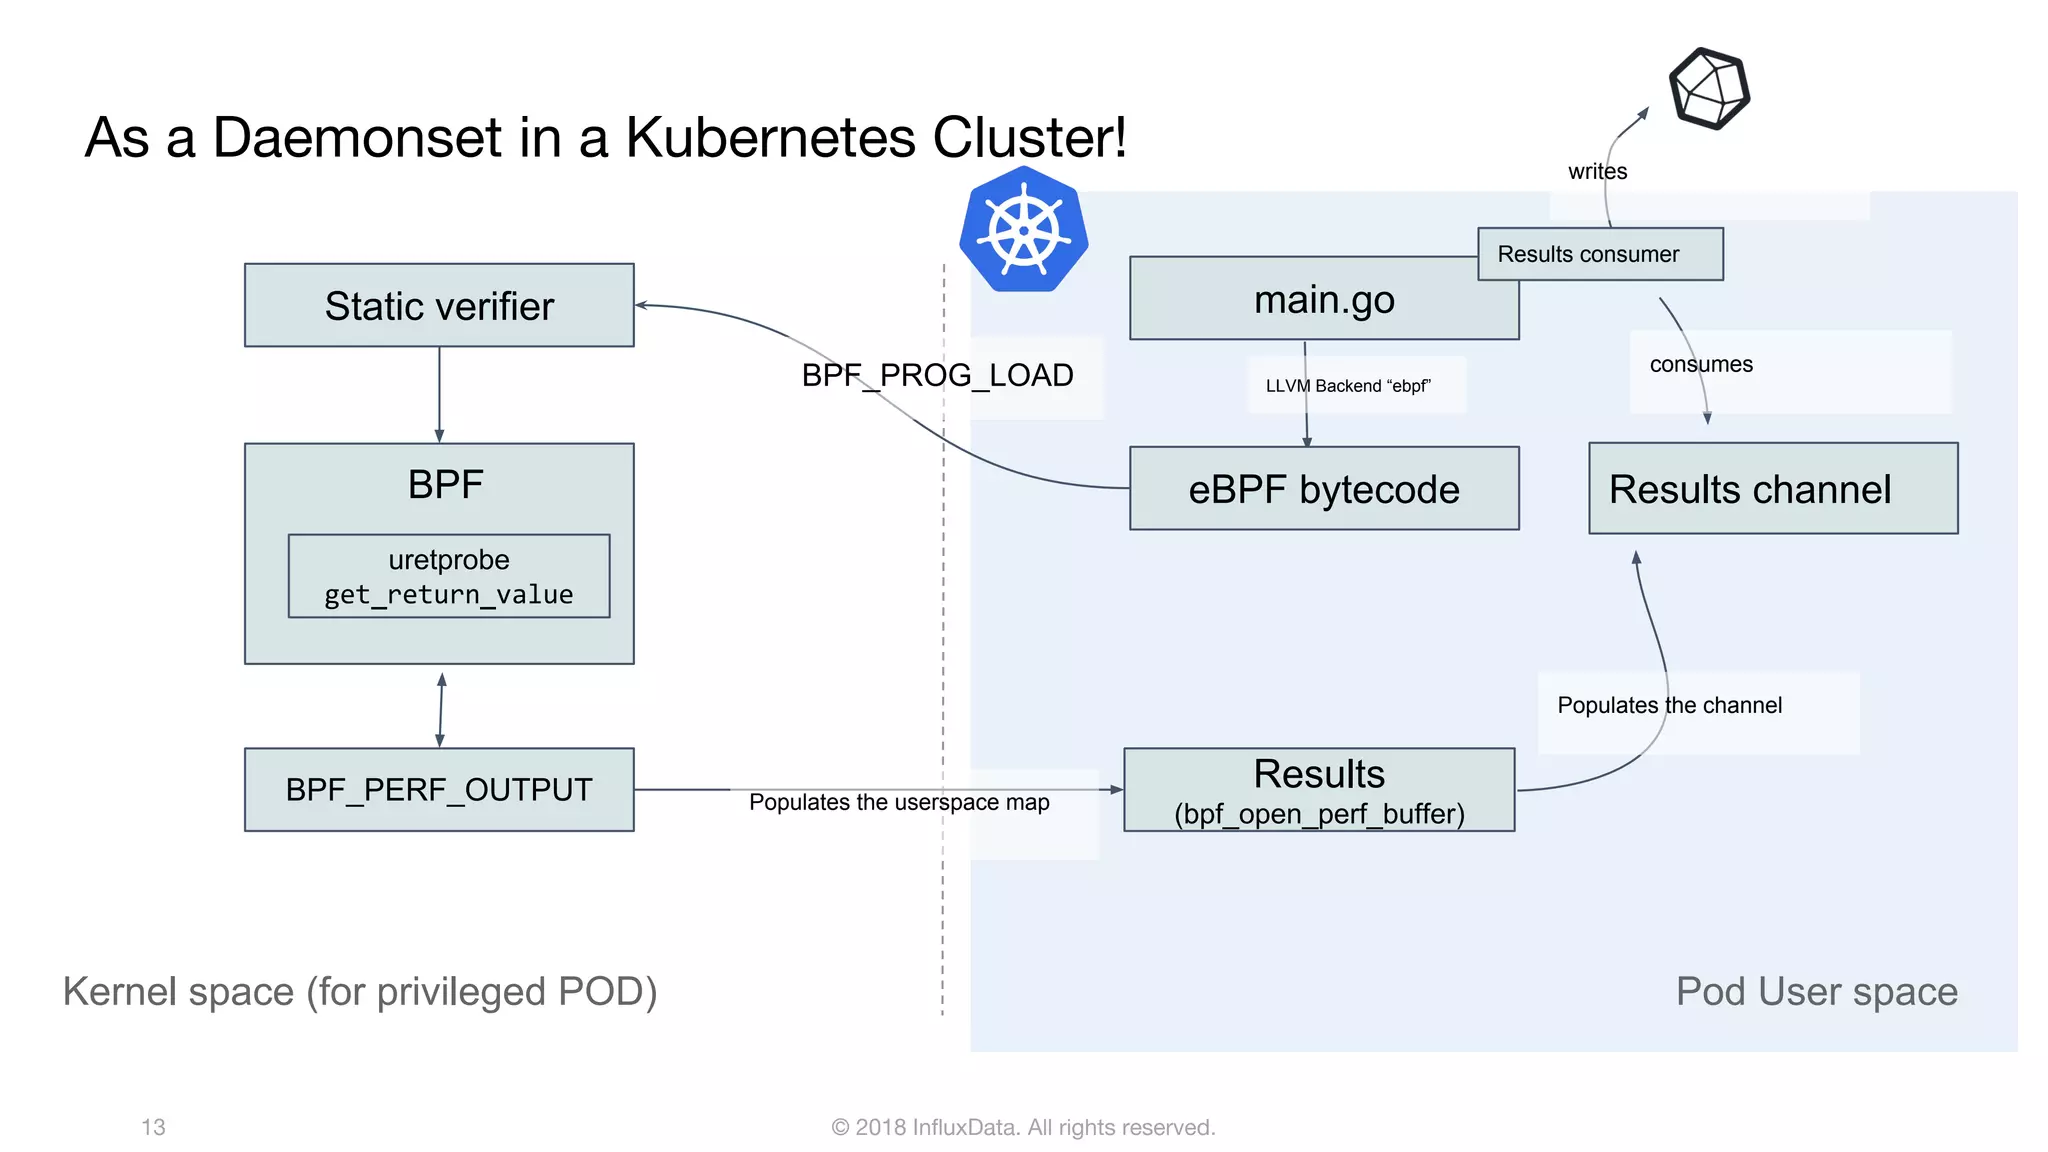
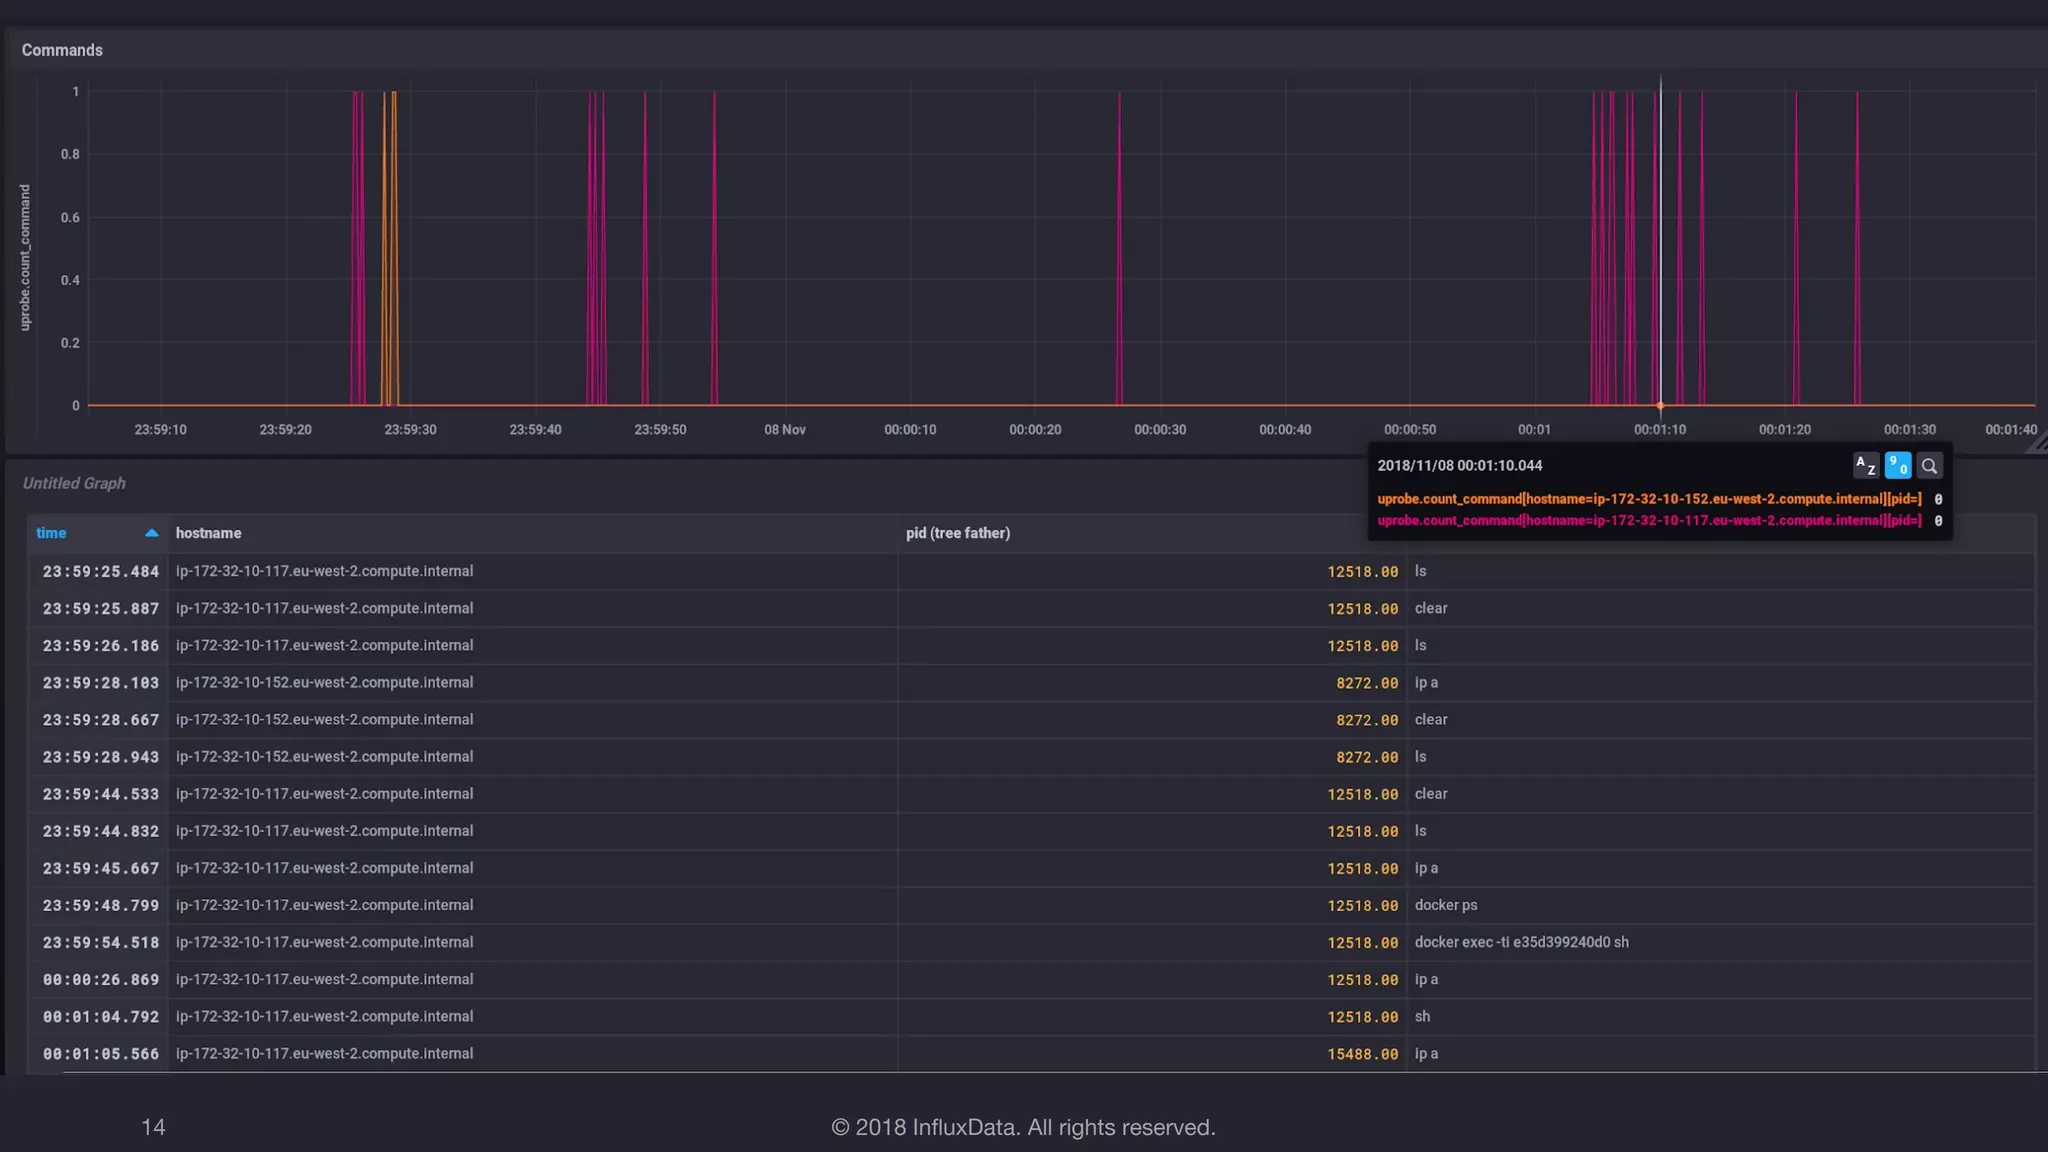
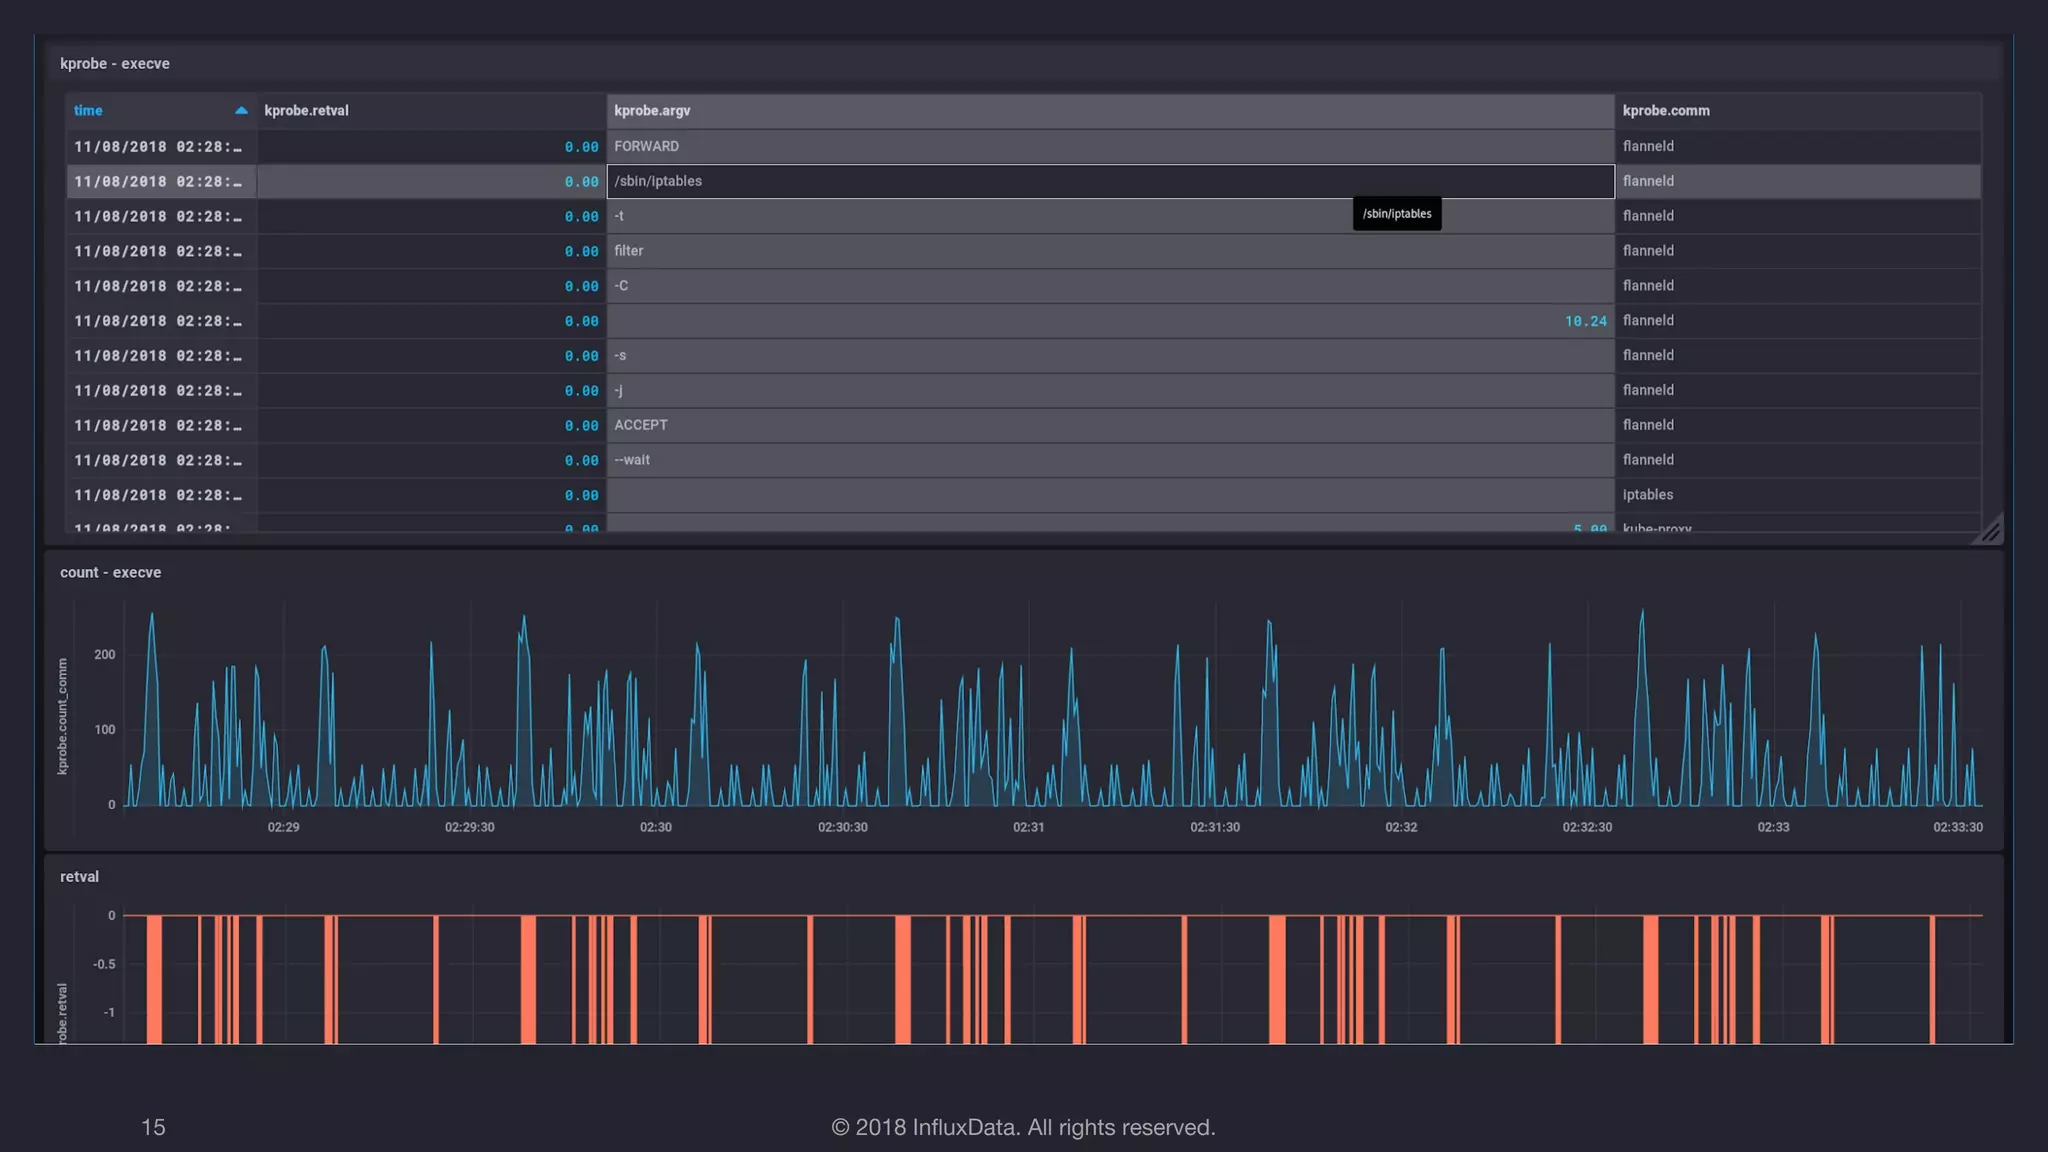


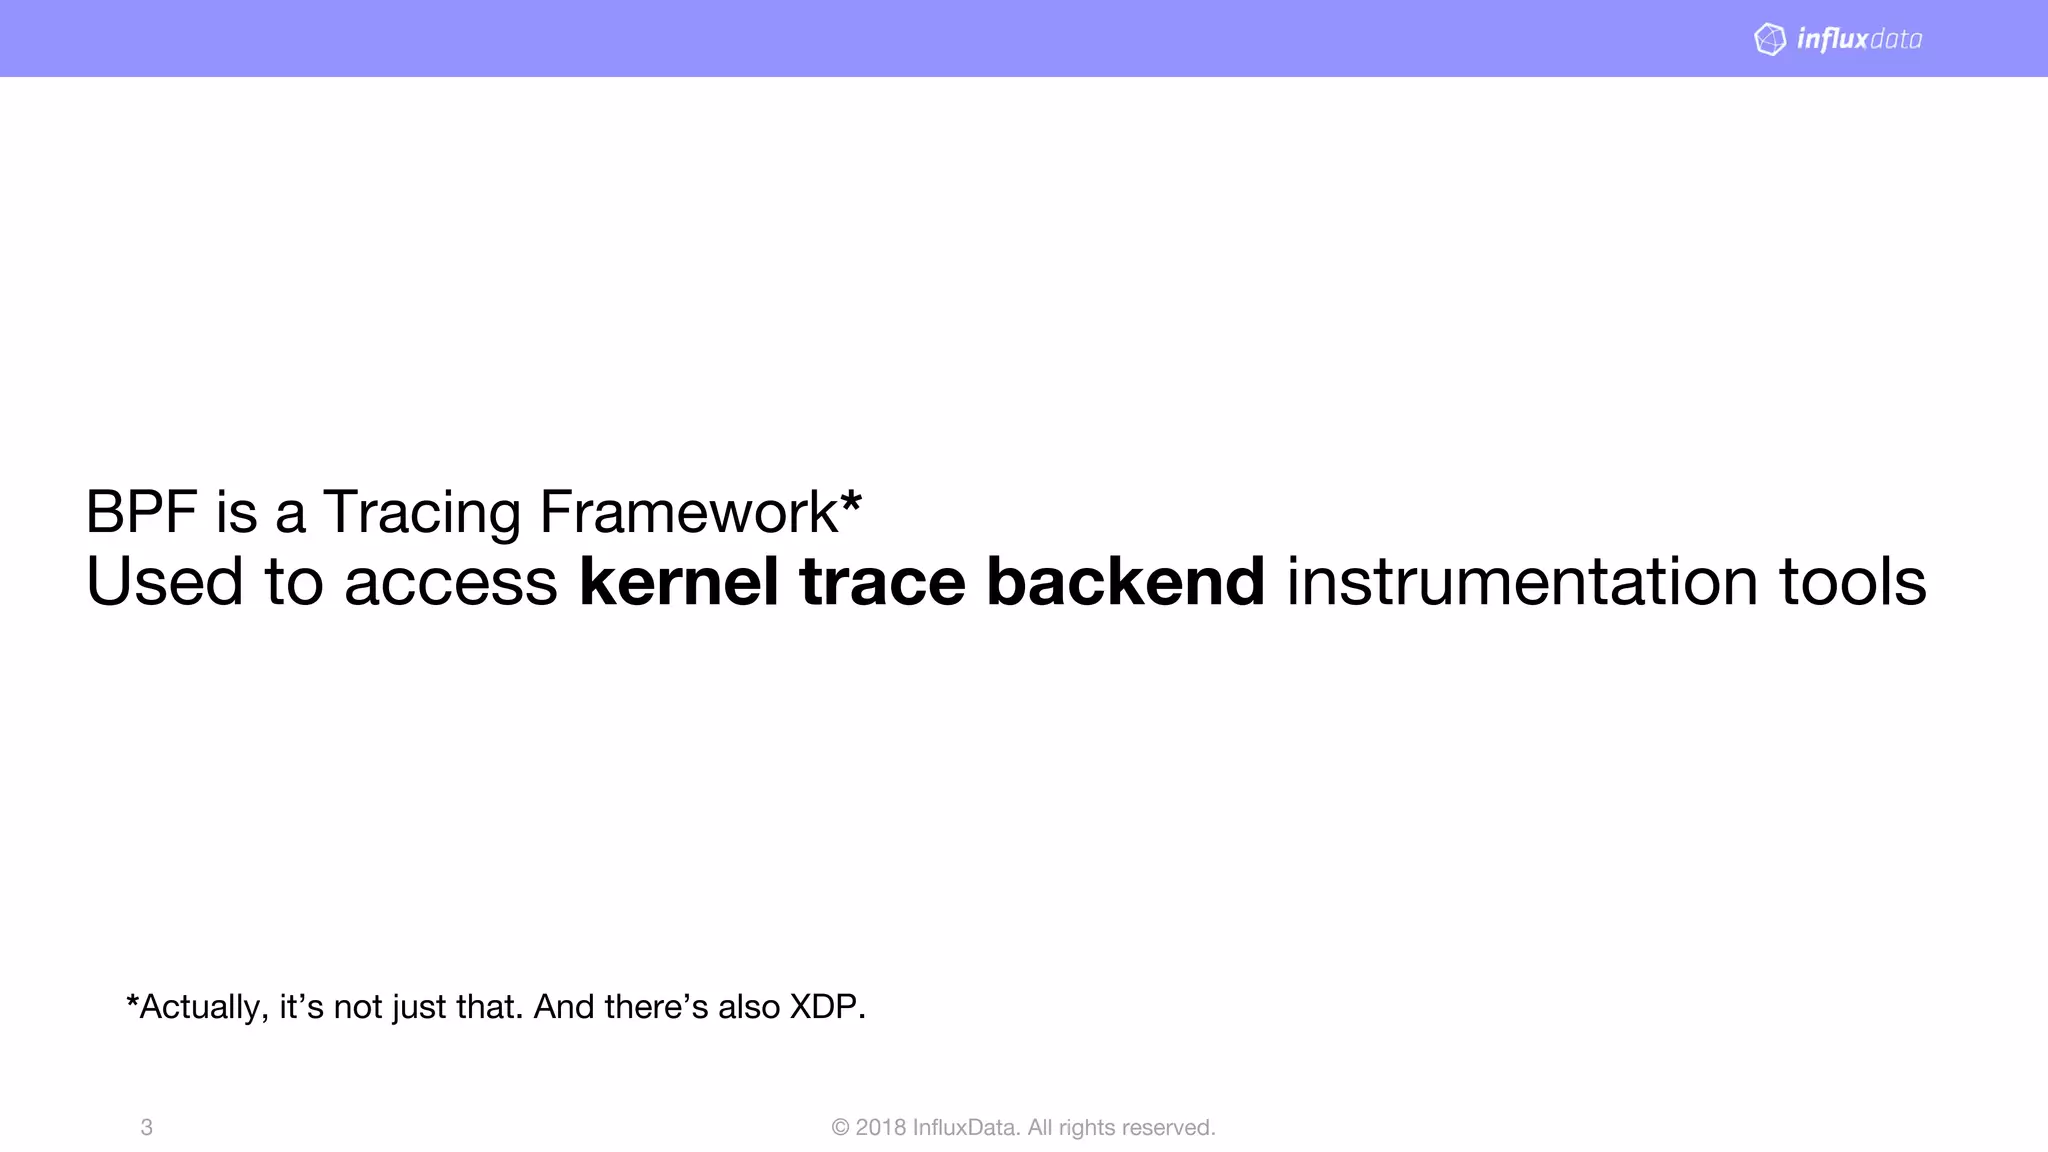
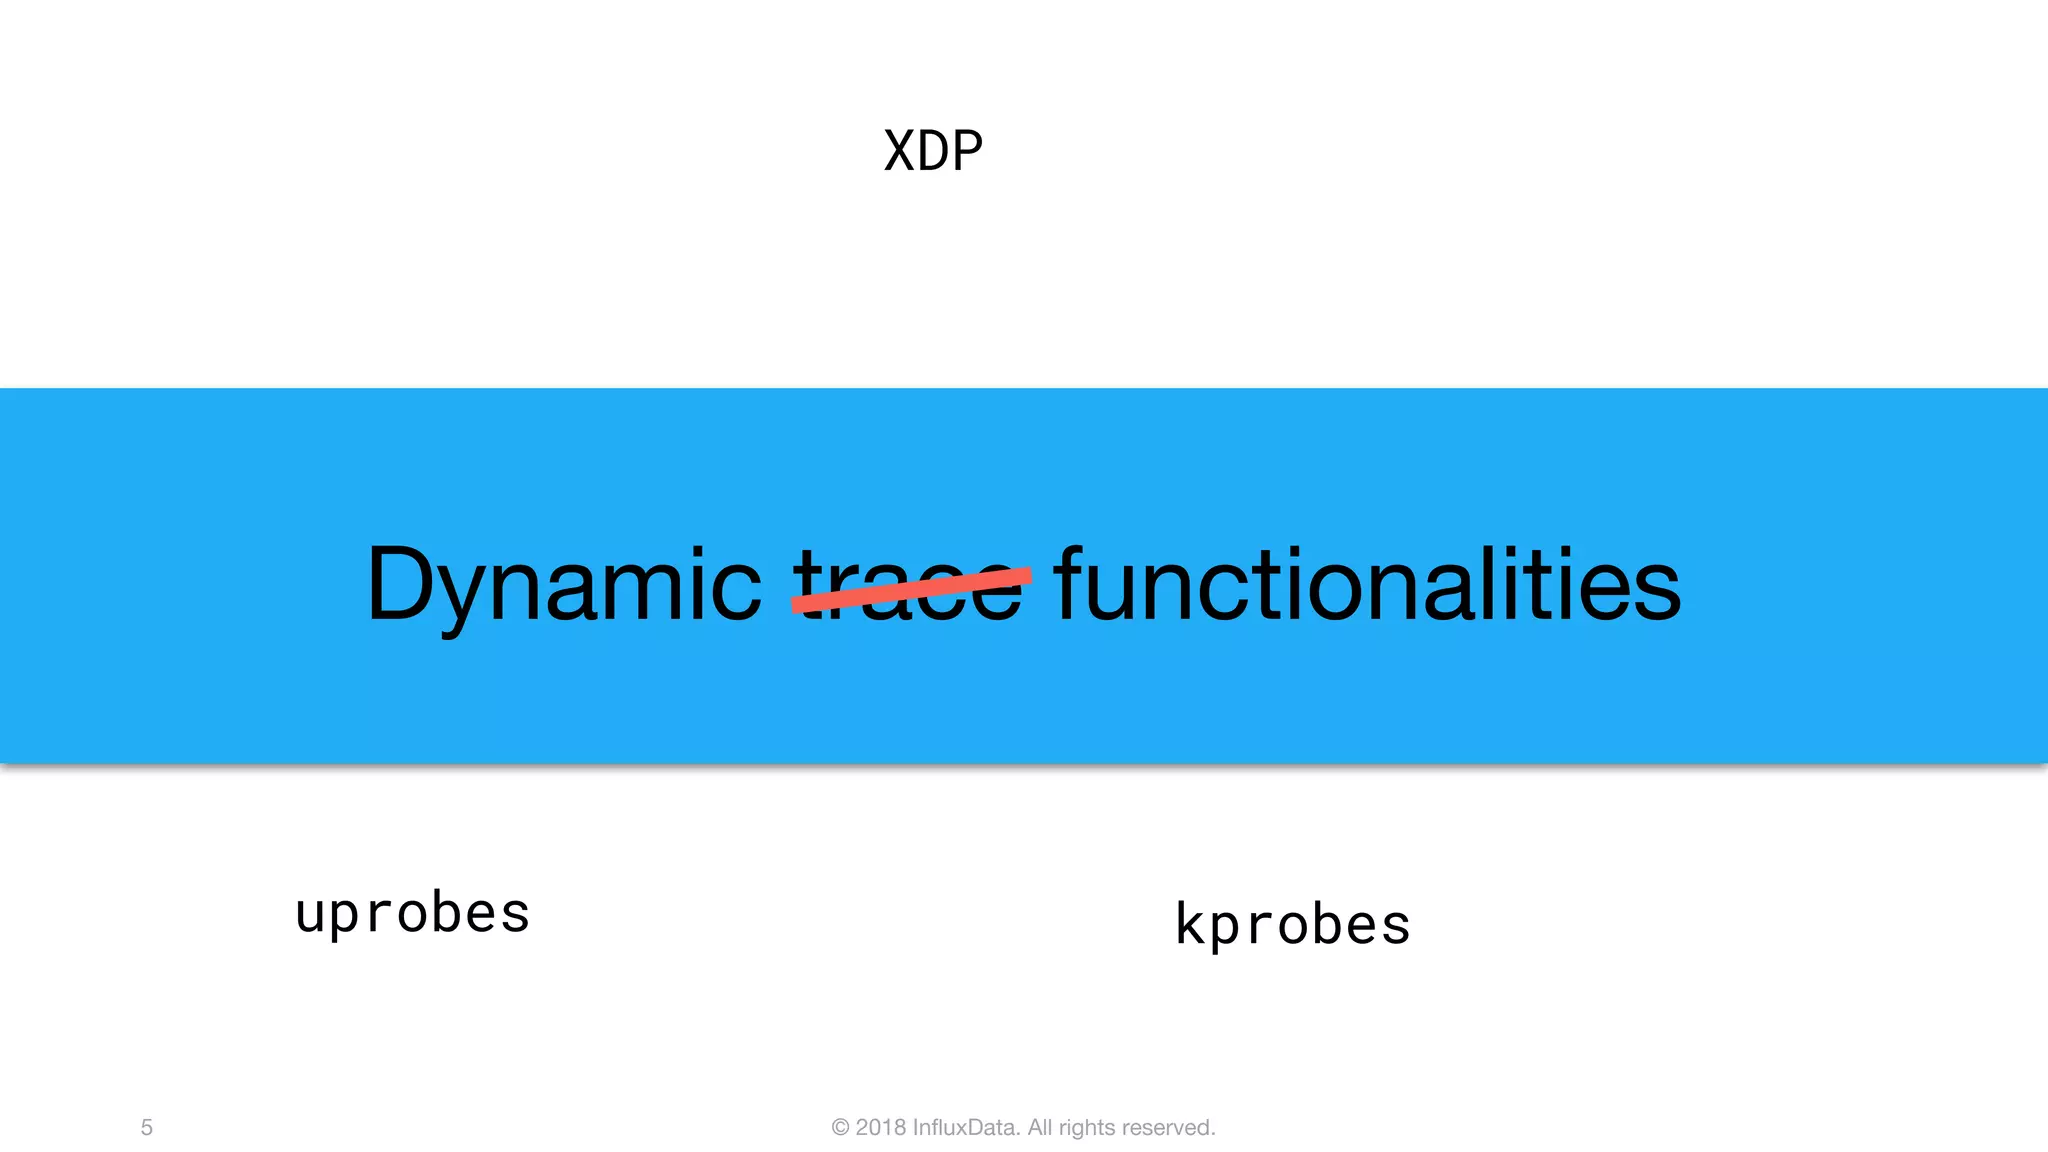
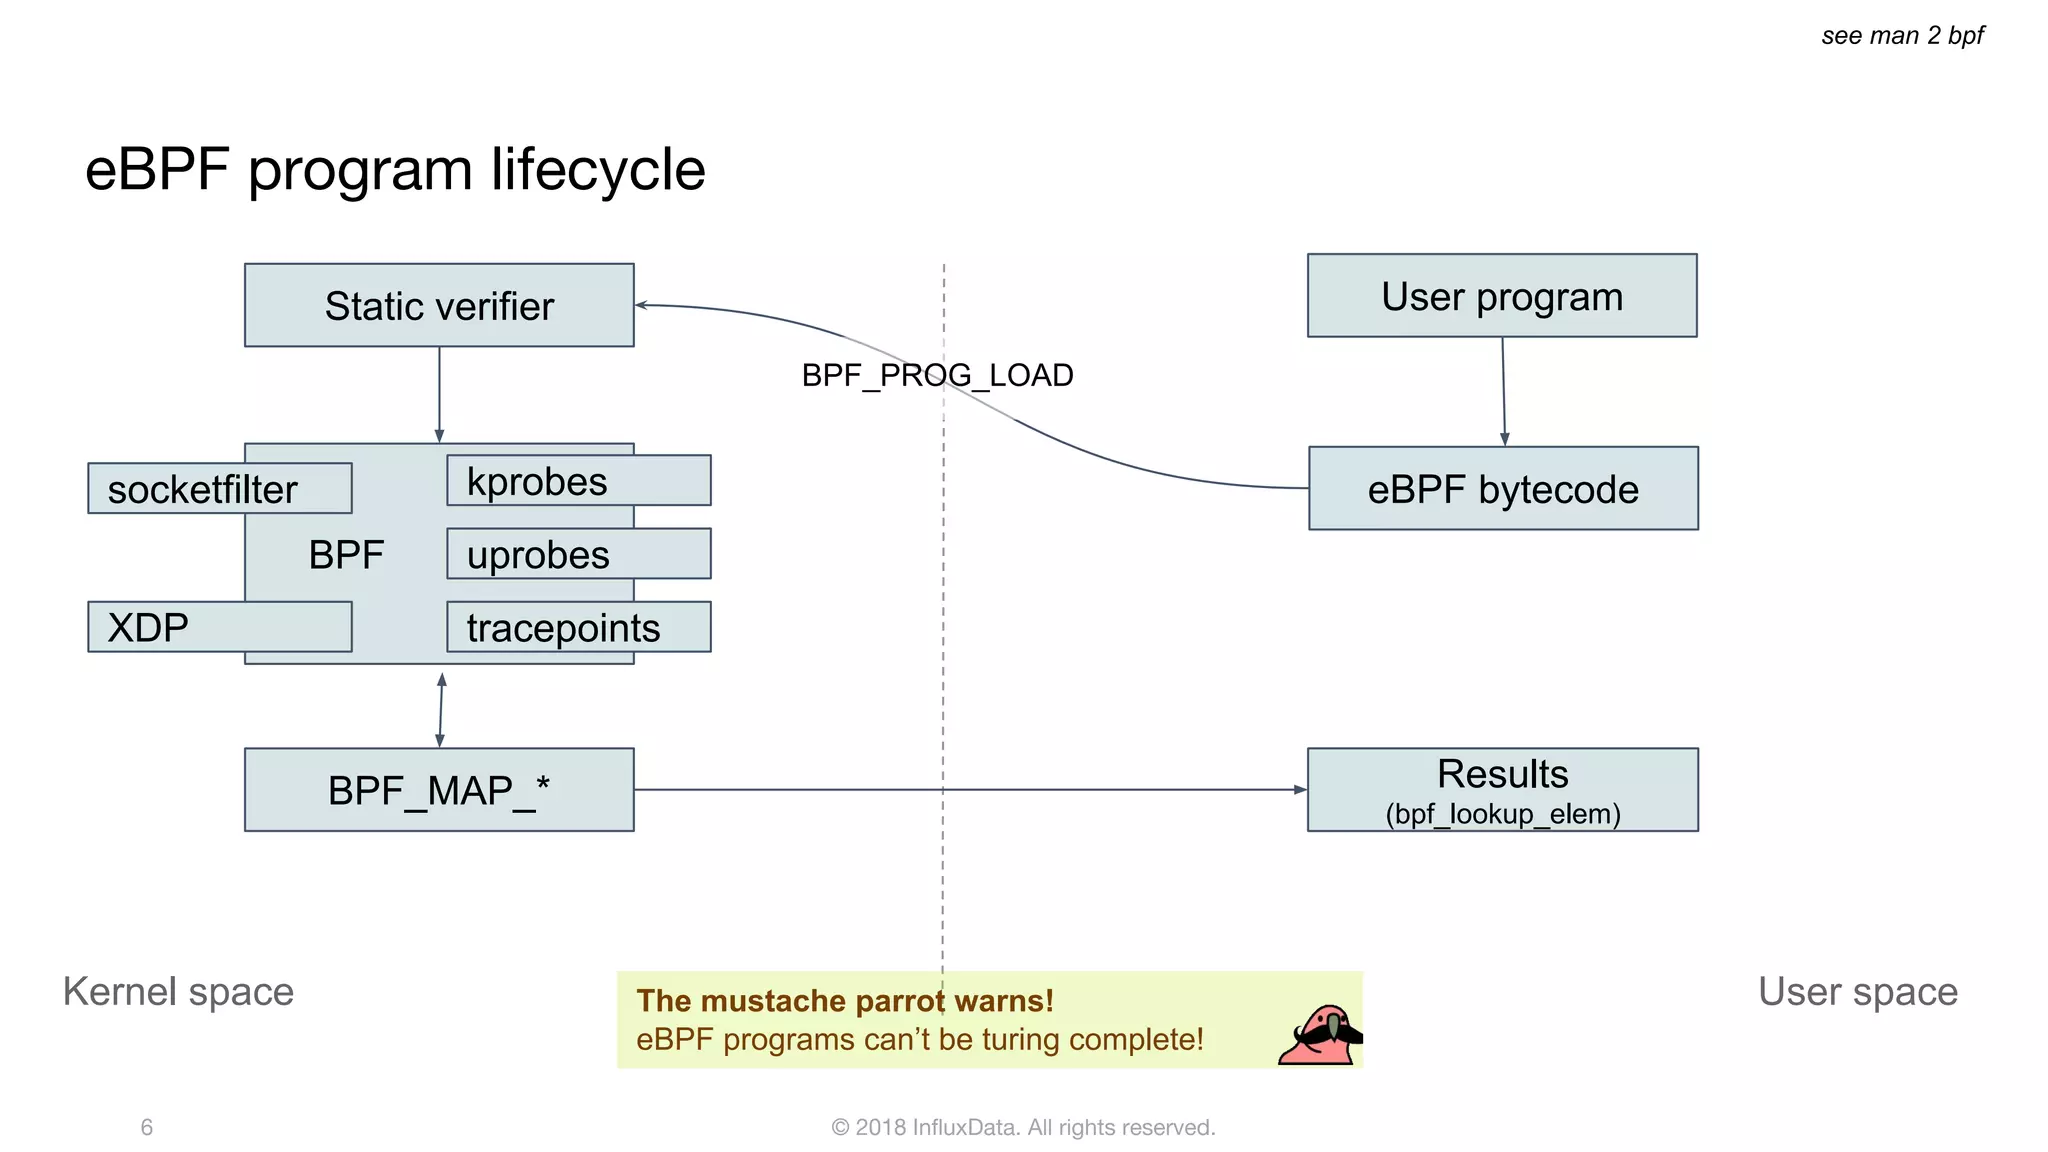
The document discusses the use of eBPF (extended Berkeley Packet Filter) for distributed performance analysis, detailing its functionalities, processes, and various applications. eBPF serves as a tracing framework that enables dynamic instrumentation of the Linux kernel to monitor events and trace behavior without requiring extensive modifications to the kernel itself. It also highlights practical examples of using eBPF to trace database queries, network activity, and device I/O latency, among others.


![Ward Bowman [PTC] | ThingWorx Long-Term Data Storage with InfluxDB | InfluxDa...](https://cdn.slidesharecdn.com/ss_thumbnails/influxdays-221027185325-5d2f430b-thumbnail.jpg?width=640&height=640&fit=bounds)
![Scott Anderson [InfluxData] | New & Upcoming Flux Features | InfluxDays 2022](https://cdn.slidesharecdn.com/ss_thumbnails/influxdays2022-fluxupdates-scott-221021210238-9d323cba-thumbnail.jpg?width=640&height=640&fit=bounds)
![Steinkamp, Clifford [InfluxData] | Closing Thoughts | InfluxDays 2022](https://cdn.slidesharecdn.com/ss_thumbnails/influxdays2022closingthoughtsday2-221020220104-abde55ea-thumbnail.jpg?width=640&height=640&fit=bounds)
![Steinkamp, Clifford [InfluxData] | Welcome to InfluxDays 2022 - Day 2 | Influ...](https://cdn.slidesharecdn.com/ss_thumbnails/influxdays2022welcometoday2-221020215815-c8463942-thumbnail.jpg?width=640&height=640&fit=bounds)
![Steinkamp, Clifford [InfluxData] | Closing Thoughts Day 1 | InfluxDays 2022](https://cdn.slidesharecdn.com/ss_thumbnails/influxdays2022closingthoughtsday1-221020215301-f8040e1f-thumbnail.jpg?width=640&height=640&fit=bounds)


