Download to read offline

![© 2017 InfluxData. All rights reserved.21
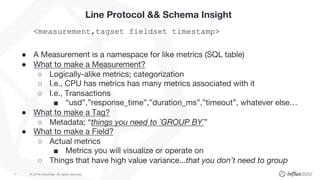
Use Telegraf as a Graphite parser
Graphite like: cpu.usage.eu-west.idle.percentage 100
With a Telegraf configuration like:
Results in following transformation:
cpu_usage,region=eu-east idle_percentage=100
[[inputs.http_listener_v2]]
data_format = “graphite”
separator = "_"
templates = [
"measurement.measurement.region.field*"
]](https://image.slidesharecdn.com/influxdaysoptimizinginfluxdbperformance4-191016171446/85/Optimizing-Time-Series-Performance-in-the-Real-World-21-320.jpg)
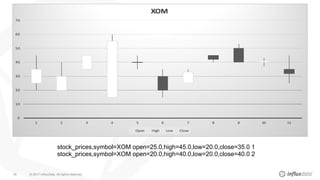
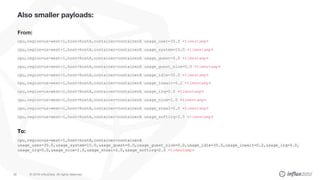


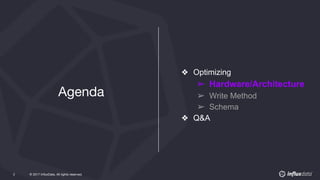
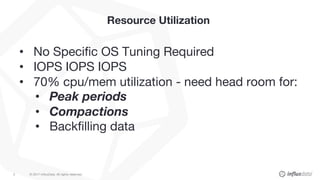
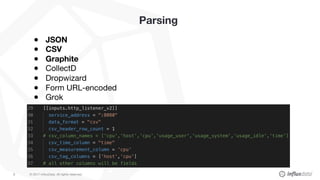
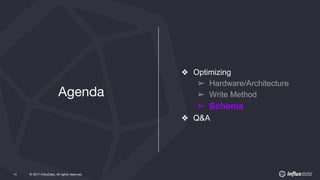
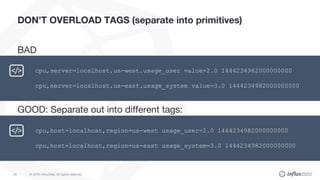
The document discusses optimizing InfluxDB performance, focusing on hardware architecture, write methods, and schema design. It emphasizes reducing measurement/tag cardinality and utilizing tools like Telegraf for data ingestion and transformation. Key recommendations include separating data into primitives, avoiding data encoding in measurement names, and properly structuring tags and fields for improved performance.


![Ryan Betts [InfluxData] | InfluxDB Platform Performance | InfluxDays Virtual ...](https://cdn.slidesharecdn.com/ss_thumbnails/influxdaysna-ryan-201110022532-thumbnail.jpg?width=640&height=640&fit=bounds)


![Sam Dillard [InfluxData] | Performance Optimization in InfluxDB | InfluxDays...](https://cdn.slidesharecdn.com/ss_thumbnails/influxdaysoptimizinginfluxdbperformancegreentheme-200622220133-thumbnail.jpg?width=640&height=640&fit=bounds)


![Jess Ingrassellino [InfluxData] | How to Get Data Into InfluxDB | InfluxDays ...](https://cdn.slidesharecdn.com/ss_thumbnails/jessingrassellinoslides-210511200652-thumbnail.jpg?width=640&height=640&fit=bounds)


![Ryan Betts [InfluxData] | Influxdays Keynote: Engineering Update | InfluxDays...](https://cdn.slidesharecdn.com/ss_thumbnails/ryan-influxdays-na-2021-211026005555-thumbnail.jpg?width=640&height=640&fit=bounds)