
![Table Requirement Analysis Hourly Sales Earning Capability at High Volume periods [1] Base-line per half hr Cust Arrivals per half hr Base-line hrs Ticket Value/ Customer $ Ticket Value/ Customer $ pm 22.00 18.00 6:00 85 6:30 65 150 3,300 2,700 7:00 77 7:30 57 134 2,948 2,412 [1] based on recommended table requirements](https://image.slidesharecdn.com/alkdpresentation-090731034927-phpapp02/85/Restaurant-Prototype-Study-Presentation-26-320.jpg)
![Thank You! LANDMARK/res 2140 W. Greenway Rd., Suite 100 Phoenix, Arizona 85023 (602) 741-9089 or (602) 443-0344 www.landmarkphx.com [email_address] Food & Beverage Systems Design & Engineering](https://image.slidesharecdn.com/alkdpresentation-090731034927-phpapp02/85/Restaurant-Prototype-Study-Presentation-41-320.jpg)

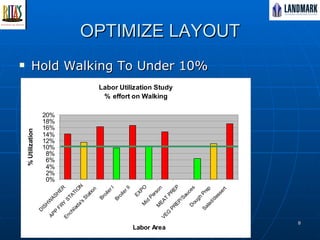
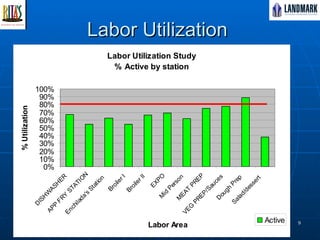
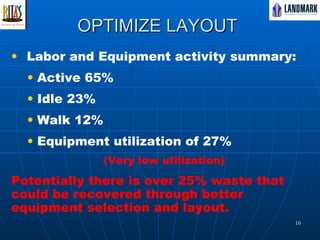
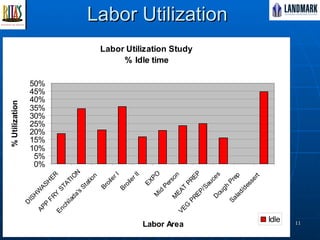
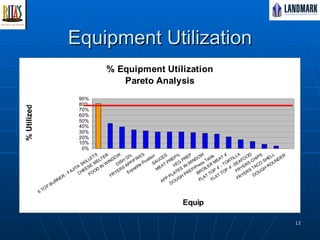
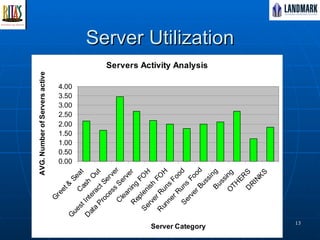
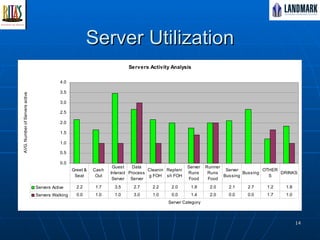
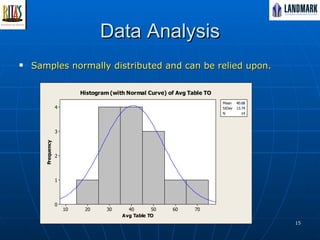
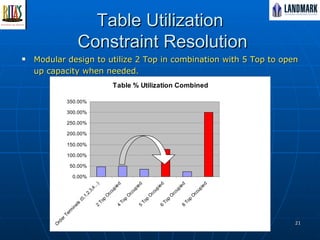
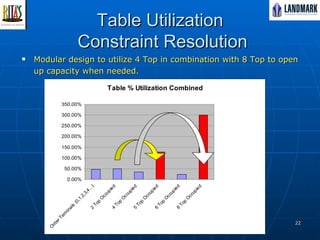
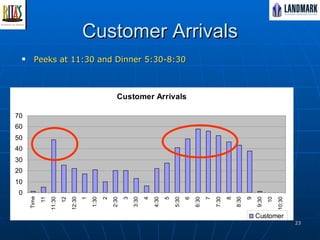
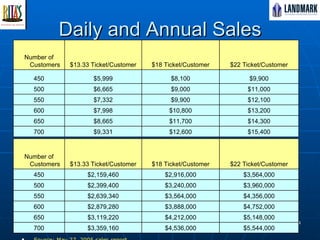
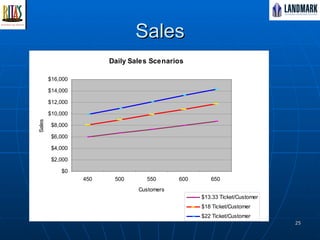
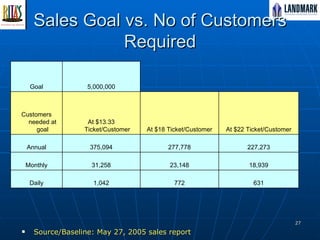
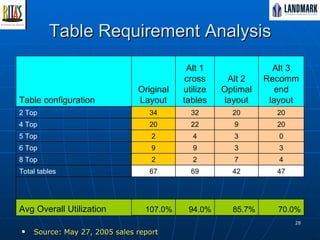
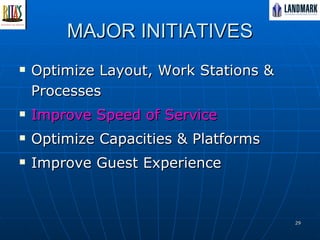
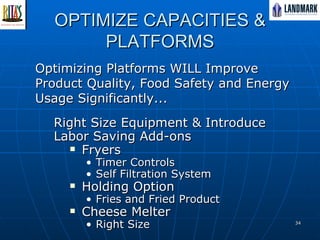
The presentation outlines the engineering status of a restaurant prototype for Rita's on the River, focusing on opportunities to optimize layout, improve speed of service, and enhance the guest experience. Key recommendations include optimizing workstations, increasing table turn rates, and evaluating equipment utilization to recover waste. The document also details projected sales targets, customer counts, and design considerations for achieving operational efficiency.


