
More Related Content
Similar to Operating System One Pager for quality.pdf
Similar to Operating System One Pager for quality.pdf (20)
Recently uploaded
Recently uploaded (20)
Operating System One Pager for quality.pdf
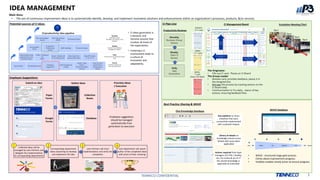
- 1. 1 TENNECO CONFIDENTIAL Monthly Business Group Review Weekly Plant CI Review Daily Idea Generation IDEA MANAGEMENT Main Aims: • The aim of continuous improvement ideas is to systematically identify, develop, and implement innovative solutions and enhancements within an organization's processes, products, &/or services. Potential sources of CI ideas. CI Pipe Line CI/productivity Idea pipeline Quick Kaizen Standardized work Employee suggestions Shift handover & huddle Andon “Help Chain”/ Practical Problem Solving Hour by hour performance management boards Improvement ideas supported by cross functional team 5 Why / Fishbone / A3 RCPS Kaizen / Model cell or line deployment Daily shop floor review/observation Daily KPI trends S / Q / D / P Consumption Tower CI pipeline / Productivity reviews Staff meetings Financial reviews P&L and budgets results Plant Ops reviews (MOR) Scorecard reviews Hourly Production operators & team lead / group lead Daily Production & cross functional support team Weekly Functional Team Members Management Support Monthly Operations review BU leaders, Ops directors, plant managers • CI ideas generation is a dynamic and iterative process that involves all levels of the organization • Fostering a CI environment leads to a culture of innovation and adaptability. Employee Suggestions: Submit an idea Paper Forms Google Forms Gather ideas Collection Boxes Database Prioritize Ideas / Execution Employee suggestions should be managed systematically from generation to execution Collected ideas will be managed by Lean Partners and delegate the implementation to corresponding departments Corresponding department takes ownership to develop and implement the idea Lean Partners will track implementation and verify the completion Lean department will award author of the completed ideas with prizes of their choosing 1 2 3 4 Department Owners responsible for the implementation Color-coded cards are referenced for Safety or CI ideas or issues SQDCP Classification of idea/issue Status idea/ issue The Originator: • Fills out CI card. Places on CI Board The Group Leader • Reviews card, provides feedback, places it in the Assigned slot. • Manage the process by tracking actions on the CI Board daily • Communication to TLs daily… status of key actions, ensuring feedback flow. General CI T-card Safety CI T-card Safety T-card (Stop-Call-Wait) Productivity Reviews CI Management Board Escalation Meeting (Tier) • WAVE - structured stage gate process. • Clarity about improvement progress. • Visibility enables timely action to ensure progress. Best Practice Sharing & WAVE One platform to share initiatives that were successfully implemented with sustained impacts Library of details on knowledge shared across (linked with asset when applicable) Actions required from topic managers (CI/ EHS / Quality, etc.) to review & act on if the shared knowledge is applicable & actionable One Knowledge Database WAVE Database Ideas Realized Track Implement Plan Validate L0 L1 L2 L3 L4 L5
- 2. 2 TENNECO CONFIDENTIAL IDM CONSUMPTION MANAGEMENT & REDUCTION Main Aims: • Optimize the spend on indirect materials to ensure continuity of the production process while minimizing the expense incurred Optimisation Tools Explanation: • 3 areas x 7 Tools used as strategies for optimisation of IDM spend Strategy Usage control for supplies Increase % of repair parts Optimize tool life Tool Reusability Spares Inventory Sell-Back of Obsolete Inventory VMI & Supplier Consolidation What is it? Cost Per Unit (CPU) reduction & usage control Standardize processes to enforce repair Consolidate repair suppliers and formalize agreements Consider in- house repair expertise for high frequency items Extend tool life by tracking tool CPU and 'bag & tag' process Replace single- use (cutting) tools with reusable, re- grindable, re- sizeable options Optimizing the min/max stocks levels. Keep, transfer, sell, scrap, run- down zero usage or excess inventory. Vendor Managed Inventory & Supplier Consolidation Reduce ✓ ✓ ✓ ✓ ✓ Re-use ✓ ✓ Repair ✓ ✓ ✓ ✓ ? Recycle ✓ Supplies and Maintenance Tooling Inventory Management Optimize repair suppliers Repair v Buy Usage Control Tool Reuse Optimize Life VMI & Supplier Consolidation Sell-back Obsolete Inventory Spares Inventory Data collections Track cost and CPU ▪ Connect purchase order to Work center. ▪ ‘What gets measured gets managed’! Data analysis ▪ Analyze consumption ▪ Use pareto!...focus on top 10 ▪ Launch kaizen activities on identified supplies / work center ▪ Monthly review and update with project owner ▪ Are improvement actions driving the cost? ▪ Are actions taken sustainable and sustained? Usage Control for Supplies Repair v Buy Increase % of Repair Parts Optimise Repair Suppliers • Including repair criteria/notion in parts issuance procedure • Establish a “typically able to be repaired” list of items • Establish standard repair protocols ▪ Consolidate the repair suppliers across sites and formalize agreements ▪ Consider setting up in-house repair expertise for high frequency items Optimise Tool Life Tool Life Attainment, extension and re-specification • Extend tool life (and machine parts) by tracking CPU, executing a bag and tag process, conducting root cause analysis to address root causes of premature tool breakage, and implementing initiatives to address the root causes Tool Reusability • Analysis on single-use cutting tools, single use dies and other toolings - that could be replaced with inserts or reused. Spares Inventory Stock Stock level divided by 2 Q2 Q3 Q4 5 parts Batch-size reduction = Lower Stock + Higher Flexibility Q1 Stock Q1 Q2 Q3 Q4 Stock level 10 parts Data Analysis • Regular review of usage • Optimizing the min/max based on usage • Ensure the right order frequency and right order size • Benefits • This will save the company money via a one-time inventory reduction • Ensures re-order levels are continuously optimized • Clear up critical inventory storage space Sell-back of Obsolete Inventory Outputs Inputs Derived factors ▪ Optimized max ▪ Optimized min ▪ Cycle stock ▪ Safety stock ▪ Demand variability ▪ 12mo demand ▪ Lead time ▪ Critical part (Y/N) • Reduce cash in excess inventory • Manage materials no longer active • Frees up space • Reduces the need to write-off • Deal with excess or obsolete inventory Idea database ▪ Create a master list of ideas that we can possibly deploy in other facilities Plant clusters ▪ Identify plants with similar processes and technologies – ‘clusters’ within each region ▪ Define applicability of ideas within those plants/clusters Read-across sessions ▪ Create a master list of ideas that have high feasibility of deploying in other facilities ▪ Rigorous tracking of performance to ensure deployment of read- across ideas Enablers – Sharing Best Practices
- 3. 3 TENNECO CONFIDENTIAL MATERIALS HANDLING MANAGEMENT Main Aims: • The aim of a materials handling system in an assembly plant is to efficiently and safely move materials, components, and products throughout the production process. This system plays a crucial role in streamlining operations and driving productivity. Benefits of Material Handling System Improved Efficiency: • Reduce manual labor and minimize time required to transport materials, Increase overall productivity and output while minimizing errors. • Reduce operational costs by optimizing the use of resources and minimizing waste. • Ensuring that materials are moved safely • Enhanced quality control by minimizing the risk of damage or contamination. • Maximize the utilization of available floor space. • Better inventory management by reducing the need for excess inventory and ensuring materials are readily available when needed. • Streamlined Workflow: Materials handling systems can be designed to support the flow of materials in a logical and efficient sequence, reducing bottlenecks and delays. Transportation Selection Production Materials warehouse Finish product warehouse Finished product Empties; returnable Raw materials/Semifinished products Leftovers Empties Flow of materials in plant Paint A Paint B Assembly 1 Assembly 2 Assembly 3 Assembly 4 Point-of-use delivery Milk run components Milk run Bars 1 2 3 4 Component's supermarket ▪ Milk run with pre-defined route (similar to bus ride) can provide cost-effective transit method for people to hop on/off throughout defined routes…Similar logic applies to material handling… • Transport of mix of products to multiple consumption cells in repetitive route/routes • Reduced workload on travels, reduced stock in production area • Fixed frequency of route, problematic in case of unplanned urgent plan changes “Milk run (bus-delivery) Heat treat Welding Adjustment Milling Turning Painting Shipping oo o o o oo o o o Optimised for Milk run Delivery • Make it simple, direct, compact: to reduce transportation & operator movement • Apply 1-piece flow if possible: to reduce WIP inventory & raise quality issues timely • Enable easy handling from ergonomics standpoint: to improve direct & indirect productivity Flow rack Machine Present parts as close as possible to the point of use Flow racks can also go over workstations and through machines Size parts containers for the convenience of the operator (often small and multiple of FG pack out) Often flow racks between equipment Front Loading Limit the storage capacity to 2 hours maximum (more frequent delivery) Boxes opened for operators Outflow of empties & FG Materials Presentation & Supply – General Rules • Material delivered as ‘ready-to-use’ for operators without handler entering the cell • For operators, container change should be a non- interrupting activity. Component/ container size Number of variants High Low Small Large Demand based delivery Delivered in the exact quantity and in sequence Demand based delivery Swap of empty containers (2-bin system) Dedicated slide/ corridor Line side small box on flow rack (designated location) Picked & kitted Prepared per batch production Characteristics 2 Kanban Super- market (small bags/boxes or big pallets) Super- market Feed full boxes Line runner Operator Material handler 1 Kanban Linefeed (small bags/boxes or big pallets) Feed full boxes Material handler Operator Pick to order (picking full bags/boxes, no kitting) Production Line 1 Line 2 Line 3 #1 #2 #3 MT Line runner Leftovers Full boxes 4 3 Kitting (picking exact number of parts needed for 1 product or 1 pro- duction order) Production Line 1 Line 2 Line 3 #1 #2 #3 Full boxes Line runner Remarks Used for replenishment of small boxes / large-load carriers 2-bin system possible High demand on road (evenness) Tugger/ trailer Used for replenishment of small boxes and large-load carriers 2-bin system possible High demand on road (width, corners) Order picker Limit the usage if possible Primarily used for large-load carriers and special carriers Low space requirements Forklift truck • Minimize internal transportation costs • Low operating costs (man, machine, ...) • High truck utilization • Low share of empty routes • Minimize plant traffic to improve workplace safety • Secure frequent replenishment of material at point-of-use avoiding delays • Adapt to building constraints, i.e. Width of roads, Corners Types of Supply Mode to Work Stations Decision Guidelines for Parts Presentation 8 Step – Design the Milk run Route Optimisation Guidelines for Cellular Manufacturing Cell / Plant Layout Master data collection Process flow and area mapping PFEP model preparation Workload evaluation Consumption patterns calculation Definition of supply modes for each part Design of storage locations, information flow & transportation equipment Evaluation of optimal routes type and frequency, resources planning Process step Current state analysis Future state design Preparation
- 4. 4 TENNECO CONFIDENTIAL OAE MEASUREMENT & MANAGEMENT Main Aims: • OAE (Overall Asset Effectiveness) measurement and management aims to improve the efficiency and performance of manufacturing processes and machinery. OAE Definition Data Collection Minimum Requirement: Summary View for Management Machine / Cell Specific Visualisation Visualizations Tracking & Escalation Improvement B C D E A F Shutdown losses Nonworking time (shutdown, holidays, Saturdays-Sundays,…) No scheduled production (running only 1 or 2 shifts per day, lack of customer demand,…) Planned downtime losses Breaks, shift change, shift kick-off meeting, cleaning, training, meetings, preventive maintenance, trials, prototypes,… Quality losses Scrap – rework – startup loss,… Operating time Net operating time Total time: 52 wks/yr 7 days/wk 24 hrs/day Total operations time Run time Valuable operating time Important note: Valuable operating time is calculated based on Designed cycle time OAE = F / B (4 sources of loss) Overall Asset Effectiveness TEEP = F / A (5 sources of loss) Total Effective Equipment Performance OEE = F / C (3 sources of loss) Overall Equipment Effectiveness Downtime losses Breakdown, set-up, tool change, no material, no operator, planned repairs,… Speed losses Minor stoppages, reduced speed,… Losses not well declared/or wrong C/T (as calculated by difference) • OEE / OAE / TEEP calculation & losses included or not OEE, OAE & TEEP measure effectiveness at different levels : OAE (Overall Asset Effectiveness) measures how effectively the plant’s management is running the equipment. Plant OEE (Overall Equipment Effectiveness) measures how effectively equipment is running when it is scheduled to run Production Team TEEP (Total Effective Equipment Performance) measures how well an organization extracts value from its assets. Business Unit Line-side hour by hour performance board OAE (Hour by hour) database Standard OAE visuals • Data collection and visualization can be manual, automatic or a combination of both. • Various technologies already exist within Tenneco: • WERMA, MES, TEN PI, AQUIWEB ASTREE, Haldan MES,… 168 Waterfall diagram reported weekly Loss pareto reported weekly OAE % weekly trend Top 3 losses reported daily for bottleneck machines ONLY 19% Change over 8% Quality loss 7% Breakdown Real-time OAE% and top losses (required for automated data collection & output) 6% Breakdown1 3% Breakdown2 3% Quality1 89% M1 54% M2 75% M3 62.5% 63.2% 67.8% 64.6% 67.2% 69.3% 65.6% 67.8% 70.3% 65.7% 8.3% 7.9% 8.3% 7.3% 9.4% 6.2% 7.0% 7.4% 7.1% 10.9% 0.0% 10.0% 20.0% 30.0% 40.0% 50.0% 60.0% 70.0% 80.0% 90.0% 100.0% 2021 2022 Jan/23Feb/23Mar/23Apr/23Wk 17 Wk 18 Wk 19 Wk 20 OAE % OAE Performance & Output Set-up % OAE OAE Target 98 92 96 92 89 86 89 84 85 88 0 50 100 0 2 2 0 4 3 3 3 2 3 95 M/C #1 67 71 69 70 69 71 70 71 70 71 0 50 100 8 6 6 8 7 7 6 6 5 6 85 M/C #2 72 76 76 90 85 88 88 92 91 90 100 0 50 4 WEEK2 WEEK4 WEEK1 WEEK7 WEEK3 WEEK9 WEEK5 WEEK6 WEEK8 WEEK10 85 10 8 6 8 4 6 6 4 4 M/C #3 M/C #4 … … OAE above target OAE below target Change over loss OAE Target Hourly Status Board Automatic Data Collection & Display Andon Lights Gemba Walks Escalation Rules KPI’s Display Boards Loss Pareto & Action Plan Tier Meetings (Regular Progress Review) Main Elements for OAE Improvement … a set time, path & agenda! 98 92 96 92 89 86 89 84 85 88 0 50 100 0 2 2 0 4 3 3 3 2 3 95 M/C #1 67 71 69 70 69 71 70 71 70 71 0 50 100 8 6 6 8 7 7 6 6 5 6 85 M/C #2 72 76 76 90 85 88 88 92 91 90 100 0 50 4 WEEK2 WEEK4 WEEK1 WEEK7 WEEK3 WEEK9 WEEK5 WEEK6 WEEK8 WEEK10 85 10 8 6 8 4 6 6 4 4 M/C #3 M/C #4 … … OAE above target OAE below target Change over loss OAE Target Tier 3 Tier 2 Tier 1 Tier Meeting Visualisation Typical Improvement Tools Overall Loss Diagram - Hours 168 144 127 72 44 41 24 17 55 28 3 0 20 40 60 80 100 120 140 160 180 Total time Time not scheduled Total Operations Time Planned down time Run time Downtime losses Operating time Speed loss Net operating time Quality loss Valuable operating time Lunch Breaks Planned Downtime losses Shift changes Organization Multi-skill 3For1 1For3 Minor Stoppages (mainly Auto) Performance losses Reduced Speed (Auto or manual) Tick mark Video analysis Standardized work C/T analysis Changeovers Breakdowns Downtime losses SMED TPM Scheduling Scraps Quality losses Living pareto + shutdown limits Problem Solving xx Associated tools to improve Multi-Level Pareto
- 5. 5 TENNECO CONFIDENTIAL PERFORMANCE MANAGEMENT Main Aims: • Performance management system improves overall organization performance by effectively managing and developing the performance of its employees, through setting clear objectives, monitoring and measurement, feedback and communication, development and training, recognition and rewards and performance improvement activities. Line Side KPI’s What is KPI Objectives of performance management board Require Elements • KPIs - to focus your teams, to make the most impact towards what's most important • Visual management tool to quickly identify deviations and close production gaps Required Elements: • Rate/target/Actual/Gap/Running total • Shift information • Loss (quality, scrap, etc.)+ Comments (loss reasons, actions, action owners, etc.) • OAE% (if generated using automated system) • Bottleneck machine mush have a line-side performance management board! Target Cascade & Tier Meetings Purpose is to align, focus, and engage team members to achieve an organization’s vision of success by cascading objectives on one side and then setting up feedback communication CONTROL loops on the other side Cascade objectives. Be aware of 'concrete v abstract' dilemma, i.e. what is meaningful at one level, when it is cascaded it is not doable at the next. Relates to different time dimensions associated with the hierarchy (in fact it is why we have the hierarchy). Production instruction Visual management Withdrawal Kanban Team Leaders Implement Kanban system in stamping to contribute to OTD to customer Supervisors Assure 100% OTD by developing and implementing manufacturing production control Production Teams Improve customer satisfaction by improving on-time delivery Value Stream Teams Be the #1 widget supplier in the world Plant Management & Staff VSM/FF Objectives Group Leader Performance Objectives Team Leaders Performance Objectives Line Side Performance Objectives Review performance Assess deviations Launch corrective actions Escalate upwards Leader Standard Work Purpose: The things that the managers should do on a scheduled basis (daily, weekly, bi- weekly, monthly) Time Leader Standard Work Management systems Stabilize what works! ▪ Management Systems are not mechanical – they are created and sustained by people. ▪ Constant attention required to sustain and improve. How do we sustain (improve) over time? Otherwise, we return to, or find new, BAD HABITS. Standardization Ownership Auditing Team Leader LSW Group Leader LSW • Develop basic (& stable) structure of daily tasks • Complete the most critical tasks every day • Ensure that the LSW is aligned with other value stream team members Tier 3 Tier 2 Tier 1 Hr x Hr Plant Performance Objectives Tier 4 Plant Plan (AOP) = + Tool – Agenda, Performance Management Board Explanation - Daily meetings connected to the hierarchical design of the plant Purpose - ensuring comparison of actual v target and corrective actions or escalation to next level. Quick response to emerging problems.
- 6. 6 TENNECO CONFIDENTIAL RELIABILITY & MAINTAINBILITY FOCUSSED IMPROVEMENT TEAMS Main Aim of FIT: • Elimination of recurrent issues / equipment weaknesses. • Continuous and sustained Equipment performance improvement. • Positive feed forward loop – PM + AM Objectives Recognize the types of losses: • Bottleneck process • Major cost losses • Define the priority of the losses. • Identify the area of intervention. Selection of the topic/s to be addressed: • Address topics on which the best results can be achieved • Create opportunities to enhance know-how • Identification of a model area: • Attack bottle-neck processes • Attack major losses (cost based if necessary). Objectives • Stratify (pareto) the losses. • Repeat the loss stratification (pareto) process to identify the root causes of the problem • Stratification / explode data to lowest possible level. • Death by pareto! • Repeat the process to identify the root cause loss which, if eliminated, may solve the problem. Objectives Decide on the improvement topic Promote the topic Plan related activities Prepare the activities Define the improvement team with necessary: • Knowledge and skills required • Subject matter expert(s). • Product/process competences • Group dynamics • Individual willingness • Available resources • Members from the affected area. • Typically, 3-5 members, but appropriate for the size of the problem. Objectives Methodology selection criteria: • Important that the FIT utilize the appropriate level of problem solving. Standard/Quick Kaizen: is used when the problem / phenomenon is mostly defined, and data are available.. Major Kaizen: Heavyweight tool for improvement with larger teams and longer timescales (complex problems). Advanced Kaizen: Advanced Kaizen is used in a less frequent way. Tools are generally more complex and sophisticated (e.g., Six Sigma, etc.) Objectives Sharing: The aim is to: • leverage the benefit of improvements across the organization (within the plant and across the group). • Boost to the business but also a source of pride for the FIT. Summary FIT’s play a vital role in TPM by driving CI, problem-solving, and employee engagement. They identify, analyse, and address issues to enhance productivity, quality, and overall efficiency in production processes. Purpose / Usage / Link to other TOS: • Continuous Improvement - drive continuous improvement • Problem Solving - focus on solving specific problems • Employee Involvement - promote employee involvement and engagement. Foster a culture of ownership & responsibility. • RCPS • Cross-functional teams • Data Analysis - gather & analyse data related to the identified issues. • Kaizen Events - aim to make rapid improvements • Standardization - creating and implementing standardized work procedures and best practices • Training and Skill Development - skills development opportunities for team members • …
- 7. 7 TENNECO CONFIDENTIAL RELIABILITY & MAINTAINBILITY – PLANNED / AUTONOMOUS MAINTENANCE Main Aims: An approach that leads to increased equipment availability by reducing downtime due to failure and unplanned (emergency) repairs. Total: All equipment and all employees are involved. Productive: Improving productivity by eliminating waste and enhancing asset effectiveness. Maintenance: Maintenance processes and equipment condition TPM Structure Autonomous Maintenance TPM Total Productive Maintenance 5S Visual Management Problem Solving Focused Improvement Planned Maintenance Education & Training Early Equipment Management Quality Maintenance Safety, Health & Environment Administrative & Office TPM Current focus will be on: • Autonomous Maintenance. • Focused Improvement. • Planned Maintenance Planned Maintenance Planned Maintenance Pillar Asset inventory Risk assessment Maintenance Schedule Maintenance Plan Implementation Monitoring & Evaluation Asset Inventory Inventory created to ID all assets. Asset tag applied to enable rapid inventory identification Risk Assessment Mixer 4 10 Y 1234 N 10 10 10 Y 15 years ago 10 Y 10 1000000 0 0 0 PM ATPP % PM Plan Inplace Y/N Site Asset Number Equipment Load/Utilisation % How many additional M/C'sof the same machine type RPN Supplier still available Y/N Production/Delivery Risk (How long can production run) Machine Criticality / FMEA inplace Y/N Date FMEA last reviewed RISK ASSESSMENT Any Rebuild/Upgrades planned (Y/N) MACHINE INFORMATION FMEA Action % inplace Machine name Machine Age Asset (high level) risk asset identifies potential risks and vulnerabilities in respect of the business. Plant Level – Risk Assessment Equipment Level – Risk Assessment Machine/机: Bike Owner/所有者: Availability/可用性 Performance/性能 Quality/质量 Probability/可能性 Severity/严重 Detection/发现 Cost/成本 Safety/安全 Total/总 PRIORITY/优先 ID 1 Frame 3 3 3 1 3 1 2 3 486 2 Front Rim 3 3 3 1 3 1 1 3 243 2 Front Spokes 1 2 2 2 1 1 1 1 8 2 Front Valve 3 2 2 1 2 1 1 2 48 2 Front Inner Tube 2 2 2 3 2 1 1 2 96 2 Front Quick Release Clamp 3 2 3 2 3 1 2 3 648 2 Back Rim 3 3 3 1 3 1 1 3 243 2 Back Spokes 1 2 2 2 1 1 1 1 8 2 Back Valve 3 2 2 1 2 1 1 2 48 2 Back Inner Tube 2 2 2 3 2 1 1 2 96 2 Back Quick Release Clamp 3 2 3 2 3 1 2 3 648 5 Left Crank Centre Lock Cap 3 3 2 1 3 2 1 3 324 5 Left Crank 2 x Tightening Bolts 3 3 2 1 3 2 1 3 324 Components/组件 Comments and Actions/言论和行动 Cell 13 TPM Team 1. Frame 2. Wheels 3. Seat 4. Pedals 5. Crank 6. Front Deraileur 7. Back Deraileur 8. Brakes 9. Front Forks 10. Handlebars 11. Brakes / Gear Selector 12. Light 13. Waterbottle 14. Saddle Bag 15. Bike Pump Weighted Prioritisation Number • Equipment level risk assessment. Consider risks from an OAE, MFMEA… perspective • Prioritize to identify what we should pay attention to Condition based maintenance Time based maintenance Optimized mix Break down maintenance Maintenance Cost Technical Availability + + TBM – Time-Based Maintenance Replace pre-defined time intervals BDM – Breakdown-Based Maintenance Operate component intentionally until final failure UBM – Usage-Based Maintenance Replace in pre-defined usage intervals CBM – Condition-Based Maintenance Replacement triggered by monitoring condition. • Determine the right maintenance strategy for individual machines and machines aspects. • Must balance the availability objective with cost imperative Maintenance Schedule (Detailed) • A maintenance schedule is created • Specifies maintenance tasks that need to be performed. Spare Parts Control / Warehouse / Cribs ▪ Effective management of maintenance spares is an important contributor to machine availability. ▪ Spare Parts Control…the purpose is to provide the right parts, in the right quantity, to the right place, at the right time. Page: 1 Of 1 Shift Team Leader Maintenance 1 2 3 SEQ SYM 1.1 1.2 1.3 1.4 1.5 File: Symbol Legend: Quality Safety Ergonomics Critical Knack Stockton Robots needle is not in green. If in red STOP machine and notify the Process Tech. and/or Supervisor. If in red STOP machine and notify the Process Tech. and/or Supervisor. Visually Inspect the pressure on the air flow valve for lock. Adjust the pressure if the Visually Inspect the pressure on the air flow valve for extend . Adjust the pressure if the needle is not in green. If in red STOP machine and notify the Process Tech. and/or Supervisor. Visually inspect Water Flow Meter. Any range of green is acceptable. green range. If in red STOP machine and notify the Process Tech. and/or Supervisor weld on parts to specifications. Visually Inspect the Argon Flow Meter . The ball in the sight glass should be in the STOP machine if in Red Not enough gas to form proper Element Number 1 Operational Analysis Keypoint Reason Station Stop #1 Element Name TPM Checks Rev. Date: 5/9/2012 JOB ELEMENT SHEET Control Block Group Leader Engineer Department / Cell Roboic Welder #1014 If in red STOP machine and notify the Process Tech. and/or Supervisor. needle is not in green. Visually Inspect the pressure on the air flow valve for clamp. Adjust the pressure if the STOP machine if in Red If air is too high it can bend the part E K Press #1 Autonomous Maintenance 1 1 2 3 45 3 Checksare onback right ofM/C 1 2 3 4 5 1 2 4 5 1.1 1.2 1.3- 1.5 01-28-20 01-28-20 01-28-20 01-28-20 01-29-20 01-29-20 TPM - SINGLE POINT LESSON (SPL) Subject Implementation of Visual Control on the Pipe Chamfering Machine. Number 132 Date January 23, 2020 Machine Code: M1061 Participants: George White & Anthony Harris Prepared by : John Paul Classification Training Dates Instructors John Paul John Paul John Paul John Paul John Paul John Paul Participants David Mathews Edouard Lee Joseph AlanHenry John RichardPaul MichaelEvans Improvement Case Problem Case _____________ Basic Knowledge Leader Manager TPM Coord. Supervisor X BEFORE AFTER Difficult access to inspect the toothed belt. Easy access to inspect - implementation of visual control (polycarbonate sheet) John Peter 01-24-20 Robert W. 01-24-20 LouisWood 01-27-20 Charles Green 01-25-20 Work Procedures Checklists SPL’s • Checklists and Procedures capture and document good practice • Enables tasks to be codified for the whole organization and activities to be effectively executed. • Represent current best practices for craftspeople, across plants / divisions, assuring consistency and continuity. Maintenance Plan Implementation • Visual Management is used to make defects visible and identify the locations of defects at a glance… • A tagging system is used to highlight defects found during the inspection/maintenance activity. • Tags attached to the equipment where problems are discovered. Repair works orders arising from Autonomous Maintenance, Planned Maintenance, Breakdown Maintenance must be effectively managed. Ideally use a visual management board 1st Shift 2nd Shift 3rd Shift • This is a systematic process used to improve MRO (parts) usage and costs. • Used tools, maintenance parts etc. are collected (bag and tag). • They are analyzed using problem solving methods. • Root causes of premature tool/parts breakage are addressed, captured in standards and shared as best practices. Monitoring & Evaluation T1 & T3 Daily meeting MTTR MTBF • The maintenance activities are monitored daily, weekly, monthly. • The evaluation on an ongoing basis is to ensure that this activity is effective and potential problems are identified We mainly use MTBF & MTTR in TPM! MTBF = Run Time (or Total Operating Time) / Nb of Failures (MTBF : Mean Time Between Failures) MTTR = Total Time to fix the Failures / Nb of Failures (MTTR : Mean Time To Repair) Availability % = (MTBF-MTTR) / MTBF x 100
- 8. 8 TENNECO CONFIDENTIAL ROOT CAUSE PROBLEM SOLVING Main Aims: • Root cause problem solving aims to identify and address underlying cause/s of a problem. By getting to the root cause of an issue, you can develop effective & sustainable solutions that prevent the problem from recurring. Problem Complexity ‘A3’ – Plan-Do-Check-Act Local Simple/independent Common sense Experience sharing A3 3 steps 8 steps 6 Sigma Problem complexity/scope Business impact $ Complex/interrelated large Local team, front line Support team, area/FF SME involvement, plant Sporadic Repetitive problems Infrequent Escalation process • Selecting appropriate level of problem solving effectively find the root cause/s whilst utilizing resources efficiently (effort, toolset…). Problem type I: • Abnormality or Gap to known standard. Correct a process to get back within its specifications/targets. Describe the Problem Analyse Problem Identify Cause Plan/ Select Counter Measure Verify Effectiveness Adopt & Standardize Problem description What? Where? When? How many? Who? How often? POSSIBLE ROOT CAUSE Use additional Problem solving & Quality tools as appropriate Cause-and-Effect Diagram PROBLEM SOLVING WORKBOOK 1 1 1 1 1 1 Systems / Man Machines Materials Methods Measurements Environment C A U S E S O F T H E D E F E C T EFFECT OF THE DEFECT 1 1 1 1 1 1 Personnel Machines Materials Methods Measurements Environment 1 1 1 1 1 1 Personnel Machines Materials Methods Measurements Environment ▪ Take the selected possible causes ▪ Conduct 5 Why analysis documenting all possible branches. Get to root causes ▪ Use data & facts to confirm/disprove validity of each branch ▪ Plan trials and experiment to help confirm assumptions Plan to evaluate potential solutions based on… • Effect on the problem • Practicality • Cost & Time to implement/utilize • Acceptance Consider… • Procedures & Instructions • Personnel Required and Training • Production Scheduling • Unwanted affects • Experiments can demonstrate correlation / causation between input and output. • Have we identified the right ones? • Do we need to go back to the Process Map? • Irrespective – we have increased our learning • We can rule out some inputs. • We are seeking the “ truth ” Process side: Update of relevant standards 5S, Work instructions, Visual management, TPM, Control plans FMEA’s, Drawings, … System side: • What prevented us from being first time right? • How could we improve the system to avoid the occurrence in the future? • Adjust roles and responsibilities? • Could we improve the system to signal abnormality early enough before it turns out to become a problem? • Baseline: A3 report shall be used to document the learnings from the closed activity • Ensures knowledge can be shared between similar manufacturing lines, process teams from same area, between focus factories/value streams from same plant, between plants, between regions. • Problem needs to be solved at the lowest level. Use basic problem-solving approaches first. If this approach is not successful then can escalate and utilize higher level problem-solving e.g., TiPS, 8 steps, six sigma, etc. Problem type II: Improve towards ideal state. Adjust the process to reach new specifications & better performance. • Multilevel Pareto analysis helps you scope down & focus; to maximize the benefit. • What is the problem. • What part has a problem? • New problem or chronical? • Where did the problem occur • Where did we identify the problem? Who reported the problem? • Who is affected by it? • ….. • Process Mapping - GO & SEE ! • Walk the process • Do NOT take process maps from books! • Where is the Point of Cause • Where the problem has been identified • Where are possible escape points, detection failures from the process Fishbone diagram is a good tool to help summarize all potential inputs from brainstorming, using the 6M structure. Problem Manpower Machine Manpower Machine Method Method Material Material How Made? (Occurrence) Why Made? (System) Environment Environment Measurement Measurement A3 Format Local team, front line Support team, area/FF SME involvement, plant B usiness impact $ Problem complexity/scope Local Sporadic Simple/independent Repetitive problems Complex/interrelated large Infrequent Experience sharing Common sense 8 steps A3 3 steps 6 Sigma Focus PLAN DO CHECK ACT Define the Problem Analyze the Problem Identify “true” Causes Reflect about possible counter measures Select the most appropriate counter measure Confirm the expected outcome after implementation of the counter measure Verify the effect of proposed counter measure on the problem Compare Actual outcome with the expected one Adopt as permanent/Standardize if objective is achieved Confirm lessons learned If the results are not satisfactory, run another loop Multi-Level Pareto Possible Cause Potential Cause Potential Cause Actual Cause Root Cause Potential Cause Actual Cause Potential Cause Potential Cause Actual Cause Potential Cause Potential Cause WHY WHY WHY WHY
- 9. 9 TENNECO CONFIDENTIAL • Workstation layout & visual representations of all safety procedures and quality checks. • Tasks are broken down to elemental levels for times and movements. This gives a cycle time for the sequence which is then compared against the takt time. Standardized Work Sheet Properties: 3 main elements in Standard Work: Relation to other PS – elements: • VSM • Employee Empowerment • 5S • Visual Management • Quality Tools • JIT Once times have been established on the Standardized Work Documents the balance of the different jobs is shown on the Work balance charts. Generally speaking the types of activities performed with the use of a Work balance chart can be divided into: • Rebalance of work to implement and/or maintain full work • Rebalance of a process in the event of line speed change • Rebalance of work for improvement through KAIZEN. • Graphically represent the operator & machine time for each step in the sequence. • Allows the work sequence to be analyzed, and overlapping (waste) time to be eliminated. This is often used in the case of multi-machine handling where one operator is running more than one machine. Standardized Work Combination Table • Determine the time per work element. Typically a work element is clocked 10 times, and the best repeatable (not necessarily the average!) is chosen. The sum of all work element times describes the time necessary to perform the process. Time observation sheet • Determine the actual processing capacity of each machine in the work sequence • This ID’s where the bottle necks are and which areas need to be focused on to ensure takt time can be met by all the machines. It is also used to check processing capacity when takt time is changed. Production Capacity Sheet Operators A B C D E Takt Time 1. Preparation • Form a team • Communicate to all affected personnel what you are doing and why 2. Current State • Calculate takt time • Observe the process • Capture the Work sequence elements • Establish Standard time for element • Capture current WIP • Fill out the Standardized Work Combination Table (if needed) • Create Operator Balance Chart • Fill out Standardized Work Chart • Fill out capacity sheet if needed 3. Improve • Analyze the completed sheets • Analyze Videos (prefer. with operators) • Use checklists to identify improvements (Multi-Machine manning, ECRS*) • Optimize work balance chart and/or machine balance chart. • Define improvement actions 4. Training and follow-up • Fill out standard work documentation for improved processes • Organize training • Process confirmation Operators A B C D Takt Time Total Work Time (p. cycle) Takt Time = # of Operators needed Operator Requirement Formula Total Work Time (p. cycle) Takt Time = # of Operators needed Operator Requirement Formula WORK STANDARISATION Main Aims: A method to document and control an agreed standard for performing operation and indirect tasks in a manner that will provide for Continuous Improvement What is Standardized Work? A standard work procedure is the result of organizing tasks in the best sequence of steps to make the best use of people, equipment, tooling and materials. Objectives: … Safety: the safest way to do the job … Quality: Increase process stability by reducing errors and defects ... Cost: stipulate the manning level and rate of production... Delivery : standardize output therefore ensuring we deliver parts on time … Flexibility to takt: Provide a means to adjust resources to changes in customer demand … Kaizen: Provide a basis for improvement … Training: Ensure organizational knowledge & best practices are documented and followed How to Proceed Work Balance Standard work in process: This is items of work that are required in order to maintain a continuous cyclic flow of work i.e. an operator in charge of many machines will require std work in process at each machine. Takt Time: This is the time in which one product/component needs to be produced in order to satisfy the customer demand. The formula is: Takt Time = Operating Time Customer Demand Working Sequence: This is the sequence or order in which a cycle of work is completed. If the work sequence is not specified then the output of the work cannot be reliably specified. Standardized Work Documents STEP 1: Establish the Takt Time per piece for the cell. STEP 2: Determine the Total Manual Cycle Time per piece for the cell. STEP 3: Determine the optimal manpower required for the cell. Optimal Cell Manning Indirect Labour Standardization Develop a standardized work model that can be applied for every Indirect function How • List all Indirect functions, by department • Identify characteristics for each Indirect function and put them in groups • Develop a concept/model to apply the standard work in each group How to Maintain Leadership Developed by Persons doing the activity Leader Routine Verification 4. Frequent and brief interactions 3. Leaders should be learning and understanding 2. Action-oriented and done sitting with the employees 1. Scheduled and synchronized • Process confirmation is the standardized way by which leaders ‘go and see’ that the process is delivering its target condition and where it isn’t, understand and act on the root causes New Hires / Retraining • New hire onboarding & training should be tracked and monitored to ensure all operators on the line can perform tasks per standard work (SOP) Standard Operations Procedure./ Sheet Skills Matrix
- 10. 10 TENNECO CONFIDENTIAL SINGLE MINUTE EXCHANGE OF DIES (SMED) Main Aims: • SMED is a technique to reduce changeovers time (and optimize resources usage where possible) Definition E D S M Single Minute Exchange of Dies Changeover Production run Product A Production run Product B Last part First Good part At rate Changeover: • Preparation (tool, material, document, etc...) • Unload / Load — Remove / Install (tool, jigs, material, etc...) • Locate / Set / Clamp (tool, jigs, etc...) • Adjust / Try-out • Clear away / Wrap the C/O Performed between the processing of two different variants. Changeover time is the time between the last good part of one production run to the first good part of the Next Production run. The time needed can be divided into external and internal changeover time. External Changeover: Setup activity that can be done while the m/c is running Internal Changeover: Setup activity that can only be done when the m/c is stopped. Current Changeover Time External Internal New C/0 Time Internal External Step 4 : Reduce Step 3 : Convert Step 2 : Separate/Externalize Step 1 : Identify How to Proceed Operations Changeover Time 1 • Understand the needed operations to perform a changeover: • ID all needed operations & sequence. • Evaluate time for each operation. • Collect information regarding needed items (like tools, documents, gages, etc…). • ID all safety concerns and the difficulties encountered. • Keep separated those activities that can be considered as pure waste like walking, searching, … Step 1: Identify Operations External Internal Changeover Time Changeover Time 1 2 Step 2: Distinguish between INTERNAL & EXTERNAL operations • Do not spend money on step 2! • Focus on low cost, no cost, easier to implement’ solution! Previous part number New part number Changeover BEFORE AFTER Some current Internal operations can be Externalized and be done either: BEFORE stopping the machine (the last part): as a preparation Or AFTER restarting the machine (the first good part at rate) Operations External Internal Changeover Time Changeover Time External Internal 1 2 3 Step 3: Convert INTERNAL into EXTERNAL operations • These solutions are typically more technical than organizational, and often more expensive than the ones implemented during the Step 2. • Few very typical examples: • Tool pre-assembly (e.g., Cassette-die, with cassette pre-assembled externally) • Tool pre-setting (e.g., Pre-setting bench) • Tool pre-conditioning (e.g., Pre-heating bench) Changeover Time Operations External Internal External Internal External Internal External Internal Changeover Time 1 2 3 4 Step 4: Reduce both INTERNAL and EXTERNAL operations • Start with the INTERNAL activities as the machine is stopped : impact on the changeover time • Continue with the EXTERNAL activities : impact on productivity and availability of critical resources (setters) Minimize MOTION – less walking, searching,… • Improve storage & management of tools and all needed items • Parallel operations: more than 1 operator (Be very careful about Safety!!!) • Standardization of the main functions • Focus on bolts/screws elimination • Eliminate adjustment : Right First Time • Automation / Mechanization Bolts and Screws focus. Set-up Cart Clearly defined SOP Time Date Otherwise, we return to, or find new, BAD HABITS. Standardization Ownership Auditing Eliminate Adjustment Sustain Track each changeover v target Escalation / Counter Measure
- 11. 11 TENNECO CONFIDENTIAL VISUAL MANAGEMENT AND CONTROL Main Aims: • Implement systems that generate control within the working environment, enabling all members to differentiate between normal & abnormal immediately Current State: Waste (e.g. searching for tools) Little transparency (due to lack of orderliness and information overflow) Quality risks due to lack of cleanliness Too many accidents Minimal member involvement Future State: Proactive waste elimination Increases productivity / reduced cost Improved working environment No Accidents Increase of morale and motivation Member involvement in problem resolution / continuous improvement • Visual Management systems make the process transparent – an abnormality can be identified IMMEDIATELY. The status of the business is communicated visually, at a defined frequency, and is therefore controllable. Waste is driven out of the process. The Visual Management concept provides a common link through all of the PS elements. To CONTROL the elements and tools (to realize their benefits) we must SEE the condition. • There is little investment required to achieve a high return. The reaction of the organization to the visual information is critical. Without recognition and response, PERFORMANCE will not be achieved. DEFINITION See 5S Clear identification of parameters of control Automatic equipment / human response to parameters exceeding the standard Visual Management Visual Control 5S Implementation What is Visual Management? Objective How to Proceed Complete Current State Map (see VSM), grasp the current condition Set the STANDARDS Communicate Visual Management purpose / benefit to ALL employees Select a pilot line / area Implement Visual Management and assess impact upon metrics Confirm, and implement systems to maintain, and roll out People record information by: Sight: 83% Hearing: 11% Smell: 3.5% Touch: 1.5% Taste: 1% Team Territory: Identification of territory Identification of activities, resources, products Identification of the team Markings on the floor Marking of tools and racks Technical area Communication area and rest area Information and Instructions Neatness (broom) Visual Documentation Manufacturing instructions & technical procedures Displaying Indicators Objectives, results, and differences Visual ProductionControl Computer Terminal Productions Schedule Maintenance Schedule Identification of inventories and work- in-process Visual Quality Control Monitoring signals for machines Statistical process control (SPC) Record of problems Rendering Progress Visible Improvement activities Company project & mission statement Visual Management Elements / Sub-Elements 1 – Workplace organisation – 5S LINE ABC A108 X292 CY089 A108 X292 CY089 Scrap 2 – Visual Displays & Escalation rules 4 – Visual Controls 3 – Visual Metrics Presse N12 Press N12 5s 5S of the workplace is the 1st Step of implementing visual management Visual Display & Escalation Rules • Visual Displays are methods to visually communicate important information and to make them accessible to anybody (not only to the “experts” of the area). • This typically includes information like: • Safety, Storage, Quality, Operation, Work environment, Equipment, etc… Scrap • Visual Metrics are used to inform and communicate in a comprehensive manner results, progresses, status, etc… • The purpose is to make performance visible. • This is typically achieved by using: - Visual representation like graphs, Pareto's, action plans, etc… - Ideally using colours, symbols, smileys, arrows, etc… Visual Metrics Visual Control • Visual Controls are about building Established Standards into the workplace allowing easy management and early abnormalities detection. • Make the workplace environment communicate itself the standard conditions. • This is typically achieved by using: • Visual aids on machine, visual scheduling and stock management, visual documents (SOPs), etc… • Ideally using limits, colours, alerts etc…. A B C A A A A B C B D D E E E E F F F Escalation rules should be displayed, trained and audited Escalation Rules • Execute action to improve trends and to put the onus on those responsible for the area to act.
- 12. 12 TENNECO CONFIDENTIAL 5S – WORKPLACE ORGANISATION Main Aims: • 5s methodology results in a workplace that is well organized, clean, uncluttered and safe, to help reduce waste and optimize productivity. What is 5S? Traditional State: Too many accidents Waste (e.g. searching for tools) Little transparency Quality risks Cleanliness / orderliness are not part of every operator‘s personal attitude Minimal member involvement Future State: Increased safety Transparent processes Increase Transparency Increased productivity / reduced cost Increased morale and motivation Member involvement Enhanced plant appearance 5S is a systematic approach to improve cleanliness and orderliness in the workplace. The method can and should be used on the shopfloor as well as in the office. Orderliness and Cleanliness make all processes transparent, so that an abnormality can be identified IMMEDIATELY. Therefore 5S is also the basis for Visual Management: Definition: Distinguish between what is, and what is not needed Identify items that are not needed or never used throughout a workday. Attach a 5S Tag to items in question that may be unneeded or broken. Move tagged items to a temporary holding area. Set a time to hold for the tagged items. Review red tagged items and determine whether to use elsewhere, store, or discard Definition: A place for everything, and everything in its place... Store all items close to where they are needed to avoid unnecessary handling and transportation; order according to frequency and sequence of use Set and document the Visual Standards Identify and mark the home positions of equipment, flowracks, process and pedestrian related issues (i.e. floor tape / walkways / shadow board) Identify visually the minimum and maximum levels of relevant items (ie. Inventory) Benefit: Clear Visual standards – measurement of organisational discipline. THE ABNORMAL BECOMES CLEAR EASILY. Definition: Cleaning is about self-discipline! Cleaning involves all senses: Seeing, Hearing, Smelling and Touching Prioritize safety, quality and reliability issues (merely cosmetic actions have lowest priority) define frequency to a level that sustains set standard Benefit: Safe and friendly working environment, developing member OWNERSHIP Definition: MAINTAIN the STANDARDS through discipline and habitual regular process confirmation by Leadership Daily confirmation by ALL organisational levels (NO unnecessary items, NO dirt, NO mess) Documented record and visualisation Continuous challenging of standards to drive continuous improvement and operating culture (create a crisis – continuous tension) Use Kaizen workshops to improve standards Recognition to areas / members with outstanding effort / condition 1. SEIRI = Sort 2. SEITON = Set in Order 3. SEIKETSU = Shine 4. SEISOU = Standardize 5. SHITSUKE = Sustain Definition: Do the right things in the right way, every time! Set and document the standards and schedule for the first three S‘s Assign responsibilities by department, group, team and individual (VISUALIZE!) Set management escallation process for defined problem trigger points (i.e. no. of defective products exceeds standard) Cleaning and Setting things in order become DAILY actions Objectives How to Proceed Sort Set-in-Order Shine Standardize Sustain Physical Change Procedures to sustain Seiri (Sort) Seiton (Set in order) Seiso (Shine) Seikets (Standardize) Shitsuke (Sustain) To neatly arrange and identify parts and tools for ease of use To conduct a cleanup campaign To conduct seiri, seiton, and seiso daily to maintain a workplace in perfect condition. To form the habit of always following the first four S’s. To separate needed tools, parts, and instructions from unneeded materials and to remove the unneeded ones. Reduces search Fight waste Improve productivity One TEAM! Facilitates troubleshooting Trust customers Visual inspection Reduces unplanned downtime More effective and more efficient MUDA hunting Ergonomics and safety improvement Quality improvement Exposes problems Spread discipline to follow the standard Improve and maximize space Personal and professional growth Define Responsibilities • Define areas (the whole site including to the boundary of the site) • Define champion for each area • Train the local team members & champions • Development of the champions by co-auditing • Organize audit structure (cadence, audit frequency) • Follow-up audit results and action items Recognition - Award Layered Audit Process 5S Audit