The document summarizes the findings of the Miami Valley Regional Planning Commission's 2005 Open Space Assessment study, which aimed to update the region's open space database and examine open space status. Key findings include:
- The Miami Valley region contains over 116,000 acres of open space across 2,268 facilities, a 18.7% increase from 1993.
- Open space/recreational facilities make up 64% of regional open space acreage. Landfills/mining and schools also account for a significant portion.
- Montgomery County leads the region in both total open space acreage and facilities, while Preble County has the most open space per capita.
- Most counties saw increases in both open
The document summarizes the GIS analyst's role and responsibilities on various projects for the Delaware Valley Regional Planning Commission (DVRPC). It describes 10 projects the analyst led involving creating maps to assist regional planners. These included studies of transportation networks, land use, the environment, and proposed development. The analyst was responsible for gathering data, producing maps of various sizes, and ensuring projects were delivered on time. Communication and teamwork were essential to meeting the needs of the planners.
Building Land Use/Land Cover maps from OpenStreetMapMarco Minghini
These slides were presented at the conference "Mapping, Sensing, and Crowdsourcing Geographic Information", organized as the final joint meeting of the two EU COST Actions TD1202 "Mapping and the Citizen Sensors" (http://www.citizensensor-cost.eu) and IC1203 "ENERGIC" (http://vgibox.eu). This work explains the creation of an automated procedure to convert OpenStreetMap (OSM) data into Land Use/Land Cover (LULC) maps, using the nomenclatures of the two most popular European LULC maps, i.e. Urban Atlas and Corine Land Cover. The procedure is implemented using open source software.
This document analyzes suitable landfill sites for the cities of Mombasa and Kabul. For Mombasa, it considers geology, water tables, population density, proximity to the airport, and road connectivity to identify three potential sites - Mwakirunge, Mombasa Road, and Miritini. For Kabul, it examines terrain, the airport location, population density, and road networks to shortlist two potential sites near Jalalabad Highway and Ustad Rabbani Road in the east and west of the city. Key factors included avoiding flood-prone coastal areas, porous soils, populated zones, and optimizing transportation access.
Gisand Remote Sensing Applied To Land Use ChangeOf The Prefecture Of CASABLAN...IJERA Editor
The population and urbanization of Morocco are increasing very rapidly. They have risenin large cities due to heavy immigration rate from rural areas to accessjob opportunities, better education, and better health facilities. Casablanca has the most affected land use changes in Morocco because of the immigration. This paper presents anintegrated study of land use change in this city from 1986 until 2011 using topographic map sheets (1986) and satellite image (2011). The layers of landuse map (1986) were obtainedby digitization technique in ARCGIS 9.3 software. Supervised classification methodology has been employed using maximum likelihood technique in ERDAS IMAGINE (2011) to extract from the satellite image four classes which were categorized into, built-up area, public green spaces, agricultural land and water bodies. The totalarea of each class was estimated by using geometry tools of ArcGISsoftware to compare land use changes between 1986 and 2011.
Methodology for Identifying Regional Poles under Territorial Engeneering Appr...inventionjournals
This article develop a methodology for identifying regional poles under the concept of Territorial Engineering approach. The objective is to establish a methodology for identifying these poles, using specific social and economics characteristics, using ABC curves to select the productions in order to verify the economic productive vocation. The case study was applied to the areas of influence of the Tocantins Waterway. In the case studied, the strengthening of regional poles has the potential to attract the productive sector and increase the traffic flow, contributing to the viability of investments in the waterway infrastructure.
The Turkana area of Kenya, one of the poorest in Africa, is undergoing major changes, primarily linked to the discovery of oil in the region. These maps start to uncover some of the potential impacts of these changes on people and the environment.
This document analyzes a proposed transmission line corridor from Manatee County to Sarasota County in Florida. The analysis aims to choose a route that minimizes environmental and community impacts. It finds that the corridor would be 25 miles long, impact 87 homes, 417 parcels of land, 163 acres of conservation land, and 914 acres of wetlands. The cost to construct the transmission line along this corridor would be between $41-68 million. Some limitations of the analysis include difficulties distinguishing homes from other structures in aerial imagery.
The document summarizes research on the geomorphology and soils of Cul de Sac Valley in Haiti. Field work and digital soil mapping techniques were used to create a new detailed soil map. The map identified 11 soil map units aggregated from 3 major geomorphic units: dissected alluvial fans, hills, and flat plains. The soils were influenced by marine deposits and limestone bedrock, resulting in high carbonate and sodium levels throughout the profiles. The new soil map improved on existing maps by better representing the relationships between soils and geomorphology in the valley.
The research paper deals with the method of forming an information system for
mining areas management on the basis of conducting comprehensive monitoring and
maintaining a cadastre of mining areas (MAs). Ensuring security and safe living
conditions of the population when using such areas, especially in the interests of
future generations, is a priority as-pect of their sustainable development. Extraction
of minerals is accompanied by active transformation and destruction of the earth’s
surface, which leads to the formation of specific mining landscapes that have a
significant impact on the sus-tainable development of such areas. The objective of this
study is to provide information management of the sustainable development of
landscapes of mining areas based on the formation of an integrated information
system for monitoring these areas and the development of cadastral works of the
objects of mining complexes (MCs). The method proposed by the authors
The Utah Abandoned Mine Reclamation Program developed a GIS-based model to prioritize abandoned mine sites for reclamation. The model analyzes three factors that influence hazard ranking: mining activity locations, nearby population, and road access. It assigns scores to these factors for grid cells covering the state, sums the scores to generate composite rankings, and identifies areas above a hazard threshold for project selection. The model is refined over time as new data becomes available and higher-ranked sites are reclaimed.
Using BI for deciding and planning the best usage for governmental landscadysamer
how to apply business intelligent techniques in planning and deciding the best usage for lands by categorizing govenmental lands by its criteria and by applying specific model (BILUPC model) you can achieve the proposed result by describing the land by agricultural, industrial or whatever....
TANAP - Trans Anatolian Natural Gas Pipeline ProjectITE Oil&Gas
Presentation at TUROGE 2014 (Turkish International Oil and Gas Conference) on the Trans Anatolian Natural Gas Pipeline Project. The speaker provides an update on the TANAP project.
By Saltuk Düzyol - General Manager, TANAP
This document summarizes the findings of the 2005 Miami Valley Open Space Assessment. It found that the Miami Valley region contains 2,268 open space facilities totaling 116,191 acres, or 6% of the regional land area. Since the previous 1993 assessment, open space acreage has increased by 15,000 acres (18.7%) while agricultural land has decreased by nearly 160,000 acres (10%). The report compares current open space data to the 1993 inventory and concludes with a vision for expanding the regional open space network going forward.
This presentation summarizes a project to inventory public shoreline access in Hawaii. It discusses proposed legislation supporting public shoreline access, methods for data collection including collaborating with state and county agencies, examples from pilot studies and case studies on Maui and the Big Island, recommendations for moving forward and maintaining the data collection long term. The goal is to create a comprehensive database and maps of public shoreline access points and facilities to help ensure public access to beaches and shorelines.
This document provides an updated land use and transportation plan for the Red Lake Reservation. It includes background information on the reservation's history, population and housing characteristics, and economic profile. The main body of the document contains a land use plan section that inventories existing land use and resources, analyzes trends, and makes recommendations for future land use. It also includes a transportation plan section that inventories and analyzes the existing transportation system and identifies goals and policies for future transportation improvements. Maps and tables throughout provide supporting information. The overall goal is to provide a coordinated planning process and framework to guide future development decisions.
The Delaware Office of State Planning Coordination is updating the 2004 Delaware Strategies for State Policies and Spending. The Strategies are used to coordinate land use decisions made locally with infrastructure and service provision by the state. As part of the update process, the office is collecting data on suitable areas for development, preservation, and protected lands. This data will be analyzed using GIS mapping and classified into levels and categories. Public workshops will be held in June and July to gather feedback on the draft updated Strategies before presenting to the Cabinet Committee on State Planning Issues and the Governor for approval in September.
Third Workshop of the Central America, Caribbean and Mexico Soil Partnership | 20 - 22 February 2018 | Panama City, Panama
Representatives from 15 countries of Central America, Mexico and the Caribbean region analysed in Panama the key achievements of the Regional Soil Partnership and strengthened its engagement to implement their Regional Plan.
The document discusses the U.S. Geological Survey's National Geospatial Program. It provides an overview of the program's goals, products and services which include topographic maps, elevation data, imagery and natural hazard response. The program aims to provide geospatial data and services that are used by a variety of sectors for applications such as infrastructure planning, natural resource management, and emergency response. It also discusses the program's partnerships with other organizations to acquire new geospatial data and engage users.
Coastal Landcover Trends & Applications in the NWEric Morris
This document discusses the Coastal Change Analysis Program (C-CAP), a NOAA program that produces land cover and change information for coastal regions of the United States. C-CAP creates national land cover maps every 5 years using remote sensing and updates coastal areas of the National Land Cover Database. It focuses on detailed mapping of wetland areas. The document outlines the history of C-CAP mapping efforts, describes the land cover classes mapped, and provides an example of analyzing land cover change between 1996-2010 in a coastal region where development increased by 8,887 square miles and forest and wetlands decreased slightly. It also demonstrates tools for analyzing high resolution C-CAP data and land cover change over time at local scales.
Assessing Spatial Equity and Accessibility to the Little Sugar Creek GreenwayRay Atkinson
This document discusses assessing spatial equity and accessibility to the Little Sugar Creek Greenway in Charlotte, North Carolina. It begins with an introduction that discusses the importance of greenways and trails for recreation and transportation. It then reviews literature on previous studies of greenway users. The purpose of the study is to discover if greenway users rely on cars for access or can walk, and if access is equitably distributed. The methodology will use GIS to analyze spatial access and a user survey of the Little Sugar Creek Greenway. Results, limitations, future research, and conclusions will then be discussed.
The document summarizes a presentation given at the 2008 Eco City World Summit about using geospatial information systems to analyze pollution abatement efforts in southern Mississippi. It outlines the objectives, background, methodology, study area, environmental analysis findings, and conclusions. Key points included analyzing pollution sources and impacts, identifying remediation opportunities, and designing a geospatial method to assess pollutant extent and locations.
The document provides a management plan for Wright Park in Middlebury, VT. It includes details on the park's location within Addison County and the town of Middlebury. The plan summarizes the park's history of land use and current recreational uses. It also analyzes the park's environmental features, including topography, water resources, soils, natural communities, and avian wildlife. The document outlines community goals for the park through public engagement and reviews recommendations to balance conservation and recreation based on an assessment of constraints and opportunities.
This document discusses how remote sensing and classified land cover data from satellite imagery can help improve land use decision making. It provides an overview of Landsat satellites and moderate resolution imagery, which have collected data for over 30 years. Land cover classifications can be created from Landsat imagery to document landscape changes. The document highlights a case study of coastal Southern California where land cover changes from 1984 to 2011 were analyzed using Landsat imagery. Key findings included increases in impervious surfaces and fire risk from urban expansion. Growth projections to 2020 also estimated increases in stormwater runoff and decreases in water infiltration.
Prototype Global Coding of Political Geographies for Library and Data Managem...Tom Christoffel
Abstract
Regional geographic analysis in the United States is constrained by the alphabetic FIPS codes which were assigned in the 1960’s. Base codes were assigned alphabetically for states, then alphabetically for counties and comparable geographies within states, making it simple to lookup individual state or county data in a list, but offering no geographic information on proximity. Some regional aggregation was done in the establishment of Metropolitan Statistical Areas (MSA), which were separately coded. At the same time, there was no comparable national system to aggregate non-metropolitan counties into standard regions, although most states established some form of multi-county regional councils. Some, like Virginia, used sub-state districts for data aggregation and use by other State agencies, allowing the region number to act like a FIPS code that also embedded geographic information.
The author began work in 1998 on the issue. A review of other national and international systems led to the conclusion that a global geocode system was needed, since existing formats were based on the alphabetic approach which could be handled by early computing. Economists Jeffery Sachs and James K. Galbraith have expressed interest in such a system, as Professor Sach opened his 2012 AAG address by saying that “economists think counties are arranged alphabetically on the globe, since that is the way the data appears.” The purpose of this paper is to present the prototype design for the purpose of further consideration by the user communities.
The system is based on a geocode scheme set up for earth that focuses on established political boundaries as a basis for regional grouping of nations, states and localities. It is decimal system based to take advantage of the sort criteria for numbers in computers. It utilized the Sector Group and Region codes of the United Nations and ISO. Geographic information system technology does not solve the problem, but its tools can be used with the geocodes.
The geocode system effectively organizes Wikipedia entries as a library management and the geocodes can be used for data aggregation. This has been developed under a Creative Commons license and would benefit from a global network implementation where local users cooperatively related subnational geographic regions and component political geography.
Papers in Applied Geography, Volume 36, 2013
This document discusses evaluating the seismic risk to geodetic survey markers in western Riverside County from a large earthquake. Data on earthquake shaking potential, landslides, liquefaction, faults and roads were analyzed in GIS to assess risk to each survey marker. A table was created showing the nearest low-risk road to each marker and whether it is at risk from hazards. A graph shows the number of markers at risk from landslides, liquefaction or being near a fault. The analysis will help plan access to the markers after a major quake.
This document provides an outline for a presentation on exploring alternative water transfer markets on the Colorado River. It discusses researching water wheeling policies and building relationships with agricultural users outside the Central Arizona Project to facilitate water transfers. Decision support tools that will be used include geospatial data on crops and water usage, as well as examining the complex water governance institutions involved in Colorado River management. The goal is to create better functioning water markets that move undervalued water to higher uses through the use of these decision support tools and investment in social capital.
The document provides an economic development plan for the west side of Lake Helen, Florida. It defines the study area around an I-4 interchange and creates 3-mile and 5-mile market assessment areas. An analysis of existing conditions in the study area finds it includes 195 parcels totaling 471.57 acres, with the most common land uses being residential vacant land, commercial vacant land, residential single family, and store-office-single family residential. The plan will provide industry and use recommendations for the study area based on the existing conditions analysis and a market assessment of the surrounding region.
The document summarizes archaeological work conducted as part of the Permian Basin Programmatic Agreement in southeastern New Mexico, including surveys, testing, and excavations at sites like Laguna Plata and Boot Hill. Key findings include evidence of increased occupation and land use in the early Formative period based on radiocarbon dates, and analysis of materials from Laguna Plata suggesting it may have served as a seasonal aggregation site facilitating trade and exchange. Standards for analysis were also established to improve data comparability across projects in the program area.
This document provides an overview of land use and soil-related activities in Sudan. It discusses the four main types of land use: irrigated agriculture, rainfed agriculture, grazing, and forestry. It also outlines Sudan's implementation of the five pillars of the NENA soil plan, including sustainable soil management, awareness raising, research, developing a soil information system, and strengthening soil description and analysis methods. Some of the main obstacles to soil activities in Sudan are issues with global connectivity needed for the soil information server, gaps in SUSIS staff capacity and legacy soil data, and difficulties conducting field work due to fuel shortages and rains.
Percent Developed Imperviousness within the Fayetteville Arkansas Planning AreaThomas L Brown
Utilizing the MRLC NLCD Percent Development Imperviousness product to establish metrics to monitor and manage urban runoff potential within the Fayetteville Arkansas Planning Area.
2050 Long Range Transportation Plan Update April 2021 public meeting MVRPC
The 2050 Long Range Transportation Plan is being updated with a new financial analysis, project list, and analysis through May 2021. The plan covers a 20+ year horizon for multi-modal transportation strategies and projects in the region. New initiatives in the update include scenarios for connected and autonomous vehicles, a pedestrian crash risk assessment, an updated project evaluation system, a performance management approach, a climate change section, and a basic accessibility analysis. The draft plan includes 212 roadway projects costing $2.3 billion and revenue of $2.9 billion, as well as transit and alternative transportation modes such as bikeways and ridesharing programs costing a total of $3.8 billion. The plan is required to demonstrate air quality conformity
2050 Long Range Transportation Plan Update October 2020 public meetingMVRPC
The document summarizes a virtual public participation meeting for an update to a Long Range Transportation Plan. It provides information on the timeline and process for the plan update through May 2021. It also gives an overview of proposed transportation projects, listing the number and estimated costs of roadway, bike/ped, and transit projects that are funded and unfunded. Instructions are provided for viewing the projects on an interactive map and submitting comments.
Plan2050 Virtual Public Meeting August 19, 2020MVRPC
This document summarizes the contents that will be presented at the virtual public participation meeting for the Long Range Transportation Plan update by the Miami Valley Regional Planning Commission (MVRPC). The plan update identifies multimodal transportation strategies and investment priorities for the region through 2050. Key topics to be covered include safety and crash analysis, congestion levels, accessibility of services, land use projections, and performance measures. Public input will help guide MVRPC's transportation goals and investments for the next 30 years.
The document provides an update on transportation performance management targets for Ohio. It discusses setting targets for safety, pavement condition, bridge condition, travel time reliability, freight reliability, and CMAQ emissions through 2022. The Metropolitan Planning Organization for the Miami Valley region will support Ohio's statewide targets for the first performance period from 2018-2021 for these measures. The document also provides baseline data and 4-year targets for the region.
This document summarizes the Miami Valley Regional Planning Commission's (MVRPC) use of GIS. It discusses a 2015 GIS needs assessment survey of local jurisdictions, the development of a recreational assets map and inventory, updates to regional GIS layers like zoning and land use, new online mapping applications, GIS trainings provided, and plans for future GIS services and trainings. The overall purpose of MVRPC's GIS program is to provide data and expertise to support regional planning and local needs.
The survey results identified current GIS usage in the Miami Valley region of Ohio. 94% of respondents currently use GIS, with ESRI/ArcGIS being the most popular software. Common needs included more data like utilities, transportation, land use and census data. Respondents were interested in mobile, web and additional training. Suggested projects included developing inventories of parcels, assets, utilities and socioeconomic data, as well as standardizing data and creating a catalog of available resources.
This document summarizes a presentation given at the Miami Valley Planning & Zoning Workshop on GIS in the Miami Valley region. It discusses the results of a 2015 GIS needs assessment survey, including what data and software are currently used. It also outlines several GIS projects undertaken by MVRPC, including a recreational asset inventory map, updated regional data layers, and new online mapping applications. MVRPC aims to continue providing GIS services, training, and collaborative regional mapping applications to share data and expertise with local jurisdictions.
This document summarizes a presentation given at the Miami Valley Planning & Zoning Workshop on GIS in the Miami Valley region. It discusses the results of a 2015 GIS needs assessment survey, including what data and software are currently used. It also outlines several GIS projects undertaken by MVRPC, including a recreational asset inventory map, updated regional data layers, and new online mapping applications. Lastly, it discusses future GIS training opportunities and plans to continue providing GIS services and expertise to member organizations.
The document describes a regional planning initiative in the Miami Valley region of Ohio that developed a future regional growth framework map. The framework was created using a "wheels of the future" approach, which intersected data from different factors like development status, protected lands, urbanized areas, zoning, and land suitability studies to assign categories for future development, redevelopment, or preservation to census blocks. A geographic information system was used to compile and analyze the data from these factors and formulate scenarios to identify recommended solutions for a regional growth framework map to guide long-term strategic land development.
Full planning support system at your fingertips mvopc p&z_120712MVRPC
This document discusses planning support systems (PSS) and their use by the Miami Valley Regional Planning Commission (MVRPC) and the City of Kettering, Ohio. It provides an overview of what a PSS is, describes some of the current and emerging PSS applications used by Kettering like GIS systems, permit and land management software, and mobile technologies. It also discusses the benefits of PSS, challenges faced, and future plans to expand data sharing and public access to planning information through PSS.
The document summarizes efforts by the Miami Valley Regional Planning Commission to update their wetlands inventory of the Miami Valley from 1997 data to a new interactive web map in 2014. It describes visiting over 300 wetlands and identifying over 4,700 total wetlands in the region. It also outlines the transition from the original ArcInfo coverages and database files to the new online map.
The document discusses GIS services that MVRPC provides to its member communities. It outlines two components: 1) GIS Professional Support Services which provides on-demand support, training, and publishing of layers; and 2) Regional Geospatial Coordination which involves collaborative partnerships to identify shared needs and layers through a working group. Contact Tom Harner or Martin Kim for more information on how MVRPC can help member communities with their GIS needs through these services.
The Miami Valley Regional Planning Commission (MVRPC) provides GIS resources and services to local governments and organizations in the Miami Valley region. MVRPC's GIS coordinator oversees regional geospatial coordination efforts including maintaining shared GIS datasets, developing web mapping applications, and conducting needs assessments to help partners improve their GIS capabilities. MVRPC supports partners' GIS needs through professional services such as training, assistance updating data layers, and publishing layers online for public access.
The transportation plan update document discusses several key topics in transportation planning for the region including air quality and conformity with emissions standards, fiscal constraint analysis balancing projected costs and revenues, safety and congestion conditions analysis, assessment of alternative transportation modes and their impacts, and environmental justice and mitigation analyses. The environmental mitigation analysis identifies transportation projects with potential impacts to environmental resources through mapping and categorization of projects and their intersections with wetlands, watersheds, species habitats, cultural sites, and other protected areas.
Phase II Scenarios Evaluation Review Meeting presentation 101410MVRPC
This document summarizes a meeting to review the land use scenario evaluation process for a regional planning effort. It outlines the agenda, which included an overview of the scenario building and assessment process, a tour of the scenario assessment tool, and preparations for upcoming public open houses. The process involved developing land use themes and scenarios, refining them based on workshops, conducting technical analyses to evaluate impacts, and sharing results at open houses. Workshops were held to gather input on preferred development areas and principles for each theme. Scenarios were then evaluated based on criteria like accessibility and land costs. Upcoming public outreach events were reviewed to gather additional feedback on preferred growth patterns for the region through 2040.
The survey summarized:
1) Gathered local planning documents from jurisdictions to compile a GIS database and understand local issues.
2) Most jurisdictions responded and provided comprehensive plans and GIS data.
3) The content analysis identified common strengths like parks and character, and challenges like land use and transportation across the region.
4) Land use and providing services were two major concerns reflected in local plans.
This transportation plan update document outlines a safety and congestion analysis of the current transportation system as well as alternative transportation modes for passengers and freight. It also includes a community impact assessment and projections for land use and socioeconomic factors.
The Census Bureau, in partnership with other federal and state agencies, produces data on employment and where employees live. The Longitudinal Employer-Household Dynamics program combines administrative data to provide a larger, more detailed data set on employment and workers' trips from home to work. The data derives primarily from unemployment insurance records, so it is important to note that not all jobs are counted. Examples of jobs not counted in this data set include military in uniform, self-employed workers, informally employed people, and postal employees.
This data set is compiled annually, although the latest release is for 2011. The information presented by MVRPC in these maps is based on the workplace, not the worker’s home. These maps are of all jobs, not just an employee’s primary job.
2008-2012 ACS Census Profile for the Miami Valley regionMVRPC
This document provides a summary of data from the 2008-2012 American Community Survey for several regions in Ohio. It includes statistics on educational attainment, housing costs, income levels, employment status, transportation, and poverty by census tract. Maps show levels for these variables compared to regional averages, with census tracts shaded based on being above, below, or not significantly different from averages.
How to Setup Warehouse & Location in Odoo 17 InventoryCeline George
In this slide, we'll explore how to set up warehouses and locations in Odoo 17 Inventory. This will help us manage our stock effectively, track inventory levels, and streamline warehouse operations.
How to Fix the Import Error in the Odoo 17Celine George
An import error occurs when a program fails to import a module or library, disrupting its execution. In languages like Python, this issue arises when the specified module cannot be found or accessed, hindering the program's functionality. Resolving import errors is crucial for maintaining smooth software operation and uninterrupted development processes.
Chapter wise All Notes of First year Basic Civil Engineering.pptxDenish Jangid
Chapter wise All Notes of First year Basic Civil Engineering
Syllabus
Chapter-1
Introduction to objective, scope and outcome the subject
Chapter 2
Introduction: Scope and Specialization of Civil Engineering, Role of civil Engineer in Society, Impact of infrastructural development on economy of country.
Chapter 3
Surveying: Object Principles & Types of Surveying; Site Plans, Plans & Maps; Scales & Unit of different Measurements.
Linear Measurements: Instruments used. Linear Measurement by Tape, Ranging out Survey Lines and overcoming Obstructions; Measurements on sloping ground; Tape corrections, conventional symbols. Angular Measurements: Instruments used; Introduction to Compass Surveying, Bearings and Longitude & Latitude of a Line, Introduction to total station.
Levelling: Instrument used Object of levelling, Methods of levelling in brief, and Contour maps.
Chapter 4
Buildings: Selection of site for Buildings, Layout of Building Plan, Types of buildings, Plinth area, carpet area, floor space index, Introduction to building byelaws, concept of sun light & ventilation. Components of Buildings & their functions, Basic concept of R.C.C., Introduction to types of foundation
Chapter 5
Transportation: Introduction to Transportation Engineering; Traffic and Road Safety: Types and Characteristics of Various Modes of Transportation; Various Road Traffic Signs, Causes of Accidents and Road Safety Measures.
Chapter 6
Environmental Engineering: Environmental Pollution, Environmental Acts and Regulations, Functional Concepts of Ecology, Basics of Species, Biodiversity, Ecosystem, Hydrological Cycle; Chemical Cycles: Carbon, Nitrogen & Phosphorus; Energy Flow in Ecosystems.
Water Pollution: Water Quality standards, Introduction to Treatment & Disposal of Waste Water. Reuse and Saving of Water, Rain Water Harvesting. Solid Waste Management: Classification of Solid Waste, Collection, Transportation and Disposal of Solid. Recycling of Solid Waste: Energy Recovery, Sanitary Landfill, On-Site Sanitation. Air & Noise Pollution: Primary and Secondary air pollutants, Harmful effects of Air Pollution, Control of Air Pollution. . Noise Pollution Harmful Effects of noise pollution, control of noise pollution, Global warming & Climate Change, Ozone depletion, Greenhouse effect
Text Books:
1. Palancharmy, Basic Civil Engineering, McGraw Hill publishers.
2. Satheesh Gopi, Basic Civil Engineering, Pearson Publishers.
3. Ketki Rangwala Dalal, Essentials of Civil Engineering, Charotar Publishing House.
4. BCP, Surveying volume 1
Leveraging Generative AI to Drive Nonprofit InnovationTechSoup
In this webinar, participants learned how to utilize Generative AI to streamline operations and elevate member engagement. Amazon Web Service experts provided a customer specific use cases and dived into low/no-code tools that are quick and easy to deploy through Amazon Web Service (AWS.)
Strategies for Effective Upskilling is a presentation by Chinwendu Peace in a Your Skill Boost Masterclass organisation by the Excellence Foundation for South Sudan on 08th and 09th June 2024 from 1 PM to 3 PM on each day.
This slide is special for master students (MIBS & MIFB) in UUM. Also useful for readers who are interested in the topic of contemporary Islamic banking.
Walmart Business+ and Spark Good for Nonprofits.pdfTechSoup
"Learn about all the ways Walmart supports nonprofit organizations.
You will hear from Liz Willett, the Head of Nonprofits, and hear about what Walmart is doing to help nonprofits, including Walmart Business and Spark Good. Walmart Business+ is a new offer for nonprofits that offers discounts and also streamlines nonprofits order and expense tracking, saving time and money.
The webinar may also give some examples on how nonprofits can best leverage Walmart Business+.
The event will cover the following::
Walmart Business + (https://business.walmart.com/plus) is a new shopping experience for nonprofits, schools, and local business customers that connects an exclusive online shopping experience to stores. Benefits include free delivery and shipping, a 'Spend Analytics” feature, special discounts, deals and tax-exempt shopping.
Special TechSoup offer for a free 180 days membership, and up to $150 in discounts on eligible orders.
Spark Good (walmart.com/sparkgood) is a charitable platform that enables nonprofits to receive donations directly from customers and associates.
Answers about how you can do more with Walmart!"
A workshop hosted by the South African Journal of Science aimed at postgraduate students and early career researchers with little or no experience in writing and publishing journal articles.
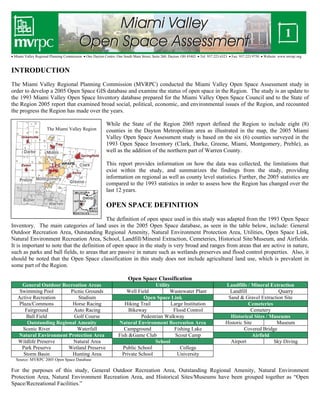
1. • Miami Valley Regional Planning Commission • One Dayton Centre, One South Main Street, Suite 260, Dayton, OH 45402 • Tel: 937.223.6323 • Fax: 937.223.9750 • Website: www.mvrpc.org
INTRODUCTION
The Miami Valley Regional Planning Commission (MVRPC) conducted the Miami Valley Open Space Assessment study in
order to develop a 2005 Open Space GIS database and examine the status of open space in the Region. The study is an update to
the 1993 Miami Valley Open Space Inventory database prepared for the Miami Valley Open Space Council and to the State of
the Region 2005 report that examined broad social, political, economic, and environmental issues of the Region, and recounted
the progress the Region has made over the years.
The Miami Valley Region
While the State of the Region 2005 report defined the Region to include eight (8)
counties in the Dayton Metropolitan area as illustrated in the map, the 2005 Miami
Valley Open Space Assessment study is based on the six (6) counties surveyed in the
1993 Open Space Inventory (Clark, Darke, Greene, Miami, Montgomery, Preble), as
well as the addition of the northern part of Warren County.
This report provides information on how the data was collected, the limitations that
exist within the study, and summarizes the findings from the study, providing
information on regional as well as county level statistics. Further, the 2005 statistics are
compared to the 1993 statistics in order to assess how the Region has changed over the
last 12 years.
OPEN SPACE DEFINITION
The definition of open space used in this study was adapted from the 1993 Open Space
Inventory. The main categories of land uses in the 2005 Open Space database, as seen in the table below, include: General
Outdoor Recreation Area, Outstanding Regional Amenity, Natural Environment Protection Area, Utilities, Open Space Link,
Natural Environment Recreation Area, School, Landfill/Mineral Extraction, Cemeteries, Historical Site/Museum, and Airfields.
It is important to note that the definition of open space in the study is very broad and ranges from areas that are active in nature,
such as parks and ball fields, to areas that are passive in nature such as wetlands preserves and flood control properties. Also, it
should be noted that the Open Space classification in this study does not include agricultural land use, which is prevalent in
some part of the Region.
Open Space Classification
General Outdoor Recreation Areas
Swimming Pool
Picnic Grounds
Active Recreation
Stadium
Plaza/Commons
Horse Racing
Fairground
Auto Racing
Ball Field
Golf Course
Outstanding Regional Amenity
Scenic River
Waterfall
Natural Environment Protection Area
Wildlife Preserve
Natural Area
Park Preserve
Wetland Preserve
Storm Basin
Hunting Area
Utility
Well Field
Wastewater Plant
Open Space Link
Hiking Trail
Large Institution
Bikeway
Flood Control
Pedestrian Walkway
Natural Environment Recreation Area
Campground
Fishing Lake
Fish &Game Club
Scout Camp
School
Public School
College
Private School
University
Landfills / Mineral Extraction
Landfill
Quarry
Sand & Gravel Extraction Site
Cemeteries
Cemetery
Historical Sites / Museums
Historic Site
Museum
Covered Bridge
Airfield
Airport
Sky Diving
Source: MVRPC 2005 Open Space Database
For the purposes of this study, General Outdoor Recreation Area, Outstanding Regional Amenity, Natural Environment
Protection Area, Natural Environment Recreation Area, and Historical Sites/Museums have been grouped together as “Open
Space/Recreational Facilities.”
2. STUDY METHOD
MVRPC staff has been updating the 1993 Open Space Inventory since its original development. However, the updates were
made on an as-needed basis. In 2005, MVRPC initiated a comprehensive update of its Open Space database, at which time the
database was expanded to include northern Warren County.
Early in 2006, MVRPC hosted a one day workshop at its Center
for Regional Cooperation with representatives from local
governments, state agencies, and non-profit special interest groups
in the Region. The purpose of the workshop was to present the
results of the 2005 database update efforts and to seek further
information to finalize it. At the workshop, paper maps and open
space attribute information were made available at each work
station. A total of 62 people, representing 36 organizations, participated in the workshop. Participants were asked not only to
make corrections on the maps but also to provide missing attribute information. The data collected at the workshop were then
incorporated into the MVRPC 2005 Open Space Inventory GIS database.
Although the 2005 Open Space Inventory database is the most comprehensive in the Region, it is important to note that the
database is not completely accurate. This is due to the fact that the data was collected mainly from secondary sources,
supplemented by input from the participating organizations.
FINDINGS
The Miami Valley Region overall possesses 2,268 open space facilities with a total of 116,191.38 acres of open spaces, covering
6% of the total regional land area, averaging 92.7 acres of open space per 1,000 residents in the Region. The Region is also the
home of four State Parks (Buck Creek, John Bryan, Sycamore, and Caesar Creek) which encompass 16,410 acres.
Open Space/Recreational Facility areas account for 64% of all Regional open space acreage with 1,218 sites, followed by
landfills and mineral extraction (10% of acreage with 46 sites). The remaining 26% is divided among the other six open space
types, each comprising less than 10% of all Regional open space acreage.
The Regional map attached provides a spatial distribution of open spaces in the Region by types of open space sites. One of the
Region’s most valuable open space resources is the waterway network, as 28% of the Region’s total open space acreage is
within one quarter mile of a major river and 20% of all natural open space and recreational facilities are within one quarter mile
of a river. There are nearly 400 sites which create open space corridors along the rivers, and are an asset that the Region can
build upon in future open space planning.
Open Space as Percentage of Total Land
Area in the Region
Open Space
6%
116,191 acres
Other 94%
1,717,399
acres
Source: MVRPC 2005 Open Space Database
Open Space by Type in the Region
Open Space/Rec.
64%
74,798 acres
Schools
8%
8,838 acres
Cemeteries
3%
3,444 acres
Utilities
6%
7,036 acres
Open Space Links Airfields
5%
4%
6,373 acres
4,615 acres
Landfills & Mineral
Extraction 10%
11,087 acres
Source: MVRPC 2005 Open Space Database
2
3. A comparison of the data collected in 1993 and 2005 revealed that there was an increase of over 15,000 acres of open space, an
18.7% increase in the Region over the 12-year span. As illustrated in the table below, there was nearly a 50% increase in Open
Space links (49.2%) and over a 40% increase in areas dedicated to Utilities (41.3%).
Open Space Comparison: 1993 - 2005
1993
2005*
Change
Open
Space/Rec
53,726.4
61,825.5
15.1%
Schools
7,412.1
7,876.0
6.3%
Landfills &
Mining
7,791.4
10,757.6
38.1%
Utilities
4,540.1
6,415.2
41.3%
Open Space
Links
2,690.8
4,014.6
49.2%
Airfields
5542.3
6,074.0
9.6%
Regional
Total
81,703.1
96,962.9
18.7%
Note: *Cemeteries and Warren County data are excluded since they were not part of the 1993 Open Space Inventory database.
Source: MVRPC 1993 and 2005 Open Space Database
The next two tables present open space acreage and number of sites by facility type at the County level. Montgomery County
leads the region in both total open space facilities (851) and acreage (37,924.08), followed by Greene and Miami counties. Also,
the additional maps attached illustrate open space locations by facility types at the County level.
Open Space by County: Acreage by Type of Facilities
County
Clark
Darke
Greene
Miami
Montgomery
Preble
Warren*
REGION
Open
Space/Rec
8,651.1
2,801.9
11,518.4
7,357.0
22,895.4
8,601.7
12,972.8
74,798.2
Schools
Utilities
1,264.3
291.8
2,116.6
823.5
3,136.6
243.2
961.6
8,837.5
1,211.7
455.2
1,465.1
423.1
2,496.9
363.3
621.0
7,036.2
Landfills &
Mining
740.9
805.1
6,770.2
0
2,051.0
390.4
329.5
11,087.2
Open Space
Links
505.2
482.5
338.2
535.2
1,997.1
156.5
600.5
4,615.1
Airfields
1,501.0
133.3
138.4
53.6
4,247.8
0
298.8
6,372.8
Cemeteries
Total
468.6
302.8
281.7
665.1
1,099.3
330.7
296.4
3,444.5
14,342.7
5,272.5
22,628.6
9,857.4
37,924.1
10,085.8
16,080.4
116,191.4
Cemeteries
Total
8
98
41
65
70
59
23
364
153
214
375
307
851
181
171
2,268
Source: MVRPC 2005 Open Space Database
Open Space by County: Number of Sites by Type of Facilities
County
Clark
Darke
Greene
Miami
Montgomery
Preble
Warren*
REGION
Open
Space/Rec
75
71
228
171
509
78
86
1,218
Schools
Utilities
52
24
48
49
181
13
24
391
8
13
25
15
27
14
8
110
Landfills &
Mining
3
4
21
0
13
1
4
46
Open Space
Links
6
3
15
9
50
16
24
123
Airfields
3
1
2
1
6
0
3
16
Source: MVRPC 2005 Open Space Database
Open Space per 1,000 Persons
250
230.4
192.3
200
151.1
Acreage
The chart on the right illustrates the 2005 open space acreage
per 1,000 persons by county. Despite the fact that
Montgomery County has significant open space acreage in
comparison to other counties, it was found to have the least
amount of open space acreage per 1,000 persons (65.9).
Preble County, on the other hand, was found to have the
highest amount of open space acreage per 1,000 persons
(230.4), followed by Warren County (192.3), which owes its
high acreage per 1,000 persons to the fact that Caesar Creek
State Park lies within the portion surveyed.
150
95.9
100
93.0
93.2
92.68
65.9
50
0
ark
Cl
e
rk
Da
n
ee
Gr
e
i
ery
i am
om
M
nt g
o
M
le
eb
Pr
en
arr
W
n
gio
Re
*Note: Data findings for Warren County are only from the northern part of the county
Source: MVRPC 2005 Open Space Database
3
4. The table below shows the change in open space acreage and number of facilities over the 12 year period. Miami County had the
largest percent change in acreage (42%), while Montgomery County had the highest percent change in number of sites (36.8%).
Despite the fact that Clark County had a decrease in number of sites, it also had a 4.6% increase in acreage, due to growth of
existing sites.
Open Space Comparison: 1993 - 2005 by County
County
Clark
Darke
Greene
Miami
Montgomery
Preble
REGION
1993
13,260.9
4,036.0
20,862.4
6,474.3
29,411.9
7,657.6
81,703.1
Open Space Acreage
2005
13,874.2
4,969.7
22,346.8
9,192.3
36,824.8
9,755.1
96,962.9
% Change
4.6
23.1
7.1
42.0
25.2
27.4
18.7
Open Space Sites
2005
145
116
334
242
881
122
1,888
1993
169
113
280
207
644
96
1,509
% Change
-14.2
2.7
19.3
16.9
36.8
27.1
25.1
Note: *Cemeteries and Warren County data are excluded since they were not part of the 1993 Open Space Inventory database.
Source: MVRPC 1993 and 2005 Open Space Databases.
Change in Agricultural Acreage: 1993-2005
The change in open space over the last 12 years need to be
reviewed in comparison to the agricultural land change since
recent development has been occurring outside the existing
urban areas in rural areas.
SUMMARY AND CONCLUSION
357
1993
333
350
2005
300
Acres
(in thousands)
Between 1993 and 2005, as shown on the chart, each county lost
significant amounts of agricultural land. The findings of net gain
in open space seem to be closely related to the urbanization of
agricultural land as certain portions of development become
designated as new open spaces. Since agricultural land use was
not included in the open space definition, the findings from this
study require careful attention from the perspective of the larger
land use context, considering prevalent land use types for each
county.
400
215
250
200
190
200
171
166
218
186
197
140
117
150
124
103
100
50
0
Cla
rk
rk e
Da
Gr
e
een
i
am
e ry
Mi
go m
o nt
M
bl e
Pre
Wa
n
r re
Source: U.S. Department of Agriculture
The Miami Valley Open Space Assessment study revealed that there has been an overall growing network of open spaces
throughout the Region for all open space categories over the last 12 years. Not only does total acreage appear to have increased,
but acreage per capita also appears to have increased significantly as well. Continuous efforts should be made to preserve
existing open spaces in the Region so that these valuable community assets are maintained as the Region progresses into the
future.
FOR MORE INFORMATION
Please visit www.mvrpc.org for a copy of this report. Questions or comments should be directed to Matthew Martin at
mmartin@mvrpc.org.
Miami Valley Regional Planning Commission (MVRPC) is a voluntary association of governmental and non-governmental
organizations serving as a forum and resource where regional partners identify priorities, develop public policy, and implement
strategies to improve the quality of life and economic vitality throughout the Miami Valley Region.
4
5. Open Space Classification
Open Space/Rec (1,218 sites)
Landfills/Mineral Extraction (46 sites)
Utilities (110 sites)
Cemeteries (364 sites)
Open Space Links (123 sites)
Airfields (16 sites)
Miami
8%,
9,857 acres
Open Space as Percentage
of Total Land Area in the Region
Other Land Use
94%
116,191 acres
MIAMI
Clark
12%,
14,343 acres
Preble
9%,
10,086 acres
Warren
14%,
16,080 acres
Open Space by Type
in the Region
Cemeteries
3%, 3,444
Landfills &
acres
Airfields 5%,
Mineral
Open Space 6,373 acres
Extraction
Links 4%,
10%, 11,087
4,615 acres
acres
Troy
Schools 8%,
8,838 acres
Utilities 6%,
7,036 acres
CLARK
Springfield
Vandalia
Englewood
PREBLE
Huber Heights
Dayton
Eaton
MONTGOMERY
Kettering
Trotwood
Xenia
GREENE
Riverside
Map 1 - 2005 Miami Valley
Open Spaces
Regional
Open Space
6%
1,717,399 acres
DARKE
Darke
5%,
5,273 acres
Open
Space/Rec.
64%, 74,798
acres
Piqua
Greenville
Montgomery
33%,
37,924 acres
Greene
19%,
22,629 acres
Schools (391 sites)
Source: MVRPC 2005 Open Space Inventory
Date: November 2006
Distribution of
Open Space by County
Dayton
WARREN
Moraine
0
5
Miles
10
West Carrollton
Kettering
Miami Valley
Regional Planning Commission
One Dayton Centre
One South Main Street Suite 260
Dayton, OH 45402
Phone - (937) 223 - 6323
Fax - (937) 223 - 9750
Web - www.mvrpc.org
6. Open Space by Type
in the County
Open Space as Percentage
of Total Land Area in the County
Open Space Acres
per 1,000 Persons
Open
Space/Rec.
61%, 8,651
acres
Other 94%
242,544
acres
250
230.4
192.3
200
Cemeteries
3%, 469
acres
Open Space
6%
14,343 acres
Open Space
Links 4%,
505 acres
Schools
9%, 1,264
acres
Airfields
10%, 1,501
acres
Landfills &
Mineral
Extraction
5%, 741
acres
95.9
93.0
93.2
100
65.9
50
Utilities
8%, 1,212
acres
0
C la
rk
rk e
Da
Gr
ee n
e
Mi
i
am
Mo
e ry
om
nt g
Pr e
bl e
Wa
n
rre
Map 2 - 2005 Clark County
Open Spaces
New Carlisle
Country Club
Acreage
151.1
150
Buck Creek State Park
Clark Lake Wildlife Area
New Carlisle
Springfield
New Reid Memorial Park
70
§
¦
¨
Dayton Wellfield
Spring Run Trout Farm
Enon
Oh Agriculture Research and Dev Center
American Aggregates Sand and Gravel
Springfield-Beckley
Municipal Airport
Open Space Classification
Open Space/Rec (75 sites)
Utilities (8 sites)
Open Space Links (6 sites)
Schools (52 sites)
Landfills/Mineral Extraction (3 sites)
Cemeteries (8 sites)
Airfields (3 sites)
Source: MVRPC 2005 Open Space Inventory
Date: November 2006
Locust Hills Golf Course
County Locator Map
Miles
0
1
2
Miami Valley
Regional Planning Commission
One Dayton Centre
One South Main Street Suite 260
Dayton, OH 45402
Phone - (937) 223 - 6323
Fax - (937) 223 - 9750
Web - www.mvrpc.org
7. Other
99%
378,554
acres
Open Space as Percentage
of Total Land Area in the County
Open Space Classification
Open Space/Rec (71 sites)
Open Space by Type
in the County
Utilities (13 sites)
Open Space Links (3 sites)
Open
Space/Rec.
52%, 2,802
acres
Needmore Woods
Schools (24 sites)
Landfills/Mineral Extraction (4 sites)
Cemeteries (98 sites)
Airfields (1 site)
Schools 6%,
292 acres
Cemeteries
6%, 303
acres
Open Space
Links 9%,
482 acres
Landfills &
Mineral
Extraction
15%, 805
acres
Airfields 3%,
133 acres
Source: MVRPC 2005 Open Space Inventory
Date: November 2006
Utilities 9%,
455 acres
Greenville
Darke County
Wildlife Area
County Locator Map
Open Space Acres
per 1,000 Persons
250
230.4
192.3
200
American Aggregates Wayne Lakes
Map 3 - 2005 Darke County
Open Spaces
Open Space
1%
5,272 acres
Acreage
151.1
150
95.9
100
93.0
93.2
65.9
50
0
r
C la
k
rk e
Da
G
n
ree
e
am
Mi
i
Mo
e ry
om
nt g
bl e
Pr e
W
en
a rr
Beachwood
Golf Course
Miles
0
1
2
Miami Valley
Regional Planning Commission
One Dayton Centre
One South Main Street Suite 260
Dayton, OH 45402
Phone - (937) 223 - 6323
Fax - (937) 223 - 9750
Web - www.mvrpc.org
8. Open Space Classification
Open Space as Percentage
of Total Land Area in the County
Other
91%
243,560
acres
County Locator Map
Open Space/Rec (228 sites)
Utilities (25 sites)
Open Space Links (15 sites)
Open Space
9% 22,629
acres
Schools (48 sites)
Landfills/Mineral Extraction (21 sites)
Cemeteries (41 sites)
Open Space by Type
in the County
Open
Space/Rec.
53%, 11,518
acres
John Bryan State Park
Wright State University
Glen Helen
CEMEX Property
Cemeteries
1%, 282
acres
Schools
9%, 2,117
acres
Open Space
Links 1%,
338 acres
Landfills &
Mineral
Extraction
30%, 6,770
acres
Airfields
1%, 138
acres
§
¦
¨
675
Cedarville
Utilities 6%,
1,465 acres
Beavercreek
Open Space Acres
Per 1,000 Persons
250
Source: MVRPC 2005 Open Space Inventory
Date: November 2006
Yellow Springs
Fairborn
Valley Spring Wellfield
Xenia
230.4
192.3
200
Jamestown
Acreage
151.1
150
95.9
100
Bellbrook
93.0
93.2
65.9
50
Map 4 - 2005 Greene County
Open Spaces
Airfields (2 sites)
Sugarcreek Metropark
0
C la
rk
rk e
Da
Gr
ee n
e
Mi
i
am
o
nt g
Mo
ry
me
Pr e
bl e
Wa
n
r re
Spring Valley Wildlife Area
§
¦
¨
71
Miles
0
1
2
Miami Valley
Regional Planning Commission
One Dayton Centre
One South Main Street Suite 260
Dayton, OH 45402
Phone - (937) 223 - 6323
Fax - (937) 223 - 9750
Web - www.mvrpc.org
9. Piqua Country Club Inc.
Open Space Classification
Open Space/Rec (171 sites)
County Locator Map
Stillwater Prairie Reserve
Utilities (15 sites)
Piqua
Open Space Links (9 sites)
Schools (49 sites)
Landfills/Mineral Extraction (0 sites)
Big Woods Reserve
Cemeteries (65 sites)
Map 5 - 2005 Miami County
Open Spaces
Airfields (1 site)
Source: MVRPC 2005 Open Space Inventory
Date: November 2006
75
§
¦
¨
Open Space Acres
per 1,000 Persons
250
230.4
192.3
200
Troy
Acreage
151.1
150
Lost Creek-Knoop Farm
95.9
100
93.0
93.2
65.9
50
0
C la
rk
rk e
Da
Gr
ee n
e
Mi
i
am
o
nt g
Mo
ry
me
bl e
Pre
Wa
n
rr e
Tipp City
West Milton
Open Space by Type
in the County
Cliffside Golf Course
Open
Space/Rec.
75%, 7,357
acres
Cemeteries
7%,
665 acres
Open Space
Links 5%,
535 acres
Schools
8%,
824 acres
Airfields 1%,
54 acres
Utilities
4%,
423 acres
Other
96%
252,424
acres
Sullivan Road Farm
Open Space Acreage as Percentage
of Total Land Area in the County
Miles
Open Space
4%
9,857 acres
0
1
2
Miami Valley
Regional Planning Commission
One Dayton Centre
One South Main Street Suite 260
Dayton, OH 45402
Phone - (937) 223 - 6323
Fax - (937) 223 - 9750
Web - www.mvrpc.org
10. Open Space as Percentage
of Total Land Area in the County
Other
87%
259,298
acres
Union
Dayton International
Airport
Englewood Metropark/
Aullwood Garden
Clayton
Taylorsville
Metropark
Englewood
Carriage Hill
Metropark
70
§
¦
¨
Huber Heights
Brookville
75
§
¨
¦
Open Space by Type
in the County
Sycamore State Park
Trotwood
Rorhers Island/
Mad River Well Field
Open
Space/Rec.
61%,
22,895 acres
Riverside
County Locator Map
Dayton
Cemeteries
3%,
1,099 acres
Schools 8%,
3,137 acres
Open Space
Links 5%,
1,997 acres
Airfields
11%,
4,248 acres
Landfills &
Mineral
Extraction
5%,
2,051 acres
Utilities 7%,
2,497 acres
Oakwood
Possum Creek
Metro Park
Moraine
Kettering
West Carrollton
Open Space Acres
per 1,000 Persons
250
New Lebanon
230.4
Open Space Classification
192.3
200
§
¦
¨
Germantown Metropark
675
Acreage
151.1
Germantown
150
95.9
100
Open Space/Rec (509 sites)
Centerville
Miamisburg
93.0
93.2
Utilities (27 sites)
Map 6 - 2005 Montgomery County
Open Spaces
Open Space
13% 37,924
acres
Vandalia
Open Space Links (50 sites)
65.9
Schools (181 sites)
50
Dayton Wright Brothers
Airport
0
C la
rk
rk e
Da
Gr
ee n
e
Mi
i
am
o
nt g
Mo
ry
me
Pr e
bl e
Wa
Landfills/Mineral Extraction (13 sites)
Cemeteries (70 sites)
n
r re
Airfields (6 sites)
Miles
0
1
2
Source: MVRPC 2005 Open Space Inventory
Date: November 2006
Miami Valley
Regional Planning Commission
One Dayton Centre
One South Main Street Suite 260
Dayton, OH 45402
Phone - (937) 223 - 6323
Fax - (937) 223 - 9750
Web - www.mvrpc.org
11. Open Space as Percentage
of Total Land Area in the County
Other
96%
262,836
acres
Open Space
4%
10,086 acres
70
§
¦
¨
Open Space/Rec (78 sites)
Eaton - Bantas Fork
Well Field
Open Space by Type
in the County
Utilities (14 sites)
Open Space Links (16 sites)
Schools (13 sites)
Landfills/Mineral Extraction (1 site)
Open
Space/Rec.
85%, 8,602
acres
Eaton
Cemeteries (59 sites)
Airfields (0 sites)
Source: MVRPC 2005 Open Space Inventory
Date: November 2006
Cemeteries
3%, 331
acres
Open Space
Links 2%,
157 acres
Schools
2%, 243
acres
Landfills &
Mineral
Extraction
4%, 390
acres
Utilities 4%,
363 acres
County Locator Map
Preble County Landfill
Woodland Trails Boy Scout Camp
Open Space Acres
per 1,000 Persons
250
Map 7 - Preble County
Open Spaces
Open Space Classification
230.4
192.3
200
Acreage
151.1
150
95.9
100
93.0
93.2
65.9
Rush Run Wildlife Area
50
Hueston Woods State Park
0
C la
rk
rk e
Da
Gr
ee n
e
Mi
i
am
M
ry
me
t go
on
Pr e
bl e
Wa
n
r re
Miles
0
1
2
Miami Valley
Regional Planning Commission
One Dayton Centre
One South Main Street Suite 260
Dayton, OH 45402
Phone - (937) 223 - 6323
Fax - (937) 223 - 9750
Web - www.mvrpc.org
12. Open Space as Percentage
of Total Land Area in the County
Open Space Acres
per 1,000 Persons
Open
Space/Rec.
80%,
12,973
acres
Open Space
17% 16,080
acres
250
192.3
151.1
Cemeteries
2%, 296
acres
Open Space
Links
4%, 600
acres
230.4
200
Airfields
2%, 299
acres
Landfills &
Mineral
Extraction
2%, 330
acres
Schools
6%, 962
acres
Utilities
4%, 621
acres
Acreage
Other
83% 78,180
acres
Open Space by Type
in the County
150
95.9
93.0
93.2
100
65.9
50
0
Cla
rk
rk e
Da
Gr
ee n
e
Mi
i
am
o
nt g
Mo
ry
me
Pr e
bl e
Wa
n*
rre
*Only the population of the jurisdictions within the region
Carlisle
Springboro
Franklin Well Field
Franklin
MCD Property
75
§
¦
¨
Camp Stoneybrook
Waynesville
Caesar Creek State Park
Clearcreek Gorge Nature Preserve
Map 8 - Warren County
Open Spaces
Twin Creek Metro Park
Open Space Classification
Open Space/Rec (86 sites)
Utilities (8 sites)
71
§
¦
¨
County Locator Map
Open Space Links (24 sites)
Schools (24 sites)
Landfills/Mineral Extraction (4 sites)
Cemeteries (23 sites)
Airfields (3 sites)
Source: MVRPC 2005 Open Space Inventory
Date: November 2006
Miles
0
1
2
Miami Valley
Regional Planning Commission
One Dayton Centre
One South Main Street Suite 260
Dayton, OH 45402
Phone - (937) 223 - 6323
Fax - (937) 223 - 9750
Web - www.mvrpc.org