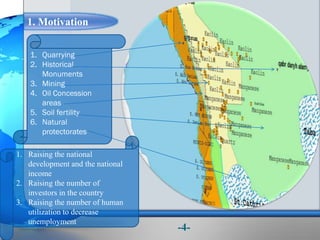
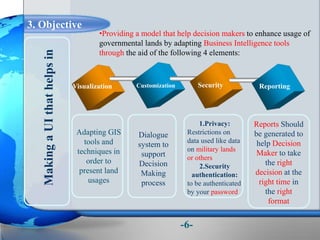
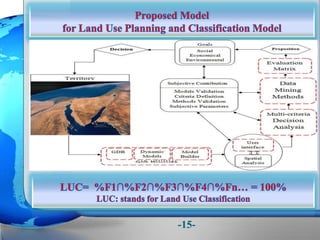
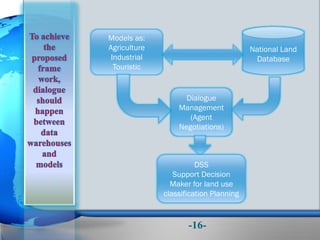
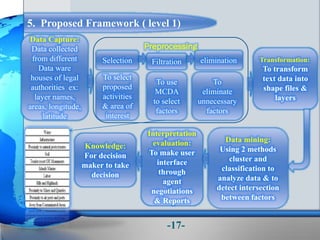
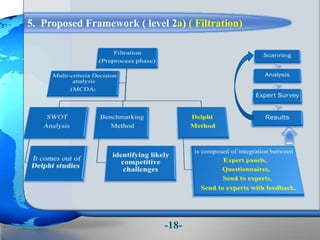
Using BI for deciding and planning the
best usage for governmental lands
Submitted By
Bassant Nabil Mohamed Abass
Agenda
Agenda Motivation
Objectives
Problem Statement
Related Works
Proposed Framework for land usages
 BI Land Use Planning and Classification Model
(BILUPC Model)
Case Study
Conclusion
Future Work
Publication
-2-
3
(ِ َّ‫اّلل‬ َ‫ت‬َ‫م‬ْ‫ع‬ِ‫ن‬ ‫وا‬ُ‫ر‬ُ‫ك‬ْ‫ذ‬‫ا‬ ُ‫اس‬َّ‫ن‬‫ال‬ ‫ا‬َ‫ه‬ُّ‫ي‬َ‫أ‬ ‫ا‬َ‫ي‬‫َا‬‫خ‬ ْ‫ن‬ِ‫م‬ ْ‫ل‬َ‫ه‬ ْ‫م‬ُ‫ك‬ْ‫ي‬َ‫ل‬َ‫ع‬ٍ‫ق‬ِ‫ل‬
ِ‫اء‬َ‫م‬َّ‫س‬‫ال‬ َ‫ن‬ِ‫م‬ ْ‫م‬ُ‫ك‬ُ‫ق‬ُ‫ز‬ ْ‫ر‬َ‫ي‬ ِ َّ‫اّلل‬ ُ‫ْر‬‫ي‬َ‫غ‬َ‫و‬ُ‫ه‬ َّ‫ال‬ِ‫إ‬ َ‫ه‬َ‫ل‬ِ‫إ‬ ‫ال‬ ِ‫ض‬ ْ‫ر‬َ ْ‫اْل‬ َ‫و‬
َ‫ون‬ُ‫ك‬َ‫ف‬ْ‫ؤ‬ُ‫ت‬ ‫ى‬َّ‫ن‬َ‫أ‬َ‫ف‬)
‫فاطر‬(‫اآليه‬3)
1. Motivation
1. Quarrying
2. Historical
Monuments
3. Mining
4. Oil Concession
areas
5. Soil fertility
6. Natural
protectorates
1. Raising the national
development and the national
income
2. Raising the number of
investors in the country
3. Raising the number of human
utilization to decrease
unemployment
-4-
2. Problem Statement
•No existence for a model that can help decision maker
in planning and deciding the best usages in governmental
lands, nothing exist to say how to utilize the
governmental resources the best utilization.
-5-
3. Objective
Visualization Customization Security
Adapting GIS
tools and
techniques in
order to
present land
usages
Dialogue
system to
support
Decision
Making
process
1.Privacy:
Restrictions on
data used like data
on military lands
or others
2.Security
authentication:
to be authenticated
by your password
MakingaUIthathelpsin
Reporting
Reports Should
be generated to
help Decision
Maker to take
the right
decision at the
right time in
the right
format
-6-
•Providing a model that help decision makers to enhance usage of
governmental lands by adapting Business Intelligence tools
through the aid of the following 4 elements:
-7-
1. Layers
2. Shape
files
3. Attributes
4. Maps
Data warehouse
from different
repositories
(National land
Database)
-8-
• Using GIS and outranking multi criteria analysis for
land-use suitability assessment (England)1
• An integrated GIS-based analysis system (IGAS) for
supporting land-use management of lake areas in urban
fringes ( China)
2
• Evaluation of soil erosion risk using Analytic Network
Process and GIS: A case study from Spanish mountain olive
plantations (Spain)
3
Related
Works
Provides
good
visualization
for data
-9-
-10-
This model Used Multi-criteria decision analysis for
choosing best alternatives through factors that helps in
building airports
-11-
•The urban lake areas of China, are
ideal locations for
recreational activities and the
maintenance of ecological diversity.
AHP: Analytical hierarchy process
Procedures of GIS-based land-use suitability
assessment
•GDP = GDPI + GDPA + GDPSI
1. Agricultural GDP:
GDPA(t) = GDPA(t − dt) + GDPA GRA dt
2. Industrial GDP
3. Service Industries
MCDA
AHP
-12-
•The risk of soil erosion was evaluated
in olive groves in Southern Spain,
•showing the potential of the ANP
method (Analytic Network Process
method) for modeling a complex
physical process like
soil erosion.
•showing usage of Multi-criteria
decision analysis.
•Thus, soil erosion risk = 0.1986
+0.0428 + 0.0399 +0.027+0.0318 =
0.3401
-13-
-14-
-15-
Models as:
Agriculture
Industrial
Touristic
National Land
Database
Dialogue
Management
(Agent
Negotiations)
DSS
Support Decision
Maker for land use
classification Planning
-16-
5. Proposed Framework ( level 1)
Data Capture:
Data collected
from different
Data ware
houses of legal
authorities ex:
layer names,
areas, longitude,
latitude
Preprocessing
Selection Filtration elimination
To select
proposed
activities
& area of
interest
To use
MCDA
to select
factors
To
eliminate
unnecessary
factors
Transformation:
To transform
text data into
shape files &
layers
Data mining:
Using 2 methods
cluster and
classification to
analyze data & to
detect intersection
between factors
Interpretation
evaluation:
To make user
interface
through
agent
negotiations
& Reports
Knowledge:
For decision
maker to take
decision
-17-
5. Proposed Framework ( level 2a) ( Filtration)
-18-
5. Proposed Framework ( level 2b) ( Data mining)
Two methods
used
Clustering
To integrate each
similar factors in
one cluster
Classification
To measure degree
of importance to
each factor in each
cluster
-19-
5. Proposed Framework ( level 2b) ( Data mining) cont…
Clustering Classification
Determine
objectives on the
map + determining
intersection
between layers or
degree of
potentialities
-20-
But it will be one of two phases implemented
to support decision maker in planning
and deciding the best usage of the
governmental lands
-21-
1. Water
2. Infrastructure
3. Proximity to
Natural
Protectorates
4. Soil
5. Tourist Resorts or
monuments
6. Island Marine
7. Labor
8. Hills and highlands
9. Proximity to mines
and quarries
10. Proximity to air
ports & ports
11. Away from
contaminated areas
water
Infrastructure
Natural protectorates
Soil
Tourist resorts
Island Marine
-22-
-23-
Constituents of useRegion Properties
1. Water
2. Infrastructure
3. Proximity to
Natural
Protectorates
4. Soil
5. Tourist Resorts or
monuments
6. Island Marine
7. Labor
8. Hills and highlands
9. Proximity to mines
and quarries
10. Proximity to air
ports & ports
11. Away from
contaminated areas
If Agricultural
Make a
cluster
that
contains
• Through equation
resulted from the new
model 3 factors were
achieved which are;
Water ∩ Soil ∩ Labor
-24-
Constituents of useRegion Properties
1.Water
2.Infrastructure
3.Proximity to Natural
Protectorates
4.Soil
5.Tourist Resorts or
monuments
6.Island Marine
7.Labor
8.Hills and highlands
9.Proximity to mines
and quarries
10.Proximity to air
ports & ports
11.Away from
contaminated areas
Make a
cluster
that
contains
• Through equation
resulted from the
new model 4factors
were achieved
which are;
Tourist resort∩
Island marine ∩
proximity to air port
∩ Away from
contaminations
Tourism
-25-
Using Classification method in Data mining to
classify each factor according to its degree of
importance that leads to best utilization and
best usage for governmental lands
50%
1%2%
30%
1%
1%
10%
1%
2%
1%
1%
Water Infrastructure
Proximity to natural protectorates Soil
Tourist resort OR Monuments Islands Marine
Labor Hills and Highlands
Proximity to Mines and Quarries Proximity to air ports and por
Away from Contaminated Areas
Agriculture
-26-
Factors
Proximity to Mines & Quarries
Proximity to Settlements-Labor
Terrain
Island Marines
Tourist Resorts or Moments
Soils
Proximity to natural protectorates
Infrastructure
Water
Total
Proximity to Transportation
Uses Agriculture
(%)
50
1
2
30
1
1
2
10
2
1
100
-27-
Using Classification method in Data mining to
classify each factor according to its degree of
importance that leads to best utilization and
best usage for governmental lands
The most important factors are:
The greatest values
According
to
equation
F2
F1
F3
Water 50%
Soil 30%
Labor 10%
Hills & High lands 1%
Island Marine 1%
Proximity to mines 2%
Proximity to airports 1%
Away from contaminated areas 1%
Infrastructure 1%
Natural protectorates 2%
Monuments 1%
So, Small Percentages
doesn’t affect
-28-
Working Environment:
-30-
1. Topographic Data: Egyptian Survey Authority,
Military Survey Authority
2. Climatic Data: Egyptian Climate Authority
3. Soil Data: Research institute of ground water and
soil (‫واالراضى‬ ‫الجوفيه‬ ‫المياة‬ ‫لبحوث‬ ‫القومى‬ ‫)المعهد‬
4. Geologic and mining Data: Egyptian geological
survey
5. Environmental data: Egyptian environmental affairs
6. Agricultural Data: agricultural research institute
7. Touristic Data: tourism development authority
8. Industrial Data: industrial development authority
1. Data Resources:
-31-
2. Data Maps:
-32-
Factors
Proximity to Mines & Quarries
Proximity to Settlements-Labor
Terrain (Hills and highlands)
Island Marines
Tourist Resorts or Moments
Soils
Proximity to natural protectorates
Infrastructure
Water
Total
Proximity to Transportation
Uses Agriculture
(%)
60
-
-
30
-
-
-
10
-
-
100
Data Classification
-33-
Factors
Proximity to Mines & Quarries
Proximity to Settlements-Labor
Terrain (Hills and highlands)
Island Marines
Tourist Resorts or Moments
Soils
Proximity to natural protectorates
Infrastructure
Water
Total
Proximity to Transportation
Uses Agriculture
(%)
60
-
-
30
-
-
-
10
-
-
100
Industry
(%)
-
30
-
-
-
-
-
10
60
-
100
Data Classification
-34-
Factors
Proximity to Mines & Quarries
Proximity to Settlements-Labor
Terrain (Hills and highlands)
Island Marines
Tourist Resorts or Moments
Soils
Proximity to natural protectorates
Infrastructure
Water
Total
Proximity to Transportation
Uses Agriculture
(%)
60
-
-
30
-
-
-
10
-
-
100
Industry
(%)
-
30
-
-
-
-
-
10
60
-
100
Tourism
(%)
-
-
-
-
50
10
10
10
--
20
100
Data Classification
-35-
Factors
Proximity to Mines & Quarries
Proximity to Settlements-Labor
Terrain (Hills and highlands)
Island Marines
Tourist Resorts or Moments
Soils
Proximity to natural protectorates
Infrastructure
Water
Total
Proximity to Transportation
Uses Agriculture
(%)
60
-
-
30
-
-
-
10
-
-
100
Industry
(%)
-
30
-
-
-
-
-
10
60
-
100
Tourism
(%)
-
-
-
-
50
10
10
10
--
20
100
Housing
(%)
-
40
-
10
-
-
10
10
-
30
100
Data Classification
-36-
Data about layers (name, areas, longitude, latitude)
Agricultural Capability
-37-
Data about layers (name, areas, longitude, latitude)
Agricultural Capability (cont…)
-38-
Data about layers (name, areas, longitude, latitude)
Extractive industries Capability
-39-
Data about layers (name, areas, longitude, latitude)
Tourism Capability
-40-
Soil Fertility- Land
productivity
From 1- 5
-41-
-42-
-43-
-44-
-45-
In Order to use
this UI control
you have to be
authorized
Authentication security:
-46-
Detecting Overlap
•Now we have to convert all matrix values into zeros
and ones for normalization as follows:
-47-
Using analysis tools to detect intersections between factors and
layers
Detecting Overlap cont…
-48-
Detecting Overlap cont…
-49-
•Tourism Potentialities
• Mining quarrying
Potentialities
•Tourism Potentialities
• Mining Potentialities
•Solar energy potentialities
Overlapping Map
-50-
Overlapping Map
-51-
Overlapping Map
-52-
Report To
Help
Decision
Maker In
Taking
Decisions
-53-
Performance Evaluation :
Features England model New Vision
Using geo-database 1 1
Using dynamic model 1 1
Using model builder 0 1
Using spatial analysis 1 1
Using Multi-criteria decision analysis 1 1
Using clustering method 0 1
Using classification method 0 1
Using evaluation matrix 1 1
Social, economical, environmental goals 1 1
Showing best utilization for overlapping 0 1
Dynamic reports 0 1
-54-
Performance Evaluation :
Features China model New Vision
Using geo-database 1 1
Using dynamic model 0 1
Using model builder 0 1
Using spatial analysis 0 1
Using Multi-criteria decision analysis 1 1
Using clustering method 0 1
Using classification method 0 1
Applying Analytical hierarchy process 1 1
Using evaluation matrix 0 1
Economical goals 1 1
Social, environmental goals 0 1
Showing best utilization for overlapping 0 1
Dynamic reports 0 1
-55-
Performance Evaluation :
Features Spain model New Vision
Using geo-database 1 1
Using dynamic model 0 1
Using model builder 0 1
Using spatial analysis 0 1
Using Multi-criteria decision analysis 1 1
Using clustering method 0 1
Using classification method 0 1
Analytical Network Process 1 0
Using evaluation matrix 0 1
Economical goals 1 1
Social, environmental goals 0 1
Showing best utilization for overlapping 0 1
Dynamic reports 0 1
-56-
Conclusion:
-57-
1. Utilize Governmental resources with the best utilization
2. Applying automatic Reports about used areas and unused areas to help
the decision maker to decide and plan for the best usage of the
governmental land
3. Applying password to prevent governmental data from misusages
4. By using the Business Intelligent Land use Classification Planning
model, any piece of land could be classified according to its utilization,
by understanding its factors to collect the dataset elements, and then put
this data in the geo-database to reach the optimal utilization result by
applying the mathematical equation that runs through the dot net
application behind the arc-GIS tool.
Future Work: Land usages Future Challenges
-58-
-59-

Using BI for deciding and planning the best usage for governmental lands

  • 1.
    Using BI fordeciding and planning the best usage for governmental lands Submitted By Bassant Nabil Mohamed Abass
  • 2.
    Agenda Agenda Motivation Objectives Problem Statement RelatedWorks Proposed Framework for land usages  BI Land Use Planning and Classification Model (BILUPC Model) Case Study Conclusion Future Work Publication -2-
  • 3.
    3 (ِ َّ‫اّلل‬ َ‫ت‬َ‫م‬ْ‫ع‬ِ‫ن‬‫وا‬ُ‫ر‬ُ‫ك‬ْ‫ذ‬‫ا‬ ُ‫اس‬َّ‫ن‬‫ال‬ ‫ا‬َ‫ه‬ُّ‫ي‬َ‫أ‬ ‫ا‬َ‫ي‬‫َا‬‫خ‬ ْ‫ن‬ِ‫م‬ ْ‫ل‬َ‫ه‬ ْ‫م‬ُ‫ك‬ْ‫ي‬َ‫ل‬َ‫ع‬ٍ‫ق‬ِ‫ل‬ ِ‫اء‬َ‫م‬َّ‫س‬‫ال‬ َ‫ن‬ِ‫م‬ ْ‫م‬ُ‫ك‬ُ‫ق‬ُ‫ز‬ ْ‫ر‬َ‫ي‬ ِ َّ‫اّلل‬ ُ‫ْر‬‫ي‬َ‫غ‬َ‫و‬ُ‫ه‬ َّ‫ال‬ِ‫إ‬ َ‫ه‬َ‫ل‬ِ‫إ‬ ‫ال‬ ِ‫ض‬ ْ‫ر‬َ ْ‫اْل‬ َ‫و‬ َ‫ون‬ُ‫ك‬َ‫ف‬ْ‫ؤ‬ُ‫ت‬ ‫ى‬َّ‫ن‬َ‫أ‬َ‫ف‬) ‫فاطر‬(‫اآليه‬3)
  • 4.
    1. Motivation 1. Quarrying 2.Historical Monuments 3. Mining 4. Oil Concession areas 5. Soil fertility 6. Natural protectorates 1. Raising the national development and the national income 2. Raising the number of investors in the country 3. Raising the number of human utilization to decrease unemployment -4-
  • 5.
    2. Problem Statement •Noexistence for a model that can help decision maker in planning and deciding the best usages in governmental lands, nothing exist to say how to utilize the governmental resources the best utilization. -5-
  • 6.
    3. Objective Visualization CustomizationSecurity Adapting GIS tools and techniques in order to present land usages Dialogue system to support Decision Making process 1.Privacy: Restrictions on data used like data on military lands or others 2.Security authentication: to be authenticated by your password MakingaUIthathelpsin Reporting Reports Should be generated to help Decision Maker to take the right decision at the right time in the right format -6- •Providing a model that help decision makers to enhance usage of governmental lands by adapting Business Intelligence tools through the aid of the following 4 elements:
  • 7.
  • 8.
  • 9.
    • Using GISand outranking multi criteria analysis for land-use suitability assessment (England)1 • An integrated GIS-based analysis system (IGAS) for supporting land-use management of lake areas in urban fringes ( China) 2 • Evaluation of soil erosion risk using Analytic Network Process and GIS: A case study from Spanish mountain olive plantations (Spain) 3 Related Works Provides good visualization for data -9-
  • 10.
  • 11.
    This model UsedMulti-criteria decision analysis for choosing best alternatives through factors that helps in building airports -11-
  • 12.
    •The urban lakeareas of China, are ideal locations for recreational activities and the maintenance of ecological diversity. AHP: Analytical hierarchy process Procedures of GIS-based land-use suitability assessment •GDP = GDPI + GDPA + GDPSI 1. Agricultural GDP: GDPA(t) = GDPA(t − dt) + GDPA GRA dt 2. Industrial GDP 3. Service Industries MCDA AHP -12-
  • 13.
    •The risk ofsoil erosion was evaluated in olive groves in Southern Spain, •showing the potential of the ANP method (Analytic Network Process method) for modeling a complex physical process like soil erosion. •showing usage of Multi-criteria decision analysis. •Thus, soil erosion risk = 0.1986 +0.0428 + 0.0399 +0.027+0.0318 = 0.3401 -13-
  • 14.
  • 15.
  • 16.
  • 17.
    5. Proposed Framework( level 1) Data Capture: Data collected from different Data ware houses of legal authorities ex: layer names, areas, longitude, latitude Preprocessing Selection Filtration elimination To select proposed activities & area of interest To use MCDA to select factors To eliminate unnecessary factors Transformation: To transform text data into shape files & layers Data mining: Using 2 methods cluster and classification to analyze data & to detect intersection between factors Interpretation evaluation: To make user interface through agent negotiations & Reports Knowledge: For decision maker to take decision -17-
  • 18.
    5. Proposed Framework( level 2a) ( Filtration) -18-
  • 19.
    5. Proposed Framework( level 2b) ( Data mining) Two methods used Clustering To integrate each similar factors in one cluster Classification To measure degree of importance to each factor in each cluster -19-
  • 20.
    5. Proposed Framework( level 2b) ( Data mining) cont… Clustering Classification Determine objectives on the map + determining intersection between layers or degree of potentialities -20-
  • 21.
    But it willbe one of two phases implemented to support decision maker in planning and deciding the best usage of the governmental lands -21-
  • 22.
    1. Water 2. Infrastructure 3.Proximity to Natural Protectorates 4. Soil 5. Tourist Resorts or monuments 6. Island Marine 7. Labor 8. Hills and highlands 9. Proximity to mines and quarries 10. Proximity to air ports & ports 11. Away from contaminated areas water Infrastructure Natural protectorates Soil Tourist resorts Island Marine -22-
  • 23.
  • 24.
    Constituents of useRegionProperties 1. Water 2. Infrastructure 3. Proximity to Natural Protectorates 4. Soil 5. Tourist Resorts or monuments 6. Island Marine 7. Labor 8. Hills and highlands 9. Proximity to mines and quarries 10. Proximity to air ports & ports 11. Away from contaminated areas If Agricultural Make a cluster that contains • Through equation resulted from the new model 3 factors were achieved which are; Water ∩ Soil ∩ Labor -24-
  • 25.
    Constituents of useRegionProperties 1.Water 2.Infrastructure 3.Proximity to Natural Protectorates 4.Soil 5.Tourist Resorts or monuments 6.Island Marine 7.Labor 8.Hills and highlands 9.Proximity to mines and quarries 10.Proximity to air ports & ports 11.Away from contaminated areas Make a cluster that contains • Through equation resulted from the new model 4factors were achieved which are; Tourist resort∩ Island marine ∩ proximity to air port ∩ Away from contaminations Tourism -25-
  • 26.
    Using Classification methodin Data mining to classify each factor according to its degree of importance that leads to best utilization and best usage for governmental lands 50% 1%2% 30% 1% 1% 10% 1% 2% 1% 1% Water Infrastructure Proximity to natural protectorates Soil Tourist resort OR Monuments Islands Marine Labor Hills and Highlands Proximity to Mines and Quarries Proximity to air ports and por Away from Contaminated Areas Agriculture -26-
  • 27.
    Factors Proximity to Mines& Quarries Proximity to Settlements-Labor Terrain Island Marines Tourist Resorts or Moments Soils Proximity to natural protectorates Infrastructure Water Total Proximity to Transportation Uses Agriculture (%) 50 1 2 30 1 1 2 10 2 1 100 -27-
  • 28.
    Using Classification methodin Data mining to classify each factor according to its degree of importance that leads to best utilization and best usage for governmental lands The most important factors are: The greatest values According to equation F2 F1 F3 Water 50% Soil 30% Labor 10% Hills & High lands 1% Island Marine 1% Proximity to mines 2% Proximity to airports 1% Away from contaminated areas 1% Infrastructure 1% Natural protectorates 2% Monuments 1% So, Small Percentages doesn’t affect -28-
  • 30.
  • 31.
    1. Topographic Data:Egyptian Survey Authority, Military Survey Authority 2. Climatic Data: Egyptian Climate Authority 3. Soil Data: Research institute of ground water and soil (‫واالراضى‬ ‫الجوفيه‬ ‫المياة‬ ‫لبحوث‬ ‫القومى‬ ‫)المعهد‬ 4. Geologic and mining Data: Egyptian geological survey 5. Environmental data: Egyptian environmental affairs 6. Agricultural Data: agricultural research institute 7. Touristic Data: tourism development authority 8. Industrial Data: industrial development authority 1. Data Resources: -31-
  • 32.
  • 33.
    Factors Proximity to Mines& Quarries Proximity to Settlements-Labor Terrain (Hills and highlands) Island Marines Tourist Resorts or Moments Soils Proximity to natural protectorates Infrastructure Water Total Proximity to Transportation Uses Agriculture (%) 60 - - 30 - - - 10 - - 100 Data Classification -33-
  • 34.
    Factors Proximity to Mines& Quarries Proximity to Settlements-Labor Terrain (Hills and highlands) Island Marines Tourist Resorts or Moments Soils Proximity to natural protectorates Infrastructure Water Total Proximity to Transportation Uses Agriculture (%) 60 - - 30 - - - 10 - - 100 Industry (%) - 30 - - - - - 10 60 - 100 Data Classification -34-
  • 35.
    Factors Proximity to Mines& Quarries Proximity to Settlements-Labor Terrain (Hills and highlands) Island Marines Tourist Resorts or Moments Soils Proximity to natural protectorates Infrastructure Water Total Proximity to Transportation Uses Agriculture (%) 60 - - 30 - - - 10 - - 100 Industry (%) - 30 - - - - - 10 60 - 100 Tourism (%) - - - - 50 10 10 10 -- 20 100 Data Classification -35-
  • 36.
    Factors Proximity to Mines& Quarries Proximity to Settlements-Labor Terrain (Hills and highlands) Island Marines Tourist Resorts or Moments Soils Proximity to natural protectorates Infrastructure Water Total Proximity to Transportation Uses Agriculture (%) 60 - - 30 - - - 10 - - 100 Industry (%) - 30 - - - - - 10 60 - 100 Tourism (%) - - - - 50 10 10 10 -- 20 100 Housing (%) - 40 - 10 - - 10 10 - 30 100 Data Classification -36-
  • 37.
    Data about layers(name, areas, longitude, latitude) Agricultural Capability -37-
  • 38.
    Data about layers(name, areas, longitude, latitude) Agricultural Capability (cont…) -38-
  • 39.
    Data about layers(name, areas, longitude, latitude) Extractive industries Capability -39-
  • 40.
    Data about layers(name, areas, longitude, latitude) Tourism Capability -40-
  • 41.
  • 42.
  • 43.
  • 44.
  • 45.
  • 46.
    In Order touse this UI control you have to be authorized Authentication security: -46-
  • 47.
    Detecting Overlap •Now wehave to convert all matrix values into zeros and ones for normalization as follows: -47-
  • 48.
    Using analysis toolsto detect intersections between factors and layers Detecting Overlap cont… -48-
  • 49.
  • 50.
    •Tourism Potentialities • Miningquarrying Potentialities •Tourism Potentialities • Mining Potentialities •Solar energy potentialities Overlapping Map -50-
  • 51.
  • 52.
  • 53.
  • 54.
    Performance Evaluation : FeaturesEngland model New Vision Using geo-database 1 1 Using dynamic model 1 1 Using model builder 0 1 Using spatial analysis 1 1 Using Multi-criteria decision analysis 1 1 Using clustering method 0 1 Using classification method 0 1 Using evaluation matrix 1 1 Social, economical, environmental goals 1 1 Showing best utilization for overlapping 0 1 Dynamic reports 0 1 -54-
  • 55.
    Performance Evaluation : FeaturesChina model New Vision Using geo-database 1 1 Using dynamic model 0 1 Using model builder 0 1 Using spatial analysis 0 1 Using Multi-criteria decision analysis 1 1 Using clustering method 0 1 Using classification method 0 1 Applying Analytical hierarchy process 1 1 Using evaluation matrix 0 1 Economical goals 1 1 Social, environmental goals 0 1 Showing best utilization for overlapping 0 1 Dynamic reports 0 1 -55-
  • 56.
    Performance Evaluation : FeaturesSpain model New Vision Using geo-database 1 1 Using dynamic model 0 1 Using model builder 0 1 Using spatial analysis 0 1 Using Multi-criteria decision analysis 1 1 Using clustering method 0 1 Using classification method 0 1 Analytical Network Process 1 0 Using evaluation matrix 0 1 Economical goals 1 1 Social, environmental goals 0 1 Showing best utilization for overlapping 0 1 Dynamic reports 0 1 -56-
  • 57.
    Conclusion: -57- 1. Utilize Governmentalresources with the best utilization 2. Applying automatic Reports about used areas and unused areas to help the decision maker to decide and plan for the best usage of the governmental land 3. Applying password to prevent governmental data from misusages 4. By using the Business Intelligent Land use Classification Planning model, any piece of land could be classified according to its utilization, by understanding its factors to collect the dataset elements, and then put this data in the geo-database to reach the optimal utilization result by applying the mathematical equation that runs through the dot net application behind the arc-GIS tool.
  • 58.
    Future Work: Landusages Future Challenges -58-
  • 59.

Editor's Notes