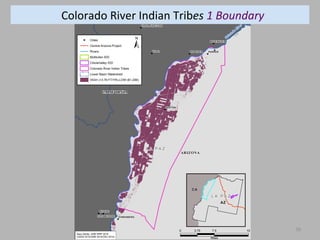
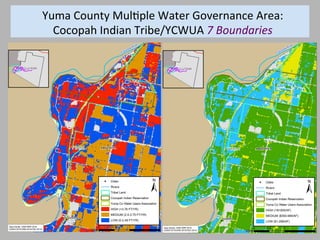
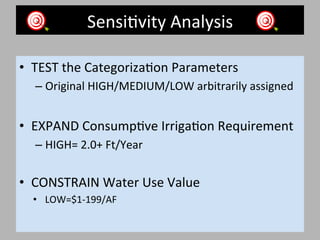
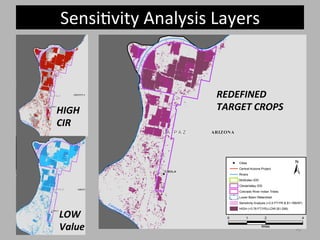
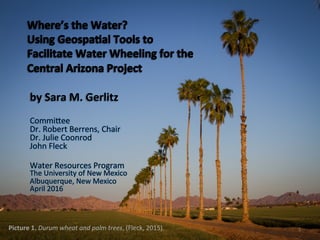
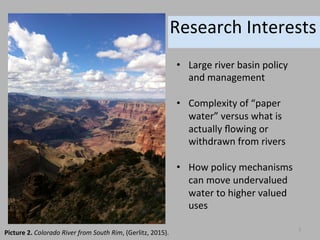
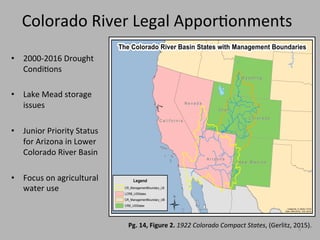
by	
  Sara	
  M.	
  Gerlitz	
  
Commi&ee	
  
Dr.	
  Robert	
  Berrens,	
  Chair	
  
Dr.	
  Julie	
  Coonrod	
  
John	
  Fleck	


Water	
  Resources	
  Program	
  
The	
  University	
  of	
  New	
  Mexico	
  
Albuquerque,	
  New	
  Mexico	
  
April	
  2016	


1	
  Picture	
  1.	
  Durum	
  wheat	
  and	
  palm	
  trees,	
  (Fleck,	
  2015).	
  
Acknowledgements	


Dr.	
  Julie	
  Coonrod	
  	
  
Dean,	
  Graduate	
  Studies	
  
GIS	
  Professor	
  	
  
John	
  Fleck	
  	
  
Assistantship	
  Advisor,	
  
WRP	
  Writer	
  In	
  Residence	
  	
  
Dr.	
  Robert	
  Berrens	
  	
  
Director	
  of	
  WRP,	
  
Water	
  Resources	
  Professor	


  Graduate	
  Studies,	
  	
  
Graduate	
  Assistantship	
  PosiTons	
  	
  
2	
  
Research	
  Interests	
  
Picture	
  2.	
  Colorado	
  River	
  from	
  South	
  Rim,	
  (Gerlitz,	
  2015).	
  
•  Large	
  river	
  basin	
  policy	
  
and	
  management	
  
•  Complexity	
  of	
  “paper	
  
water”	
  versus	
  what	
  is	
  
actually	
  flowing	
  or	
  
withdrawn	
  from	
  rivers	
  
•  How	
  policy	
  mechanisms	
  
can	
  move	
  undervalued	
  
water	
  to	
  higher	
  valued	
  
uses	


3	
  
PresentaTon	
  Outline	
  
Objec6ve,	
  Intro.	
  &	
  Background	
  	
  
•  Research	
  ObjecTve	
  &	
  
Framework	
  
•  Colorado	
  River	
  Legal	
  
ApporTonments	
  
•  Central	
  Arizona	
  Project	
  
•  Water	
  Wheeling	
  
•  AlternaTve	
  Water	
  Transfer	
  
Markets	
  (ATMs)	
  
•  Water	
  Governance	
  
•  Social	
  Capital	
  
Methods,	
  Results	
  &	
  Future	
  Work	
  
•  GeospaTal	
  Tools	
  
•  Agricultural	
  CharacterisTcs	
  
•  Target	
  Crop	
  Methods	
  
•  Results	
  
•  SensiTvity	
  Analysis	
  
•  Discussion	
  of	
  Results	
  
•  Conclusions	
  
•  Future	
  Work	
  
4	
  
Research	
  ObjecTve	
  
Focus	
  on	
  the	
  iniTal	
  aspects	
  of	
  creaTng	
  be&er	
  funcToning	
  water	
  
markets	
  through	
  the	
  use	
  of	
  decision-­‐support	
  tools	
  for	
  a&aining	
  
basic	
  locaTon,	
  agricultural	
  producTon	
  and	
  price	
  informaTon.	
  
5	
  
4	
  Decision-­‐Support	
  Tools	
  
GEOSPATIAL	
  TOOLS	
  
1.  USDA	
  CropScape	


2.	
  Water	
  Governance	
  
RelaTonal	
  Geodatabase	
  
CROP	
  CHARACTERISTICS	
  
3.	
  ConsumpTve	
  IrrigaTon	
  
Requirement	
  (FT/YR)	


4.	
  Water	
  Use	
  Value	
  ($/AF)	
  
6	
  
2	
  Arizona	
  CounTes	
  (outside	
  CAP)	
  
Yuma	
  County	
  
– 10	
  Water	
  User	
  Groups	
  
La	
  Paz	
  County	
  
– 3	
  Water	
  User	
  Groups	
  
7	
  
“Map	
  of	
  Arizona	
  highligh<ng	
  Yuma	
  County” 	


  “Map	
  of	
  Arizona	
  highligh<ng	
  La	
  Paz	
  County,”	
  	
  
(Wikipedia	
  Commons,	
  2016).	
  
1	
  Policy	
  (Wheeling)	
  
Focus	
  on	
  Social	
  Capital	
  Investment	
  
– Building	
  RelaTonships	
  
with	
  agricultural	
  users	
  
outside	
  of	
  CAP	
  
Examine	
  Water	
  Governance	
  InsTtuTons	
  
– With	
  many	
  different	
  decision	
  makers	
  
and	
  resource	
  management	
  structures	
  
8	
  
Colorado	
  River	
  Legal	
  ApporTonments	
  
•  2000-­‐2016	
  Drought	
  
CondiTons	
  
•  Lake	
  Mead	
  storage	
  
issues	
  
•  Junior	
  Priority	
  Status	
  
for	
  Arizona	
  in	
  Lower	
  
Colorado	
  River	
  Basin	


•  Focus	
  on	
  agricultural	
  
water	
  use	


Pg.	
  14,	
  Figure	
  2.	
  1922	
  Colorado	
  Compact	
  States,	
  (Gerlitz,	
  2015).	
  
9	
  
A r i z o n aA r i z o n a
N e v a d aN e v a d a
C a l i f o r n i aC a l i f o r n i a
Pima
Pinal
Maricopa
Central Arizona Project (CAP)
Serviced Counties:
Maricopa, Pima, Pinal
Ü Created By: S. Gerlitz 111515 Data: UNM (2015); CSU (2015)
Legend
AZ_CAP
AZ_County
AZ_CountyCAP
LCRB_USStates
CRB_USStates
Figure	
  1.	
  CAP	
  Serviced	
  Coun<es	
  (Gerlitz,	
  2015).	
  	
  
Central	
  	
  
Arizona	
  	
  
Project	
  
10	
  
Picture	
  3.	
  Central	
  Arizona	
  Project	
  canal,	
  
(Wikipedia	
  Commons,	
  2016).	
  
Phoenix	
  Area	
  Satellite	
  Images:	
  	
  
1989	
  and	
  2009	
  
11	
  
Anima6on	
  1.	
  Booming	
  Growth	
  in	
  Phoenix	
  Suburbs,	
  (Wikipedia	
  Commons,	
  2016).	
  
0	
  
100,000	
  
200,000	
  
300,000	
  
400,000	
  
500,000	
  
600,000	
  
1900	
   1920	
   1940	
   1960	
   1980	
   2000	
   2020	
  
Irrigated	
  Agriculture	
  (Acre-­‐Ft)	
  
Maricopa	
  County,	
  AZ	


Pg.	
  15,	
  Figure	
  3.	
  Irrigated	
  Agriculture,	
  Maricopa	
  County,	
  AZ,	
  (Fleck,	
  2015).	
  
12	
  
 
“Water	
  Wheeling”	
  on	
  the	
  CAP	
  
RESEARCH	
  DEFINITION	
  for	
  wheeling	
  water:	


“the	
  use	
  of	
  the	
  Central	
  Arizona	
  Project	
  
infrastructure	
  to	
  transport	
  any	
  other	
  water	
  
besides	
  CAP	
  deliveries,	
  including	
  addi<onal	
  
Colorado	
  River	
  water	
  or	
  imported	
  
groundwater,”	
  	
  (McCann	
  &	
  Seasholes,	
  2012).	
  	
  
ENERGY	
  INDUSTRY	
  DEFINITION	
  for	
  wheeling	
  electricity:	
  	
  
“the	
  use	
  of	
  the	
  transmission	
  facili<es	
  of	
  one	
  system	
  to	
  transmit	
  
power	
  produced	
  by	
  other	
  en<<es,”	
  (1989,	
  U.S.	
  Congress).	
  	
  
13	
  Picture	
  4.	
  Arizona	
  border	
  sign,	
  (Gerlitz,	
  2015).	
  
SIMPLE	
  DEFINITION	
  for	
  wheeling	
  water:	
  
Intrastate	
  Water	
  Transfers	
  	
  
AlternaTve	
  Water	
  
Transfer	
  Markets	
  (ATMs)	
  
Water	
  Wheeling	
  Policy	
  EXAMPLE:	


2015	
  Water	
  Plan—Pilot-­‐fallowing	
  program	
  between	
  
Central	
  Arizona	
  Groundwater	
  Replenishment	
  District	
  and	
  
Yuma	
  Mesa	
  Irriga<on	
  &	
  Drainage	
  District	
  in	
  Yuma	
  
County,	
  AZ	
  	
  (CAGRD,	
  2015)	
  	
  
Western	
  Governors	
  Associa6on	
  DEFINITION	
  :	


“suite	
  of	
  tools,	
  like	
  leases,	
  rota<onal	
  fallowing,	
  split-­‐
season	
  uses,	
  and	
  water	
  banks…that…avoid	
  the	
  
permanent	
  dry-­‐up	
  of	
  agricultural	
  land,”	
  (2012,	
  p.	
  1).	
  	
  
14	
  
Social	
  Capital	
  Investment	
  
•  DEFINITION:	
  
“building	
  rela<onships	
  between	
  individuals	
  and	
  
communi<es,”	
  (Barnes-­‐Mauthe	
  et	
  al.,	
  2015).	
  
•  APPLICATION:	
  	
  
“having	
  rela<onships	
  helps	
  you	
  have	
  conversa<ons	
  
when	
  you	
  want	
  new	
  solu<ons,”	
  (Walton,	
  2015).	
  
-­‐Kathyrn	
  Sorensen,	
  City	
  of	
  Phoenix	
  
15	
  
Water	
  Governance	
  InsTtuTons	
  
•  DEFINITION:	
  
“the	
  rules	
  that	
  humans	
  use	
  when	
  interac<ng	
  
within…	
  structured	
  situa<ons,”	
  (Ostrom,	
  2011,	
  
p.3)	
  
•  APPLICATION:	
  	
  
“many	
  centers	
  of	
  decision-­‐making	
  that	
  are	
  
formally	
  independent	
  of	
  each	
  other,”	
  (Ostrom,	
  
2009,	
  p.411).	
  
	
   16	
  
Research	
  Development	
  
PROBLEM:	
  	
  
AlternaTve	
  water	
  transfer	
  markets	
  don’t	
  just	
  appear	
  out	
  of	
  thin	
  air	


SUGGESTION:	
  
“[to]	
  enable	
  transfers	
  of	
  water	
  from	
  one	
  user	
  type	
  to	
  another…revis(e)	
  legal	
  policies	
  
and	
  establish…[water]	
  market	
  ins<tu<ons,”	


  (Culp,	
  Glennon	
  &	
  Libecap,	
  2014	
  p.	
  2-­‐7).	


POLICY	
  MECHANISM:	
  	
  
Wheeling	
  Colorado	
  River	
  surface	
  water	
  from	
  agricultural	
  areas	
  outside	
  of	
  the	
  CAP	
  
to	
  municipal	
  &	
  industrial	
  users	
  within	
  CAP	


DECISION	
  SUPPORT	
  TOOLS:	
  	
  
“transparent,	
  publicly	
  available	
  informa<on…including	
  the	
  loca<on	
  and	
  price,”	


  (Western	
  Governors	
  AssociaTon,	
  2012,	
  p.	
  60).	


17	
  
Research	
  ObjecTve,	
  again	
  
Focus	
  on	
  the	
  iniTal	
  aspects	
  of	
  creaTng	
  be&er	
  funcToning	
  water	
  
markets	
  through	
  the	
  use	
  of	
  decision-­‐support	
  tools	
  for	
  a&aining	
  
basic	
  locaTon,	
  agricultural	
  producTon	
  and	
  price	
  informaTon.	
  
18	
  
METHODS:	
  
GeospaTal	
  Tools	
  
•  USDA	
  CropScape	
  
– Examine	
  2014	
  Agricultural	
  Data	
  
– Loca<on	
  &	
  produc<on	
  informa<on	


•  Water	
  Governance	
  RelaTonal	
  Geodatabase	
  
– IdenTfy	
  water	
  user	
  groups	
  &	
  use	
  in	
  CropScape	
  
– Loca<on	
  informa<on	
  
19	
  
USDA	
  CropScape:	
  Iden<fy	
  Target	
  Crops	
  
•  Remote	
  sensing	
  &	
  satellite	
  
imagery,	
  census/survey	
  
•  Cropland	
  Data	
  Layer	
  (CDL)	
  
•  200+	
  Crops	
  w/unique	
  
GRIDCODE	
  value	
  
•  Acreage	
  Totals	
  by	
  GRIDCODE	
  
•  Define	
  Area-­‐Of-­‐Interest	
  (AOI)	
  
•  Data	
  for	
  2007-­‐2015	
  all	
  48	
  
conterminus	
  states	
  
•  ESRI	
  ArcGIS	
  friendly	
  
20	
  
Water	
  Governance	
  RelaTonal	
  Geodatabase	
  (WGRG):	
  
Iden<fy	
  Target	
  Water	
  Users	
  
21	
  
•  CompilaTon	
  of	
  Colorado	
  River	
  Basin	
  GIS	
  data	
  
– Colorado	
  State	
  University	
  (Laituri,	
  2014)	


– “geospa<al	
  method	
  to	
  examine	
  the	
  governance	
  of	
  water	
  
resource	
  use	
  by	
  sector,”	
  (Sternlieb	
  &	
  Laituri,	
  2015,	
  p.	
  52).	


WGRG	
  Example:	
  Yuma	
  County	
  Water	
  Governance	
  
22	
  
METHODS:	
  
Crop	
  CharacterisTcs	
  
•  ConsumpTve	
  IrrigaTon	
  Requirement	
  (CIR)	
  	
  
– Ft/Year	
  by	
  Crop	
  Type	
  
– Water	
  Volume	
  Informa<on	


•  Water	
  Use	
  Value	
  (in	
  2014	
  $)	
  
– $/AF	
  by	
  Crop	
  Type	
  	
  
– Water	
  Price	
  Informa<on	
  
23	
  
Table	
  3.	
  Consump<ve	
  irriga<on	
  requirement	
  (FT/YR)	
  key	
  (Gerlitz,	
  2016).	
  
24	
  
CIR	
  Averages	
  (FT/YR)	
  
CIR	
  Example:	
  Colorado	
  River	
  Indian	
  Tribe	
  
USDA	
  Data 	
  vs.	
   	
  Erie/CADWR	
  Data	
  
25	
  
Pg.	
  45,	
  Table	
  6.	
  Key	
  for	
  water	
  use	
  value,	
  (A&achment	
  1,	
  Gerlitz,	
  2016).	
  
26	
  
Water	
  Use	
  Value	
  ($/AF)	
  
Water	
  Use	
  Value	
  Example:	
  Yuma	
  County	
  SelecTon	
  	
  
(Cocopah	
  Indian	
  Tribe/YCWUA)	
  
USDA	
  Data 	
   	
  vs.	
   	
  CWSD/CADWR	
  Data	
  
27	
  
Target	
  Crops	
  (High	
  CIR/Low	
  $)	
  
28	
  
Pg.	
  47,	
  Table	
  11.	
  Combined	
  Target	
  AOI	
  crops	
  by	
  gridcode,	
  (A&achment	
  1,	
  Gerlitz,	
  2016).	
  
7	
  possible	
  target	
  GRIDCODES	
  
GIS	
  Methods	
  
•  USDA	
  CropScape	
  Data	
  Processing	
  
– Data	
  to	
  Excel	
  (for	
  spreadsheet)	
  
– Data	
  to	
  ArcGIS	
  10.1	
  (for	
  maps)	
  
– Links	
  EXCEL	
  spreadsheet	
  to	
  ArcGIS	
  maps	
  
(4	
  Decision	
  Support	
  Tools	
  Represented	
  in	
  GIS	
  Layers)	
  
29	
  
Yuma	
  County	
  Target	
  Crops	
  Layer	
  
30	
  
La	
  Paz	
  County	
  Target	
  Crops	
  Layer	
  
31	
  
Pg.	
  87,	
  Table	
  20.	
  Percent	
  acres	
  in	
  target	
  AOI	
  crops,	
  (A&achment	
  1,	
  Gerlitz,	
  2016).	
  
32	
  
Results	
  
33	
  
Colorado	
  River	
  Indian	
  Tribes	
  79.8%	
  Target	
  Crops	
  
34	
  
Cibola	
  Valley	
  IrrigaTon	
  &	
  Drainage	
  District	
  66.8%	
  Target	
  Crops	
  
35	
  
Pg.	
  87,	
  Table	
  21.	
  Water	
  governance	
  en<<es	
  per	
  water	
  user	
  group	
  (excluding	
  California	
  and	
  
ci<es	
  layers),	
  (A&achment	
  1,	
  Gerlitz,	
  2016).	
  	
  
Results	
  
Geographic	
  isola?on	
  recommended	
  for	
  social	
  
capital	
  investment	
  
36	
  
Colorado	
  River	
  Indian	
  Tribes	
  1	
  Boundary	
  
37	
  
Yuma	
  County	
  MulTple	
  Water	
  Governance	
  Area:	
  
Cocopah	
  Indian	
  Tribe/YCWUA	
  7	
  Boundaries	
  
ARIZONAY U M AY U M A
Gila River
DOME
ROLL
TACNA
KINTER
MOHAWK
GROWLER
LIGURTA
WELLTON
BLAISDELL
FORTUNA FOOTHILLS
Y U M AY U M A
Sara Gerlitz, UNM WRP 2016
(USDA 2015/UNM 2015/CSU 2014)
Cities
Rivers
Wellton-Mohawk IDD
HIGH (+3.76 FT/YR)-LOW ($1-299/AF)
±
0 5 102.5
Miles
38	
  
Yuma	
  County	
  Isolated	
  Water	
  Governance	
  Area:	
  	
  
Wellton-­‐Mohawk	
  IrrigaTon	
  &	
  Drainage	
  District	
  3	
  Boundaries	
  
39	
  
SensiTvity	
  Analysis	
  
•  TEST	
  the	
  CategorizaTon	
  Parameters	
  
– Original	
  HIGH/MEDIUM/LOW	
  arbitrarily	
  assigned	
  	
  
•  EXPAND	
  ConsumpTve	
  IrrigaTon	
  Requirement	
  	
  
– HIGH=	
  2.0+	
  Ft/Year	


•  CONSTRAIN	
  Water	
  Use	
  Value	
  	
  
•  LOW=$1-­‐199/AF	
  
40	
  
SensiTvity	
  Analysis	
  Layers	
  
HIGH	
  
CIR	
  
LOW	
  
Value	
  
REDEFINED	
  
TARGET	
  CROPS	
  
SensiTvity	
  Analysis	
  Changes	
  to	
  
Target	
  Crops	
  (High	
  CIR/Low	
  $)	
  
41	
  
Removes	
  (2)	
  COTTON	
  as	
  a	
  possible	
  target	
  
Pg.	
  63,	
  Table	
  19.	
  Target	
  AOI	
  crops	
  and	
  sensi<vity	
  analysis,	
  (A&achment	
  1,	
  Gerlitz,	
  2016).	
  
Discussion	
  of	
  Results	
  
•  La	
  Paz	
  County	
  recommended	
  over	
  Yuma	
  County	
  
•  Yuma	
  has	
  more	
  (LOW	
  CIR	
  &	
  HIGH	
  dollar)	
  crops	
  
•  Yuma	
  has	
  more	
  water	
  governance	
  insTtuTons	
  
•  Colorado	
  River	
  Indian	
  River	
  Tribe	
  
–  ~80%	
  Agriculture	
  in	
  HIGH	
  CIR/LOW$	
  crops	
  
–  1	
  Water	
  Governance	
  boundary	
  
•  Geographic	
  IsolaTon	
  	
  
–  Less	
  water	
  governance	
  boundaries,	
  easier	
  social	
  capital	
  
–  Cibola	
  Valley	
  IDD	
  &	
  Wellton-­‐Mohawk	
  	
  
•  CIR	
  &	
  Water	
  Use	
  Value	
  DefiniTons	
  Ma&er	
  
–  SensiTvity	
  Analysis	
  Exclusion	
  of	
  GRIDCODE	
  (2)	
  Co&on	
  
42	
  
Conclusions	
  
•  Agricultural	
  datasets	
  from	
  different	
  sources	
  can	
  be	
  
difficult	
  to	
  combine,	
  but	
  was	
  possible	
  for	
  this	
  project	
  
•  USDA	
  CropScape	
  is	
  only	
  esTmated	
  acreage,	
  but	
  good	
  
baseline	
  numbers	
  for	
  areas	
  of	
  interest	
  
•  Arbitrary	
  classificaTon	
  (H/M/L),	
  but	
  depends	
  on	
  end	
  
result	
  search	
  criteria	
  	
  
–  SensiTvity	
  of	
  these	
  categories	
  can	
  exclude	
  important	
  crops	
  
to	
  the	
  region	
  (cofon)	
  
•  Methods	
  used	
  for	
  agricultural	
  land	
  in	
  producTon,	
  but	
  
omifed	
  (61)	
  Fallow/Idle	
  Cropland………	
  
43	
  
Future	
  Work	
  
Examine	
  (61)	
  Fallow/Idle	
  Cropland	
  
Pg.	
  103,	
  Table	
  22.	
  Percent	
  acres	
  in	
  gridecode	
  (61)	
  Fallow/Idle	
  Cropland,	
  (A&achment	
  1,	
  Gerlitz,	
  2016).	
  
44	
  
45	
  
Future	
  Work	
  
Lower	
  Basin	
  Shortage	
  Restric<ons	
  
46	
  
Picture	
  5.	
  Lake	
  Mead	
  from	
  Hoover	
  Dam,	
  
(Gerlitz,	
  2015).	
  
•  UTlize	
  Research	
  Methods	
  for	
  CAP	
  agriculture	
  
•  1st	
  Target	
  Fallow/Idle	
  Cropland	
  
•  2nd	
  Target	
  Crops	
  
•  IdenTfy	
  potenTal	
  water	
  wheeling	
  
municipaliTes	
  
•  How	
  much	
  water	
  needed?	
  
•  What	
  prices	
  willing/able	
  to	
  pay?	
  	
  
QuesTons?	
  
47	
  Picture	
  6.	
  Yuma	
  County	
  Lefuce,	
  (Fleck,	
  2015).	
  
Thanks!	
  
48	
  Picture	
  7.	
  Lower	
  Colorado	
  River	
  Basin	
  organic	
  watermelon,	
  (Gerlitz,	
  2015).	
  

Professional Project

  • 1.
     by  Sara  M.  Gerlitz   Commi&ee   Dr.  Robert  Berrens,  Chair   Dr.  Julie  Coonrod   John  Fleck     Water  Resources  Program   The  University  of  New  Mexico   Albuquerque,  New  Mexico   April  2016     1  Picture  1.  Durum  wheat  and  palm  trees,  (Fleck,  2015).  
  • 2.
    Acknowledgements     Dr.  Julie  Coonrod     Dean,  Graduate  Studies   GIS  Professor     John  Fleck     Assistantship  Advisor,   WRP  Writer  In  Residence     Dr.  Robert  Berrens     Director  of  WRP,   Water  Resources  Professor      Graduate  Studies,     Graduate  Assistantship  PosiTons     2  
  • 3.
    Research  Interests   Picture  2.  Colorado  River  from  South  Rim,  (Gerlitz,  2015).   •  Large  river  basin  policy   and  management   •  Complexity  of  “paper   water”  versus  what  is   actually  flowing  or   withdrawn  from  rivers   •  How  policy  mechanisms   can  move  undervalued   water  to  higher  valued   uses       3  
  • 4.
    PresentaTon  Outline   Objec6ve,  Intro.  &  Background     •  Research  ObjecTve  &   Framework   •  Colorado  River  Legal   ApporTonments   •  Central  Arizona  Project   •  Water  Wheeling   •  AlternaTve  Water  Transfer   Markets  (ATMs)   •  Water  Governance   •  Social  Capital   Methods,  Results  &  Future  Work   •  GeospaTal  Tools   •  Agricultural  CharacterisTcs   •  Target  Crop  Methods   •  Results   •  SensiTvity  Analysis   •  Discussion  of  Results   •  Conclusions   •  Future  Work   4  
  • 5.
    Research  ObjecTve   Focus  on  the  iniTal  aspects  of  creaTng  be&er  funcToning  water   markets  through  the  use  of  decision-­‐support  tools  for  a&aining   basic  locaTon,  agricultural  producTon  and  price  informaTon.   5  
  • 6.
    4  Decision-­‐Support  Tools   GEOSPATIAL  TOOLS   1.  USDA  CropScape     2.  Water  Governance   RelaTonal  Geodatabase   CROP  CHARACTERISTICS   3.  ConsumpTve  IrrigaTon   Requirement  (FT/YR)     4.  Water  Use  Value  ($/AF)   6  
  • 7.
    2  Arizona  CounTes  (outside  CAP)   Yuma  County   – 10  Water  User  Groups   La  Paz  County   – 3  Water  User  Groups   7   “Map  of  Arizona  highligh<ng  Yuma  County”        “Map  of  Arizona  highligh<ng  La  Paz  County,”     (Wikipedia  Commons,  2016).  
  • 8.
    1  Policy  (Wheeling)   Focus  on  Social  Capital  Investment   – Building  RelaTonships   with  agricultural  users   outside  of  CAP   Examine  Water  Governance  InsTtuTons   – With  many  different  decision  makers   and  resource  management  structures   8  
  • 9.
    Colorado  River  Legal  ApporTonments   •  2000-­‐2016  Drought   CondiTons   •  Lake  Mead  storage   issues   •  Junior  Priority  Status   for  Arizona  in  Lower   Colorado  River  Basin     •  Focus  on  agricultural   water  use       Pg.  14,  Figure  2.  1922  Colorado  Compact  States,  (Gerlitz,  2015).   9  
  • 10.
    A r iz o n aA r i z o n a N e v a d aN e v a d a C a l i f o r n i aC a l i f o r n i a Pima Pinal Maricopa Central Arizona Project (CAP) Serviced Counties: Maricopa, Pima, Pinal Ü Created By: S. Gerlitz 111515 Data: UNM (2015); CSU (2015) Legend AZ_CAP AZ_County AZ_CountyCAP LCRB_USStates CRB_USStates Figure  1.  CAP  Serviced  Coun<es  (Gerlitz,  2015).     Central     Arizona     Project   10   Picture  3.  Central  Arizona  Project  canal,   (Wikipedia  Commons,  2016).  
  • 11.
    Phoenix  Area  Satellite  Images:     1989  and  2009   11   Anima6on  1.  Booming  Growth  in  Phoenix  Suburbs,  (Wikipedia  Commons,  2016).  
  • 12.
    0   100,000   200,000   300,000   400,000   500,000   600,000   1900   1920   1940   1960   1980   2000   2020   Irrigated  Agriculture  (Acre-­‐Ft)   Maricopa  County,  AZ       Pg.  15,  Figure  3.  Irrigated  Agriculture,  Maricopa  County,  AZ,  (Fleck,  2015).   12  
  • 13.
      “Water  Wheeling”  on  the  CAP   RESEARCH  DEFINITION  for  wheeling  water:       “the  use  of  the  Central  Arizona  Project   infrastructure  to  transport  any  other  water   besides  CAP  deliveries,  including  addi<onal   Colorado  River  water  or  imported   groundwater,”    (McCann  &  Seasholes,  2012).     ENERGY  INDUSTRY  DEFINITION  for  wheeling  electricity:     “the  use  of  the  transmission  facili<es  of  one  system  to  transmit   power  produced  by  other  en<<es,”  (1989,  U.S.  Congress).     13  Picture  4.  Arizona  border  sign,  (Gerlitz,  2015).   SIMPLE  DEFINITION  for  wheeling  water:   Intrastate  Water  Transfers    
  • 14.
    AlternaTve  Water   Transfer  Markets  (ATMs)   Water  Wheeling  Policy  EXAMPLE:       2015  Water  Plan—Pilot-­‐fallowing  program  between   Central  Arizona  Groundwater  Replenishment  District  and   Yuma  Mesa  Irriga<on  &  Drainage  District  in  Yuma   County,  AZ    (CAGRD,  2015)     Western  Governors  Associa6on  DEFINITION  :       “suite  of  tools,  like  leases,  rota<onal  fallowing,  split-­‐ season  uses,  and  water  banks…that…avoid  the   permanent  dry-­‐up  of  agricultural  land,”  (2012,  p.  1).     14  
  • 15.
    Social  Capital  Investment   •  DEFINITION:   “building  rela<onships  between  individuals  and   communi<es,”  (Barnes-­‐Mauthe  et  al.,  2015).   •  APPLICATION:     “having  rela<onships  helps  you  have  conversa<ons   when  you  want  new  solu<ons,”  (Walton,  2015).   -­‐Kathyrn  Sorensen,  City  of  Phoenix   15  
  • 16.
    Water  Governance  InsTtuTons   •  DEFINITION:   “the  rules  that  humans  use  when  interac<ng   within…  structured  situa<ons,”  (Ostrom,  2011,   p.3)   •  APPLICATION:     “many  centers  of  decision-­‐making  that  are   formally  independent  of  each  other,”  (Ostrom,   2009,  p.411).     16  
  • 17.
    Research  Development   PROBLEM:     AlternaTve  water  transfer  markets  don’t  just  appear  out  of  thin  air     SUGGESTION:   “[to]  enable  transfers  of  water  from  one  user  type  to  another…revis(e)  legal  policies   and  establish…[water]  market  ins<tu<ons,”          (Culp,  Glennon  &  Libecap,  2014  p.  2-­‐7).       POLICY  MECHANISM:     Wheeling  Colorado  River  surface  water  from  agricultural  areas  outside  of  the  CAP   to  municipal  &  industrial  users  within  CAP     DECISION  SUPPORT  TOOLS:     “transparent,  publicly  available  informa<on…including  the  loca<on  and  price,”            (Western  Governors  AssociaTon,  2012,  p.  60).       17  
  • 18.
    Research  ObjecTve,  again   Focus  on  the  iniTal  aspects  of  creaTng  be&er  funcToning  water   markets  through  the  use  of  decision-­‐support  tools  for  a&aining   basic  locaTon,  agricultural  producTon  and  price  informaTon.   18  
  • 19.
    METHODS:   GeospaTal  Tools   •  USDA  CropScape   – Examine  2014  Agricultural  Data   – Loca<on  &  produc<on  informa<on     •  Water  Governance  RelaTonal  Geodatabase   – IdenTfy  water  user  groups  &  use  in  CropScape   – Loca<on  informa<on   19  
  • 20.
    USDA  CropScape:  Iden<fy  Target  Crops   •  Remote  sensing  &  satellite   imagery,  census/survey   •  Cropland  Data  Layer  (CDL)   •  200+  Crops  w/unique   GRIDCODE  value   •  Acreage  Totals  by  GRIDCODE   •  Define  Area-­‐Of-­‐Interest  (AOI)   •  Data  for  2007-­‐2015  all  48   conterminus  states   •  ESRI  ArcGIS  friendly   20  
  • 21.
    Water  Governance  RelaTonal  Geodatabase  (WGRG):   Iden<fy  Target  Water  Users   21   •  CompilaTon  of  Colorado  River  Basin  GIS  data   – Colorado  State  University  (Laituri,  2014)     – “geospa<al  method  to  examine  the  governance  of  water   resource  use  by  sector,”  (Sternlieb  &  Laituri,  2015,  p.  52).    
  • 22.
    WGRG  Example:  Yuma  County  Water  Governance   22  
  • 23.
    METHODS:   Crop  CharacterisTcs   •  ConsumpTve  IrrigaTon  Requirement  (CIR)     – Ft/Year  by  Crop  Type   – Water  Volume  Informa<on       •  Water  Use  Value  (in  2014  $)   – $/AF  by  Crop  Type     – Water  Price  Informa<on   23  
  • 24.
    Table  3.  Consump<ve  irriga<on  requirement  (FT/YR)  key  (Gerlitz,  2016).   24   CIR  Averages  (FT/YR)  
  • 25.
    CIR  Example:  Colorado  River  Indian  Tribe   USDA  Data  vs.    Erie/CADWR  Data   25  
  • 26.
    Pg.  45,  Table  6.  Key  for  water  use  value,  (A&achment  1,  Gerlitz,  2016).   26   Water  Use  Value  ($/AF)  
  • 27.
    Water  Use  Value  Example:  Yuma  County  SelecTon     (Cocopah  Indian  Tribe/YCWUA)   USDA  Data    vs.    CWSD/CADWR  Data   27  
  • 28.
    Target  Crops  (High  CIR/Low  $)   28   Pg.  47,  Table  11.  Combined  Target  AOI  crops  by  gridcode,  (A&achment  1,  Gerlitz,  2016).   7  possible  target  GRIDCODES  
  • 29.
    GIS  Methods   • USDA  CropScape  Data  Processing   – Data  to  Excel  (for  spreadsheet)   – Data  to  ArcGIS  10.1  (for  maps)   – Links  EXCEL  spreadsheet  to  ArcGIS  maps   (4  Decision  Support  Tools  Represented  in  GIS  Layers)   29  
  • 30.
    Yuma  County  Target  Crops  Layer   30  
  • 31.
    La  Paz  County  Target  Crops  Layer   31  
  • 32.
    Pg.  87,  Table  20.  Percent  acres  in  target  AOI  crops,  (A&achment  1,  Gerlitz,  2016).   32   Results  
  • 33.
    33   Colorado  River  Indian  Tribes  79.8%  Target  Crops  
  • 34.
    34   Cibola  Valley  IrrigaTon  &  Drainage  District  66.8%  Target  Crops  
  • 35.
    35   Pg.  87,  Table  21.  Water  governance  en<<es  per  water  user  group  (excluding  California  and   ci<es  layers),  (A&achment  1,  Gerlitz,  2016).     Results   Geographic  isola?on  recommended  for  social   capital  investment  
  • 36.
    36   Colorado  River  Indian  Tribes  1  Boundary  
  • 37.
    37   Yuma  County  MulTple  Water  Governance  Area:   Cocopah  Indian  Tribe/YCWUA  7  Boundaries  
  • 38.
    ARIZONAY U MAY U M A Gila River DOME ROLL TACNA KINTER MOHAWK GROWLER LIGURTA WELLTON BLAISDELL FORTUNA FOOTHILLS Y U M AY U M A Sara Gerlitz, UNM WRP 2016 (USDA 2015/UNM 2015/CSU 2014) Cities Rivers Wellton-Mohawk IDD HIGH (+3.76 FT/YR)-LOW ($1-299/AF) ± 0 5 102.5 Miles 38   Yuma  County  Isolated  Water  Governance  Area:     Wellton-­‐Mohawk  IrrigaTon  &  Drainage  District  3  Boundaries  
  • 39.
    39   SensiTvity  Analysis   •  TEST  the  CategorizaTon  Parameters   – Original  HIGH/MEDIUM/LOW  arbitrarily  assigned     •  EXPAND  ConsumpTve  IrrigaTon  Requirement     – HIGH=  2.0+  Ft/Year     •  CONSTRAIN  Water  Use  Value     •  LOW=$1-­‐199/AF  
  • 40.
    40   SensiTvity  Analysis  Layers   HIGH   CIR   LOW   Value   REDEFINED   TARGET  CROPS  
  • 41.
    SensiTvity  Analysis  Changes  to   Target  Crops  (High  CIR/Low  $)   41   Removes  (2)  COTTON  as  a  possible  target   Pg.  63,  Table  19.  Target  AOI  crops  and  sensi<vity  analysis,  (A&achment  1,  Gerlitz,  2016).  
  • 42.
    Discussion  of  Results   •  La  Paz  County  recommended  over  Yuma  County   •  Yuma  has  more  (LOW  CIR  &  HIGH  dollar)  crops   •  Yuma  has  more  water  governance  insTtuTons   •  Colorado  River  Indian  River  Tribe   –  ~80%  Agriculture  in  HIGH  CIR/LOW$  crops   –  1  Water  Governance  boundary   •  Geographic  IsolaTon     –  Less  water  governance  boundaries,  easier  social  capital   –  Cibola  Valley  IDD  &  Wellton-­‐Mohawk     •  CIR  &  Water  Use  Value  DefiniTons  Ma&er   –  SensiTvity  Analysis  Exclusion  of  GRIDCODE  (2)  Co&on   42  
  • 43.
    Conclusions   •  Agricultural  datasets  from  different  sources  can  be   difficult  to  combine,  but  was  possible  for  this  project   •  USDA  CropScape  is  only  esTmated  acreage,  but  good   baseline  numbers  for  areas  of  interest   •  Arbitrary  classificaTon  (H/M/L),  but  depends  on  end   result  search  criteria     –  SensiTvity  of  these  categories  can  exclude  important  crops   to  the  region  (cofon)   •  Methods  used  for  agricultural  land  in  producTon,  but   omifed  (61)  Fallow/Idle  Cropland………   43  
  • 44.
    Future  Work   Examine  (61)  Fallow/Idle  Cropland   Pg.  103,  Table  22.  Percent  acres  in  gridecode  (61)  Fallow/Idle  Cropland,  (A&achment  1,  Gerlitz,  2016).   44  
  • 45.
  • 46.
    Future  Work   Lower  Basin  Shortage  Restric<ons   46   Picture  5.  Lake  Mead  from  Hoover  Dam,   (Gerlitz,  2015).   •  UTlize  Research  Methods  for  CAP  agriculture   •  1st  Target  Fallow/Idle  Cropland   •  2nd  Target  Crops   •  IdenTfy  potenTal  water  wheeling   municipaliTes   •  How  much  water  needed?   •  What  prices  willing/able  to  pay?    
  • 47.
    QuesTons?   47  Picture  6.  Yuma  County  Lefuce,  (Fleck,  2015).  
  • 48.
    Thanks!   48  Picture  7.  Lower  Colorado  River  Basin  organic  watermelon,  (Gerlitz,  2015).