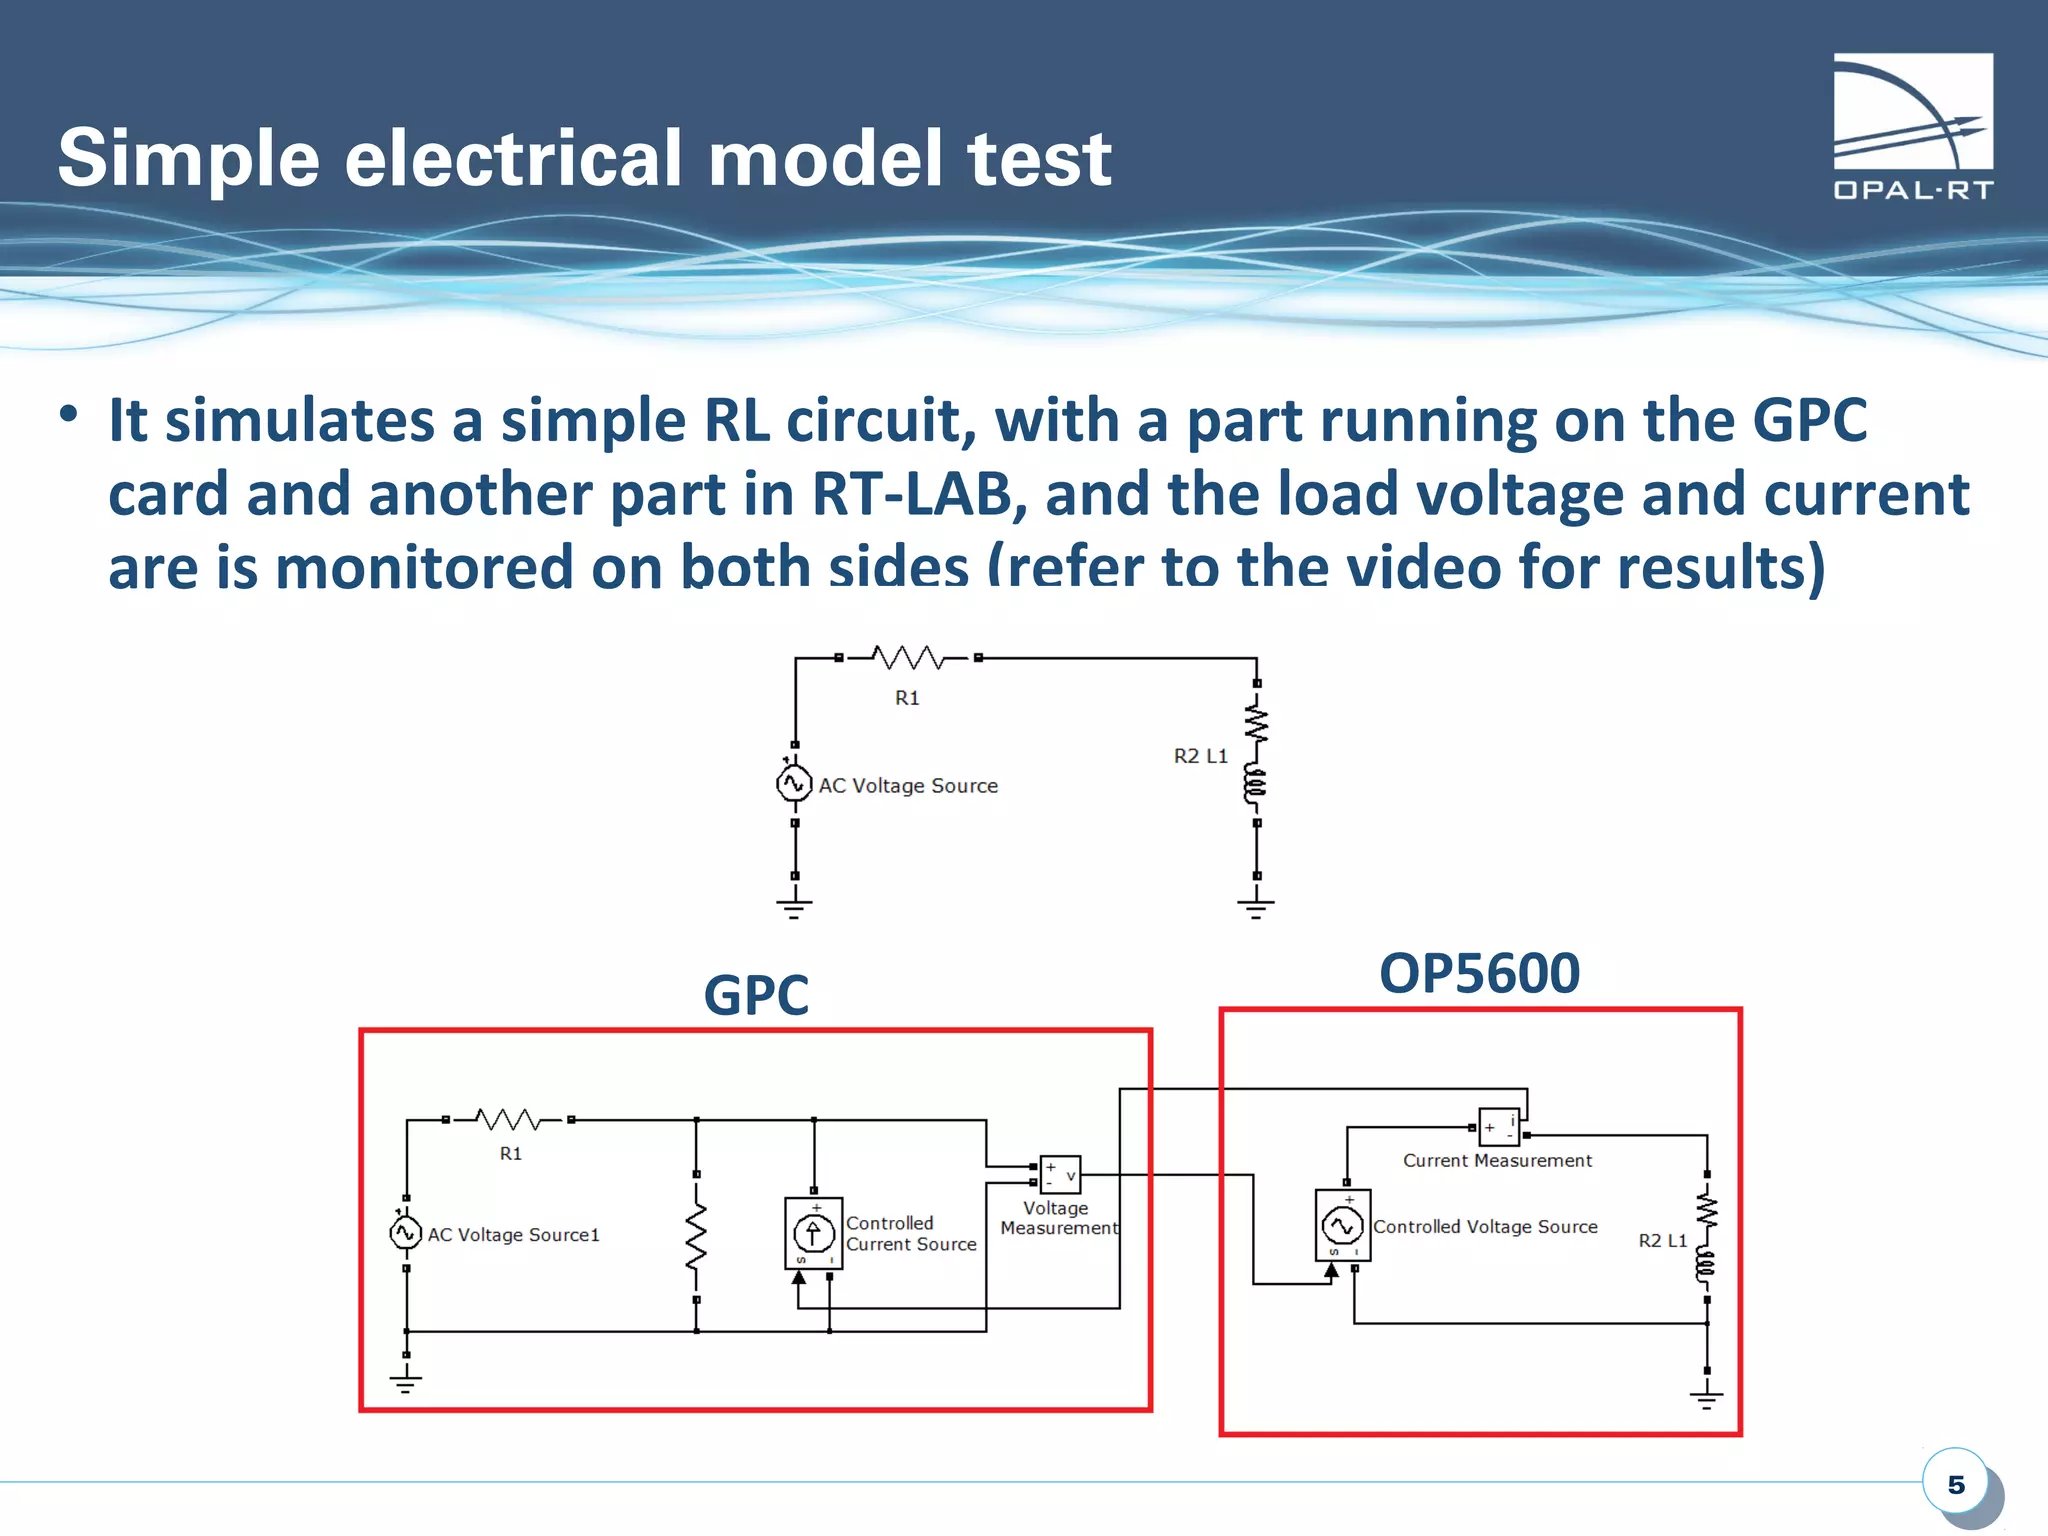
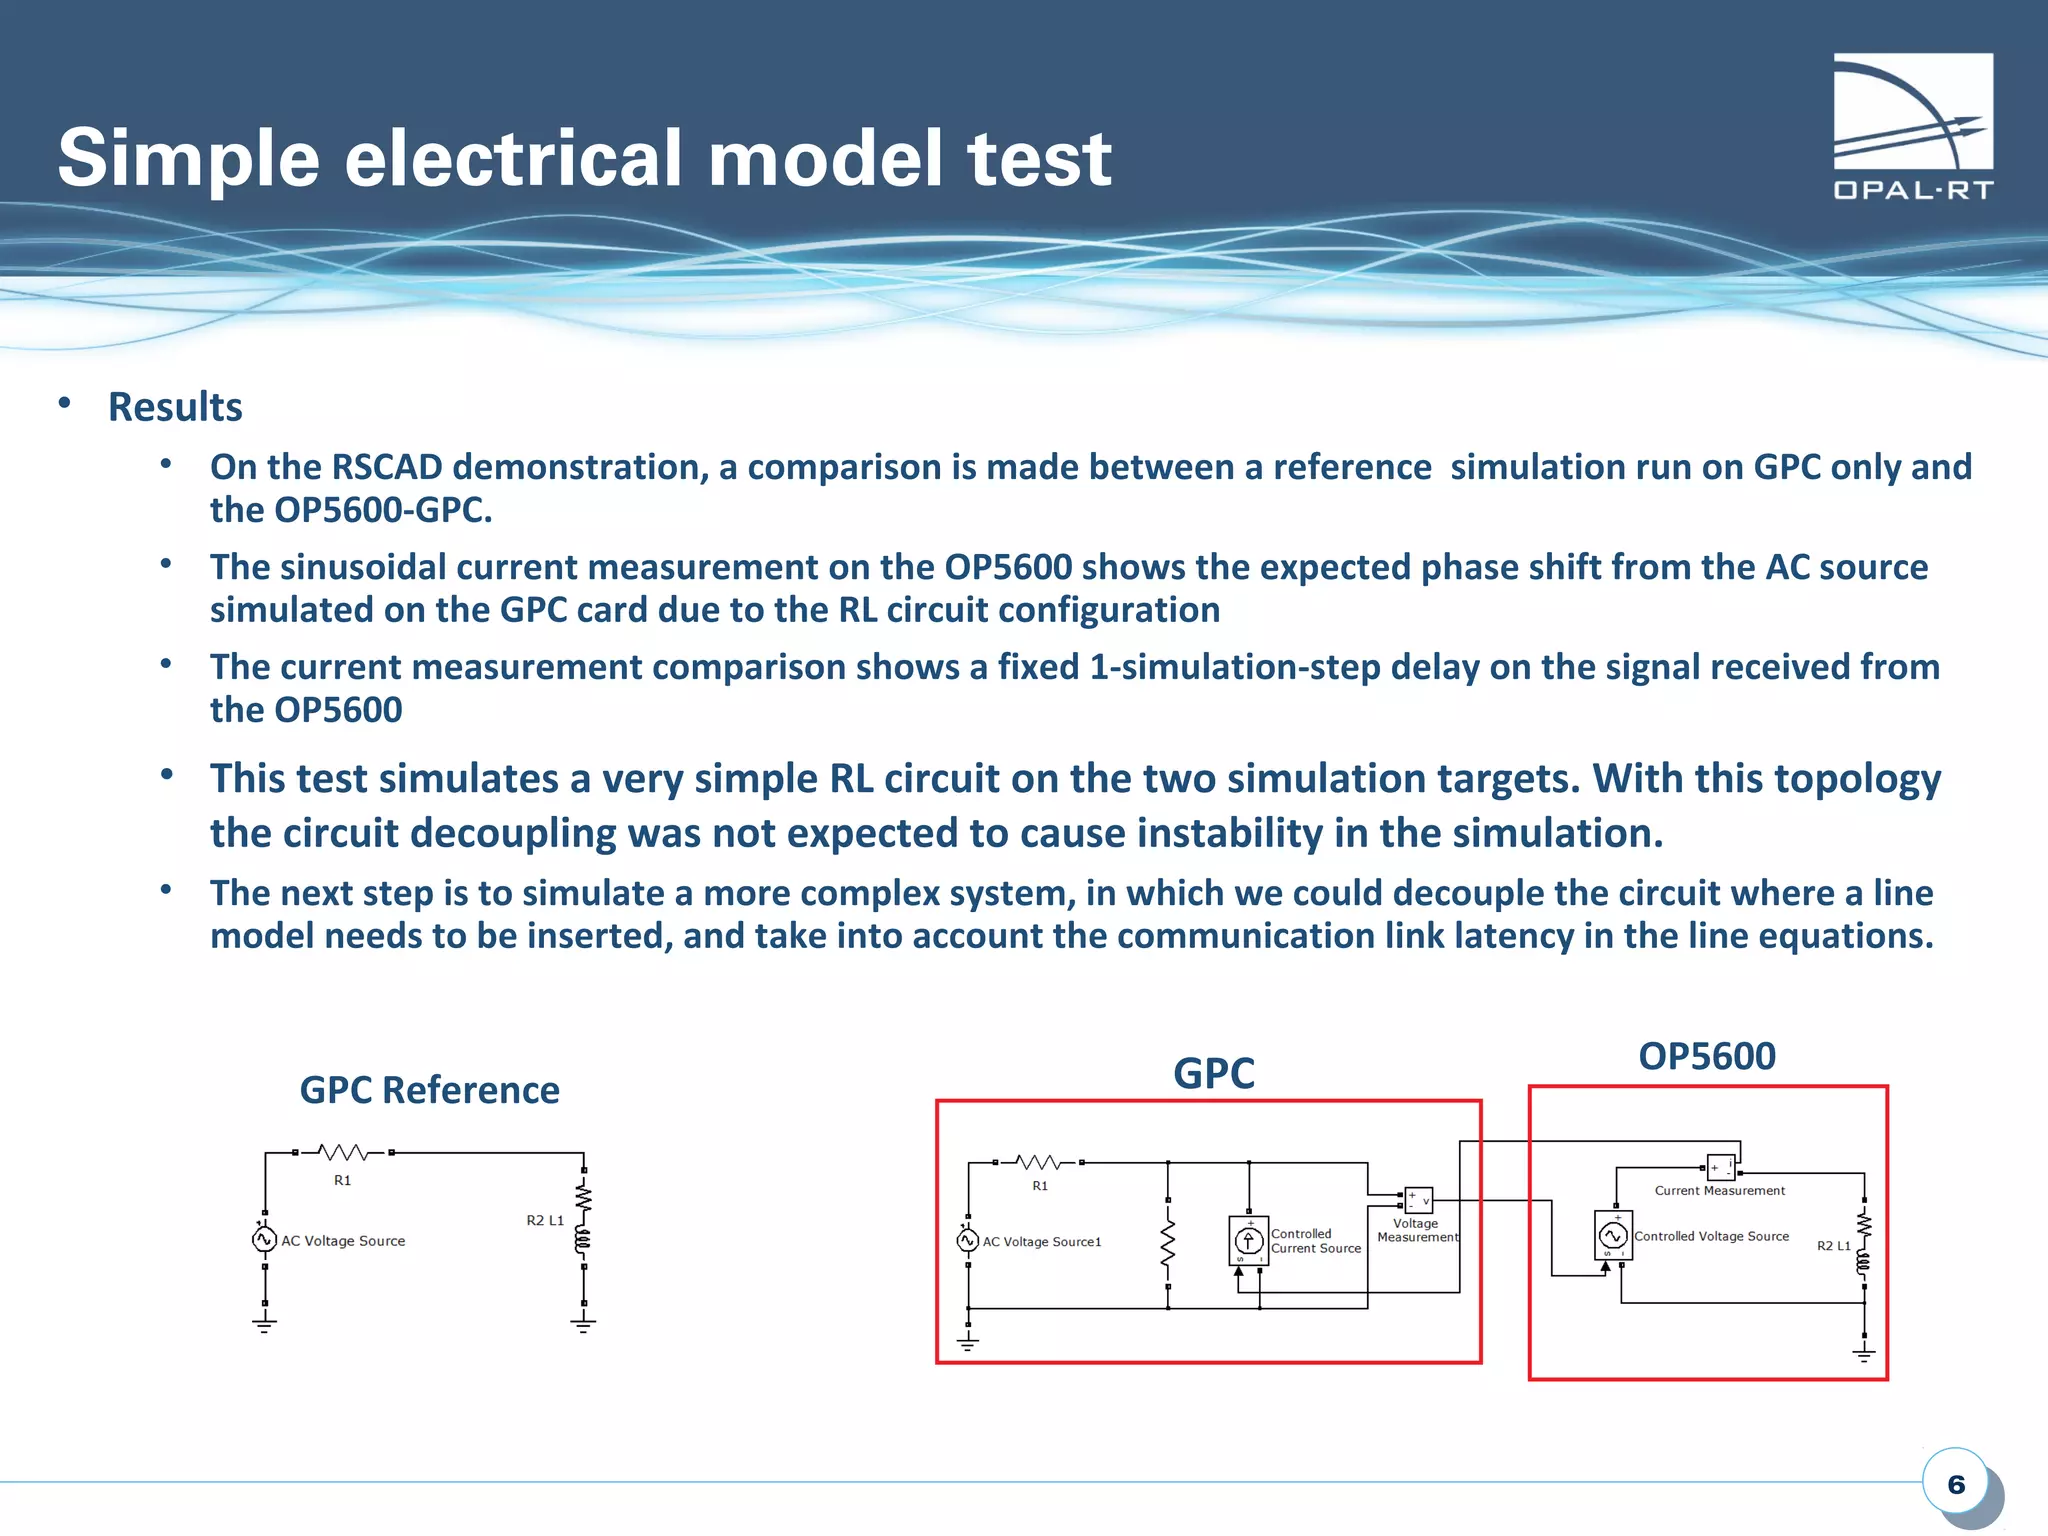
E.ON Energy Research Center builds first interface between OPAL-RT and RTDS Technologies real-time simulators, opens new collaborative research opportunities
3. 33
Test Setup
• The communication /
synchronization between the
OPAL-RT and RTDS systems are
done through a fiber optic pair
connected in an SFP module on
both sides
• On the OPAL-RT system, the SFP is
located in the ML605 on-board
SFP socket
• On the RTDS system, the SFP is
located in either the 3rd
or 4th
SFP
socket of a GPC card (The first 2
are used for GPC-GPC
interconnections).
4. 44
Test Setup
• Once the OPAL-RT ML605 is
programmed with a bitstream that
includes the RTDS Interface Module
on the on-board SFP module, it is
seen as a GTFPGA card in RSCAD.
• On the OPAL-RT system, access to
the data exchanged with RTDS is
done through a RT-XSG design, and
the RT-LAB access is available via
the general-purpose
DataIN/DataOUT ports.
• On the RTDS system, the data
exchanged with OPAL-RT is accessed
through a GigaTranceiver FPGA
(GTFPGA) block.
5. 55
Simple electrical model test
• It simulates a simple RL circuit, with a part running on the GPC
card and another part in RT-LAB, and the load voltage and current
are is monitored on both sides (refer to the video for results)
GPC OP5600
6. 66
Simple electrical model test
• Results
• On the RSCAD demonstration, a comparison is made between a reference simulation run on GPC only and
the OP5600-GPC.
• The sinusoidal current measurement on the OP5600 shows the expected phase shift from the AC source
simulated on the GPC card due to the RL circuit configuration
• The current measurement comparison shows a fixed 1-simulation-step delay on the signal received from
the OP5600
• This test simulates a very simple RL circuit on the two simulation targets. With this topology
the circuit decoupling was not expected to cause instability in the simulation.
• The next step is to simulate a more complex system, in which we could decouple the circuit where a line
model needs to be inserted, and take into account the communication link latency in the line equations.
GPC OP5600
GPC Reference
7. 77
Synchronization model test
• It uses internal loopbacks to monitor the communication latency and verify that both models start at the
same time and run with perfect synchronization.
• The models are both synchronized by the RTDS rack backplane, and the synchronization pulse is sent to
the OPAL-RT system using the same optical link as the one used for the data.
• Four 32-bit words are sent in either direction, with the following loopback scheme:
Counter
Counter
Counter
?t=
Ts+2us
?=1
?=2
?=3
?=1
OP5600
ML605
GPC
8. 88
Synchronization model test
• Results
• The OPAL-RT simulation is successfully synchronized as a slave from the RTDS rack synchronization
pulse.
• The RSCAD simulation start can successfully trigger the OPAL-RT simulation execution start.
• On both the RT-LAB and RSCAD simulation, comparing the local counter with the remote counter
received on the optical link shows a fixed 1-step difference, corresponding to the optical link latency
• Difference was always equal to 1 on a comparison done through datalogging across 30,000 steps on the OPAL-RT
system.
• With a signal generated directly on the OPAL-RT FPGA using RT-XSG, the ML605->GPC->ML605
loopback delay is (Ts + ~2µs)
• With a signal generated on the RSCAD design, the RTDS-OPAL-RTDS loopback latency is stable and
equal to:
• 3*Ts when the loopback on the OPAL-RT system is done on the CPU
• 2*Ts when is done on the OPAL-RT FPGA without passing through the CPU.
• With a signal generated on the RT-LAB model, the OPAL-RTDS-OPAL loopback latency is stable and
equal to 3*Ts
• Ts is the simulation step size