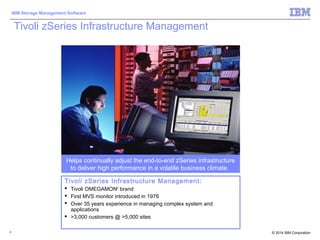
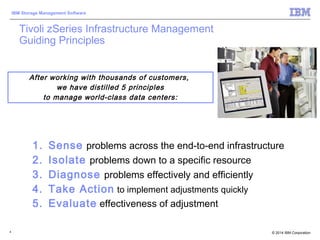
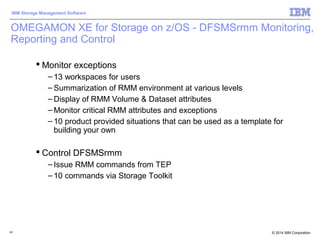
For the last 38 years we have helped companies manage their business critical data centers, applications and infrastructure. Our OMEGAMON brand is widely known as the leading solution for managing and automating data centers. Introduced to the market in 1976, OMEGAMON has over 3,000 customers at 5000 sites, we have helped most of the companies to more effectively manager their data centers. They view Candle as experts that help them solve complex problems, that help them grow their expertise, and enable them to build confidence in their mission critical systems.
After working with thousands of customers we have distilled 4 principles to manage world-class data centers. I will summarize them here and then review a number of specific best practices.
First, identify problems across the end-to-end infrastructure
Second, isolate problems down to a specific line of code
Third, resolve problems effectively and efficiently.
Fourth, automate problems with new monitoring rules to automate the solution
The goal here is to show the integration of a portal technology from Candle that will sit on top of ITM. This will bring a number of features tuned towards the Subject Matter Expert, including customizable saved workspaces that brings up the typical info they use to troubleshoot, a simple and flexible graphing system to make the metrics more digestable, and the ability to link between views to follow diagnostic techniques between subsystems.
Availability targeted for 2H05.
Integrated Warehouse
Continues to support strength of Long Term capacity, trending and SLA evaluation capability with Data Aggregation
Supports Problem Diagnostics and Reconstruction with raw data availability
Custom Pruning (how long to keep data) and Aggregation (how often to compress) enable flexible data maintenance
Simple ODBC or SQL APIs support customer extraction for custom use.
Non-enabled volume column. Added to DF520 as enhancement.
Default link gives the performance of the volumes in the storage group. Note new metric, MSR Connect time percent, which is the percent of total MSR spent transmitting data. Useful for situations since high MSR isn’t always bad.
Linking from a row shows the dataset response information for each job that has accessed the data. The pie chart shows a breakdown for all jobs accessing the dataset.
Cache control unit performance. Link to cache control unit performance trend…
Cross system performance screen space, linked to from the SMS Storage Group performance screen space.
New data in Omegamon XE for Storage, channel path trend. May use time span button on report or plot to change time span.