Downloaded 104 times

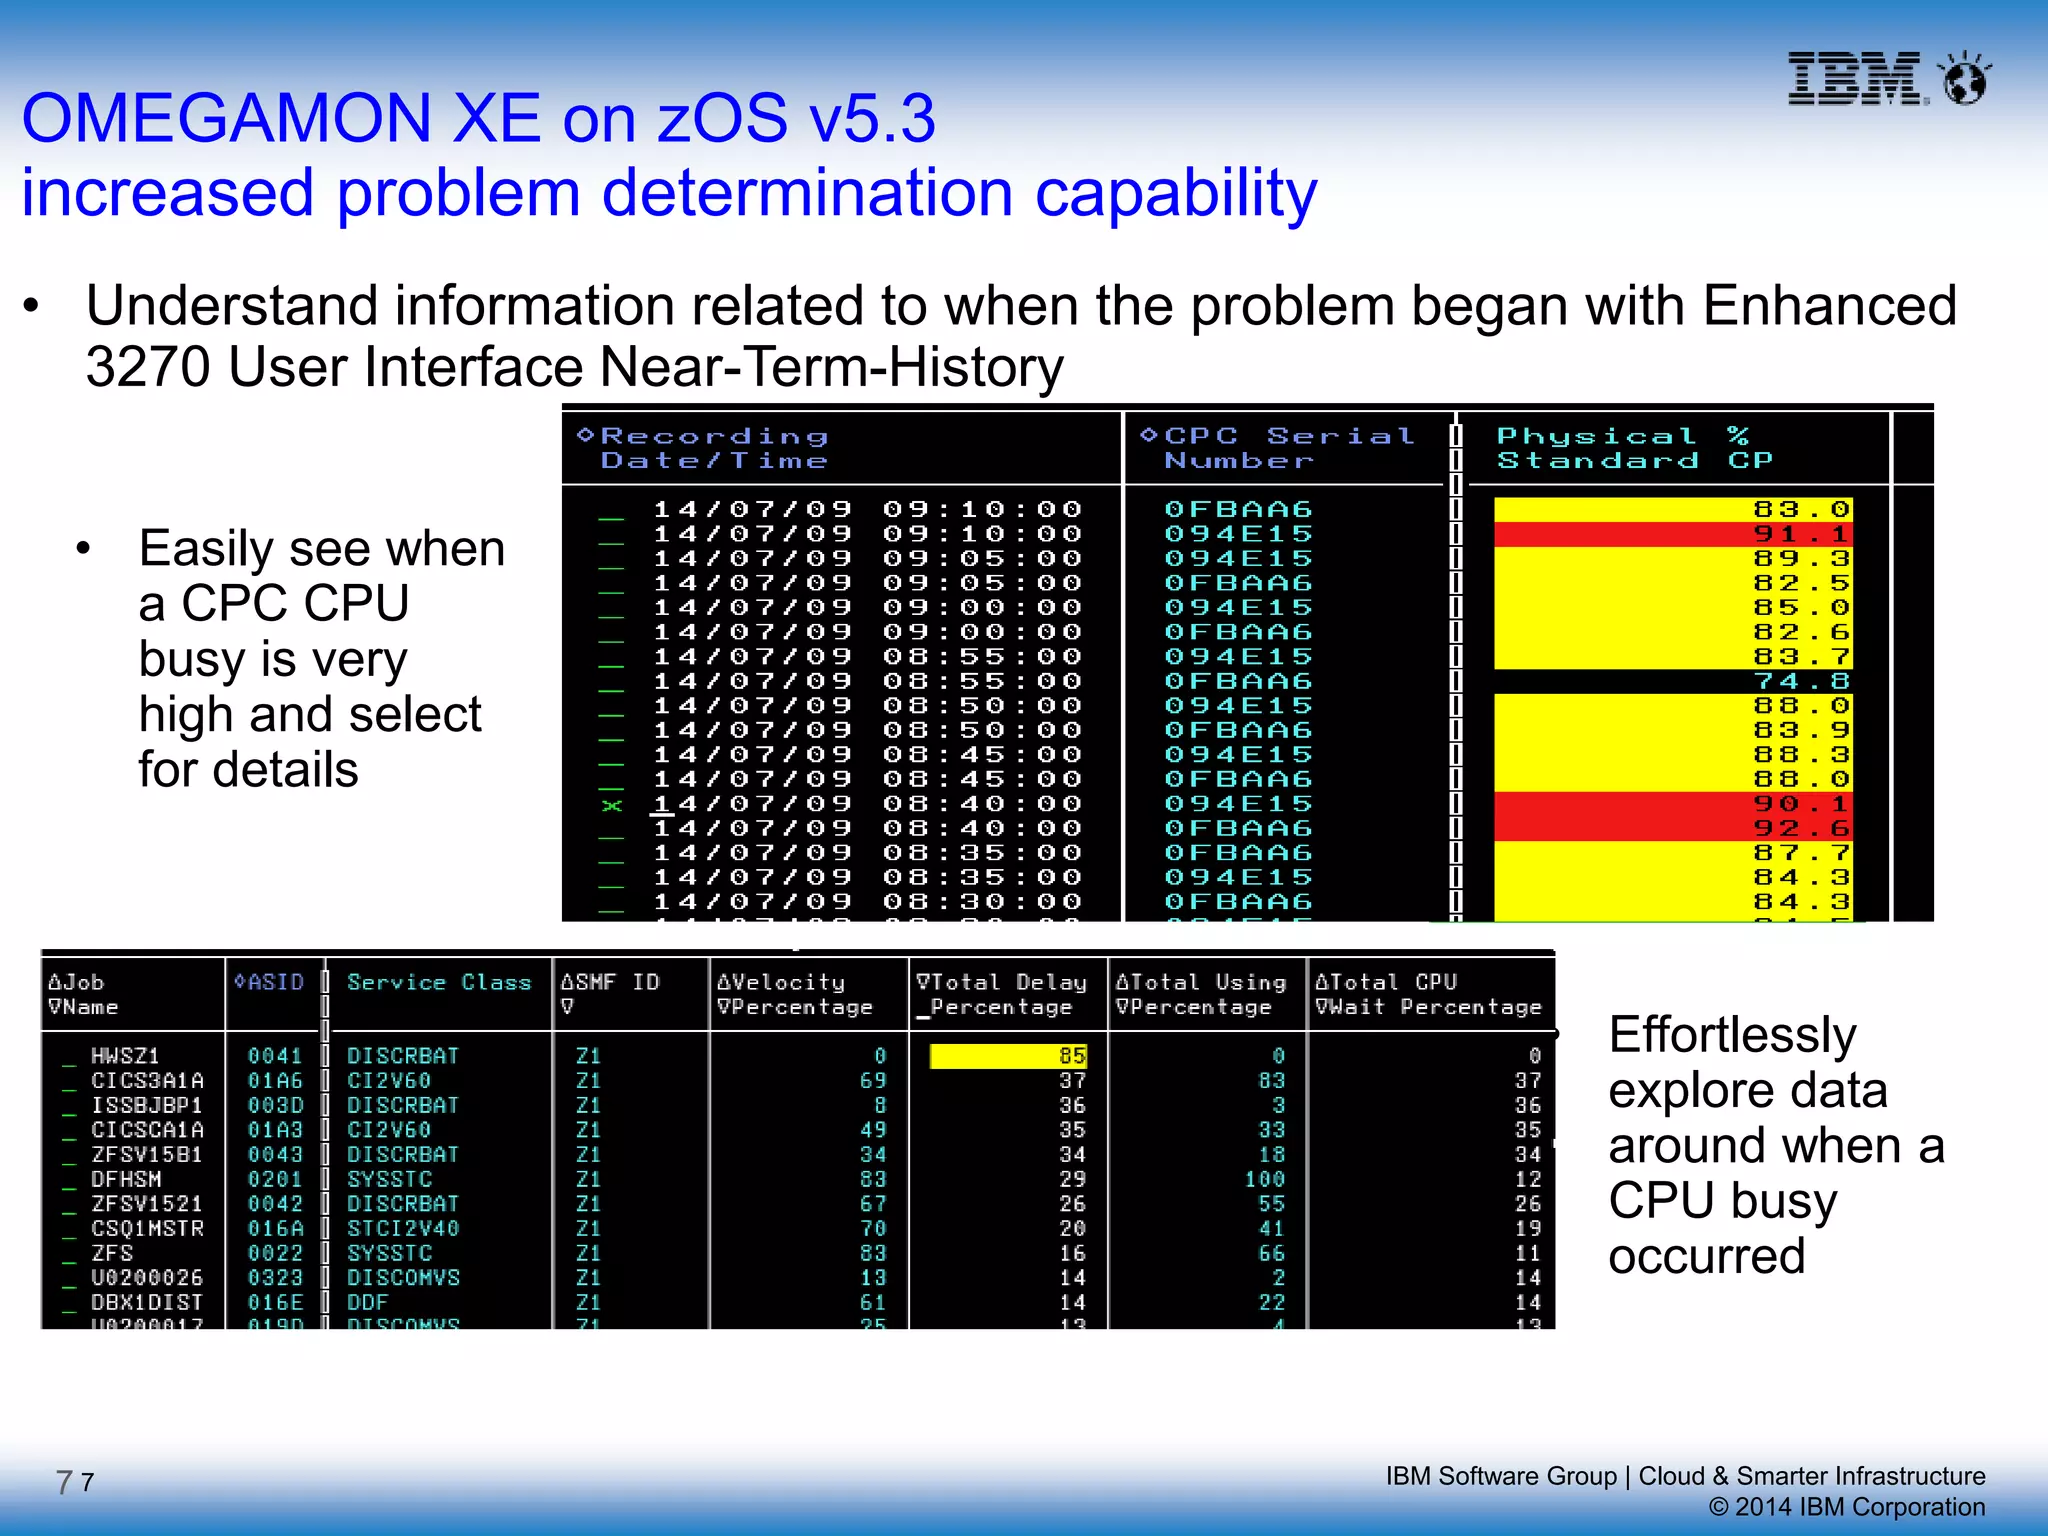


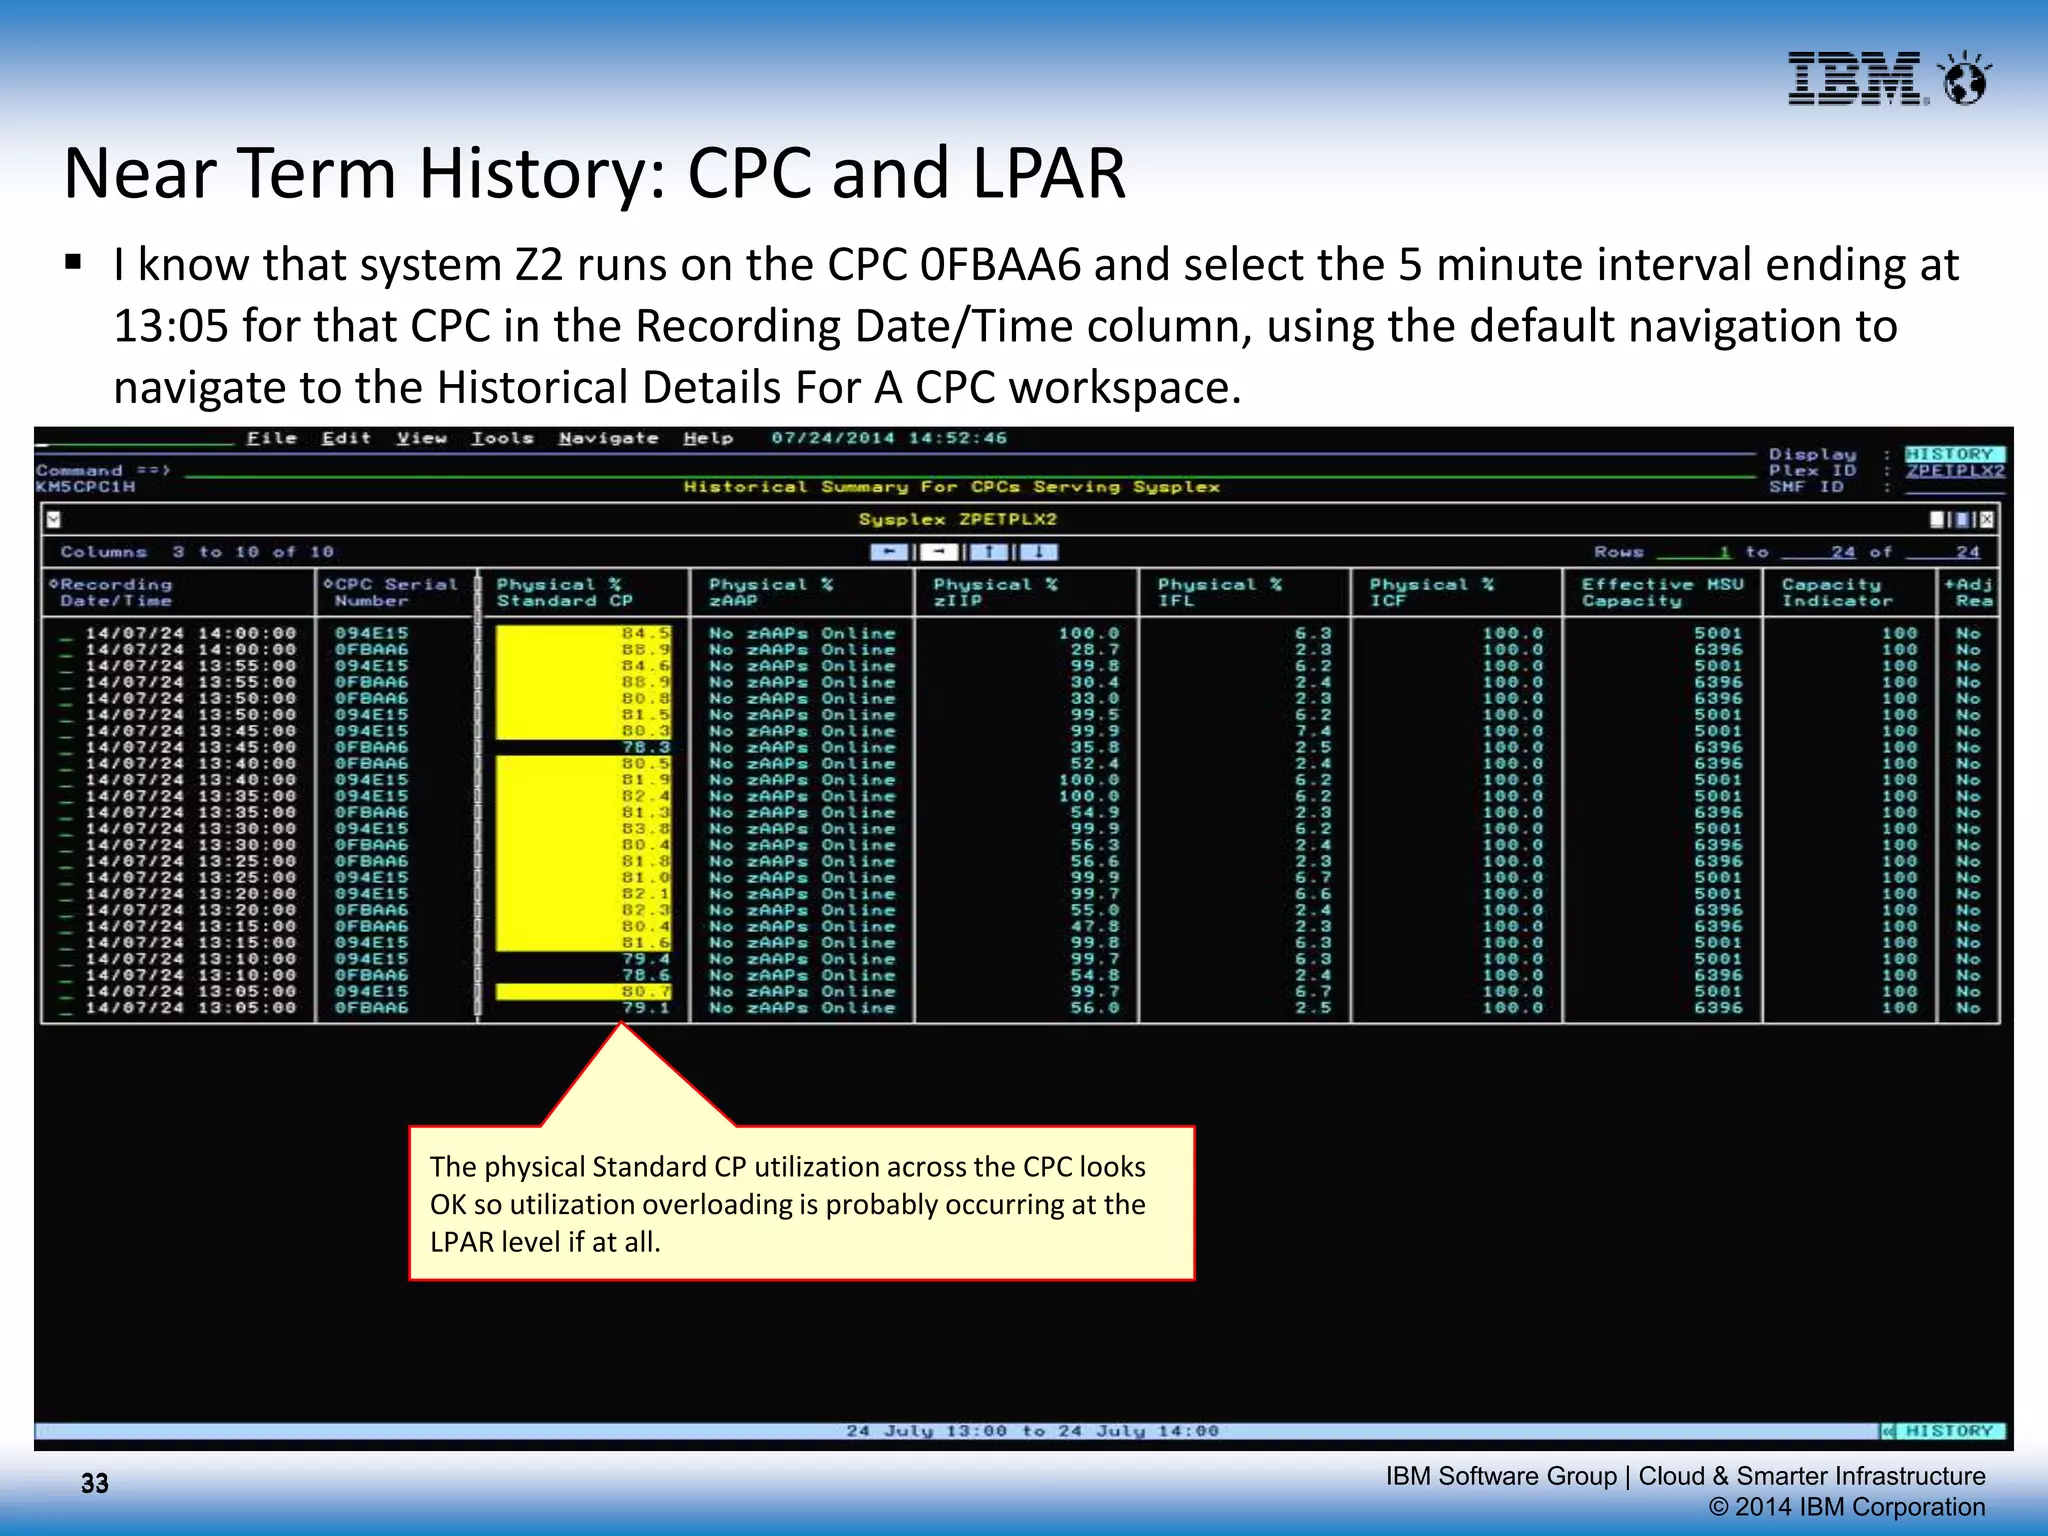
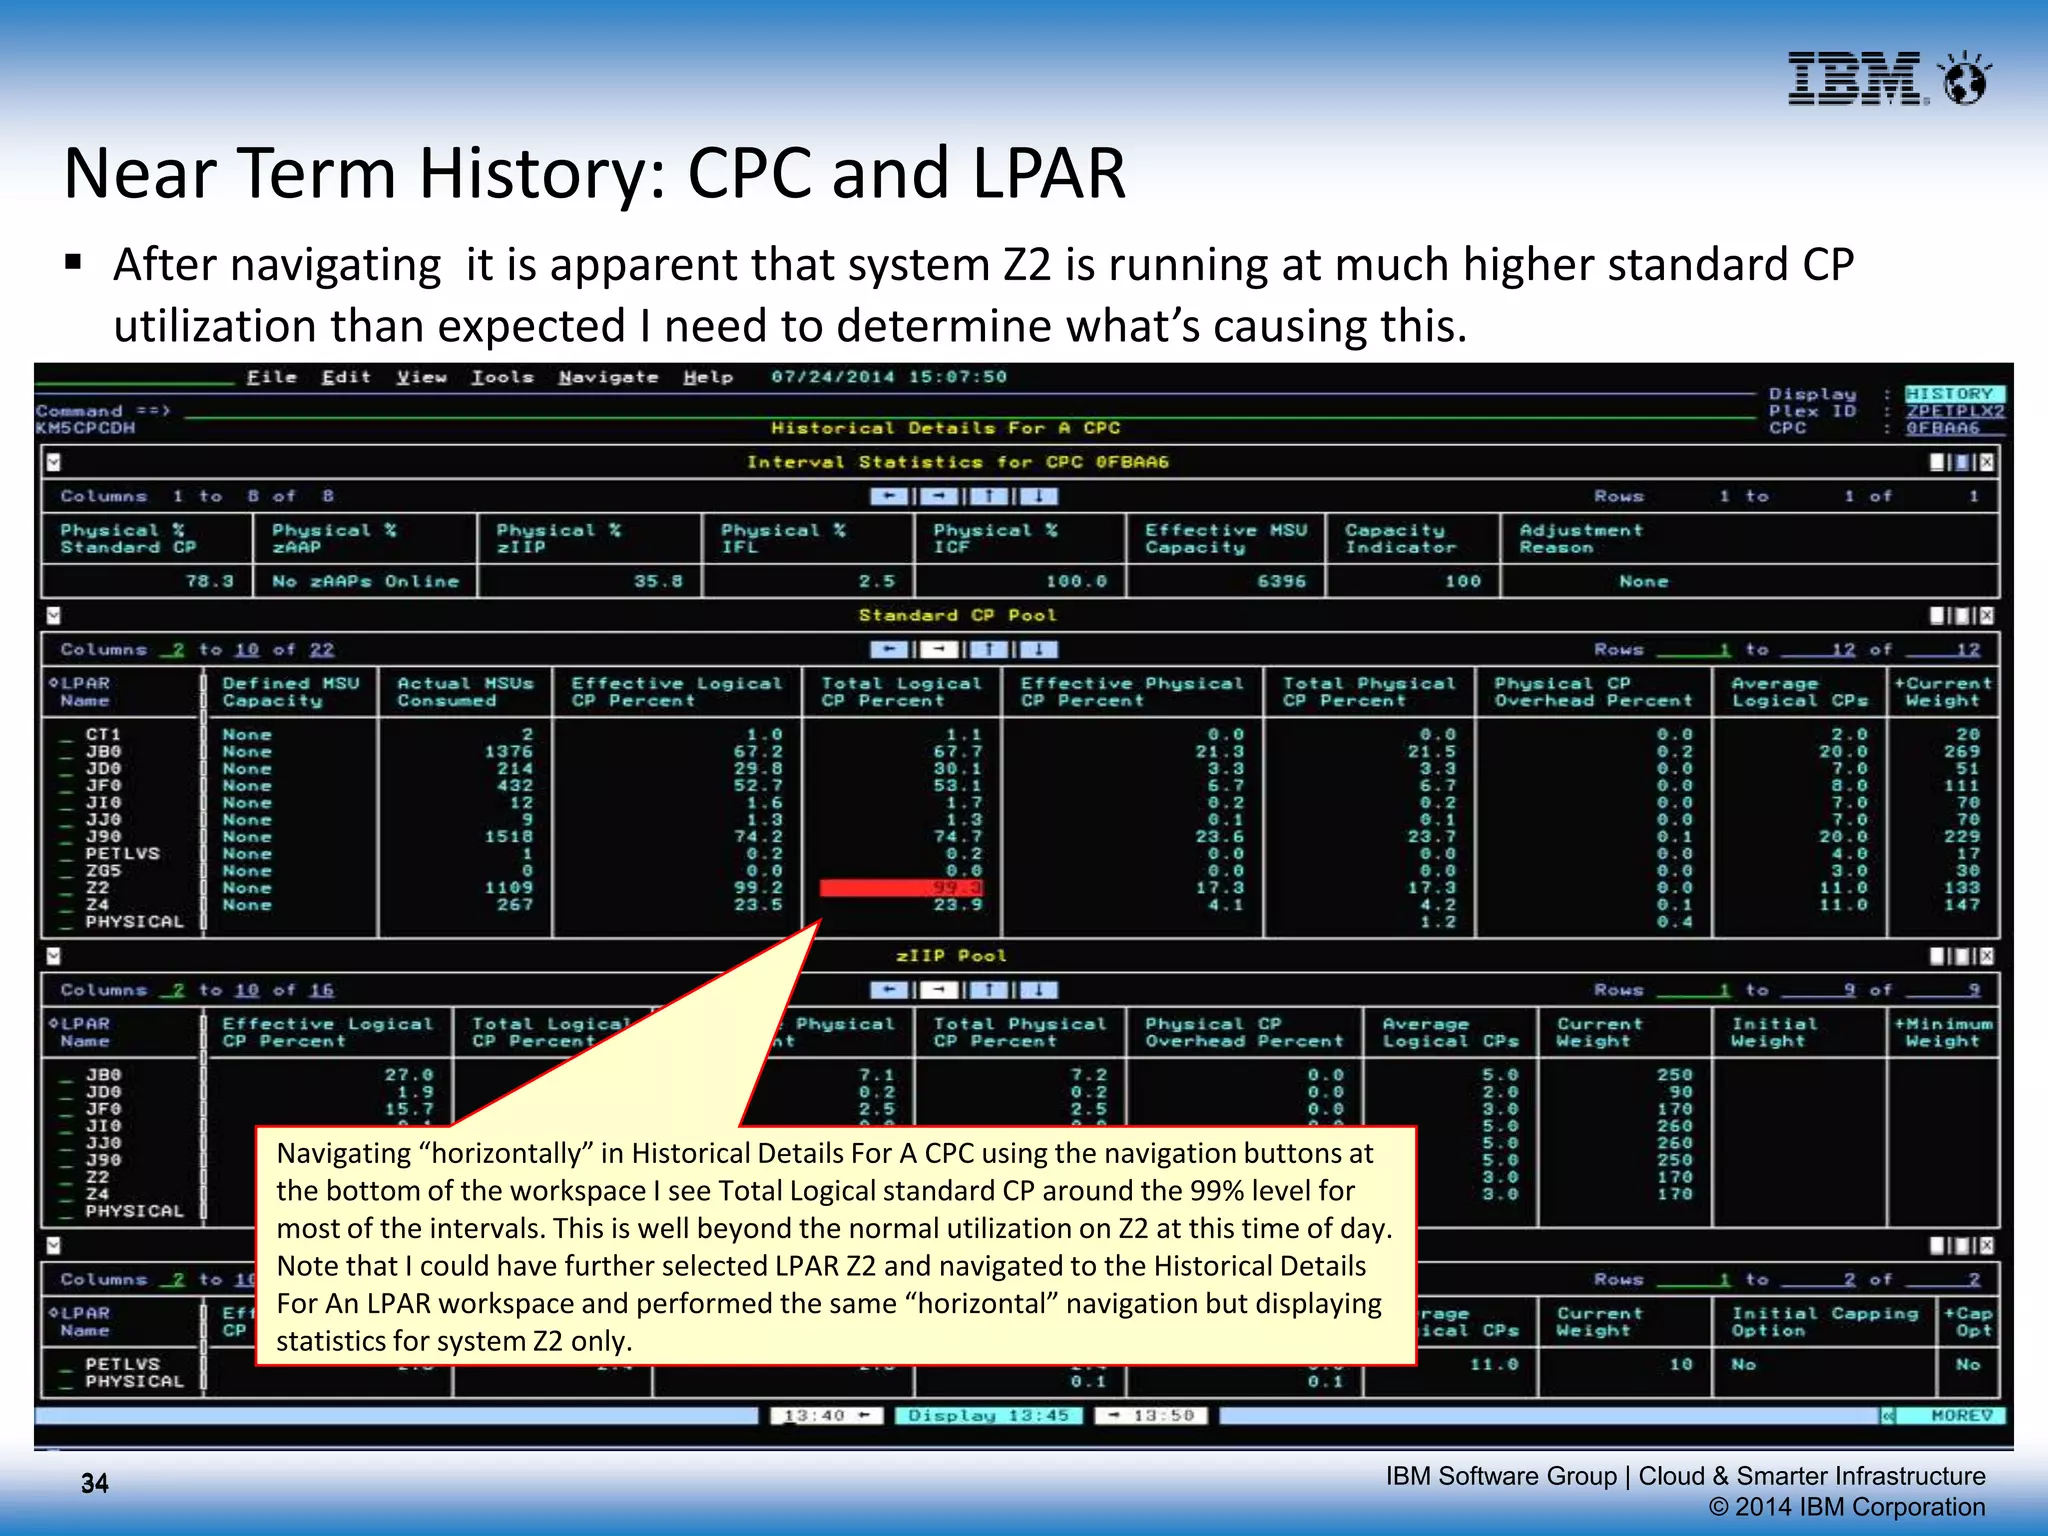
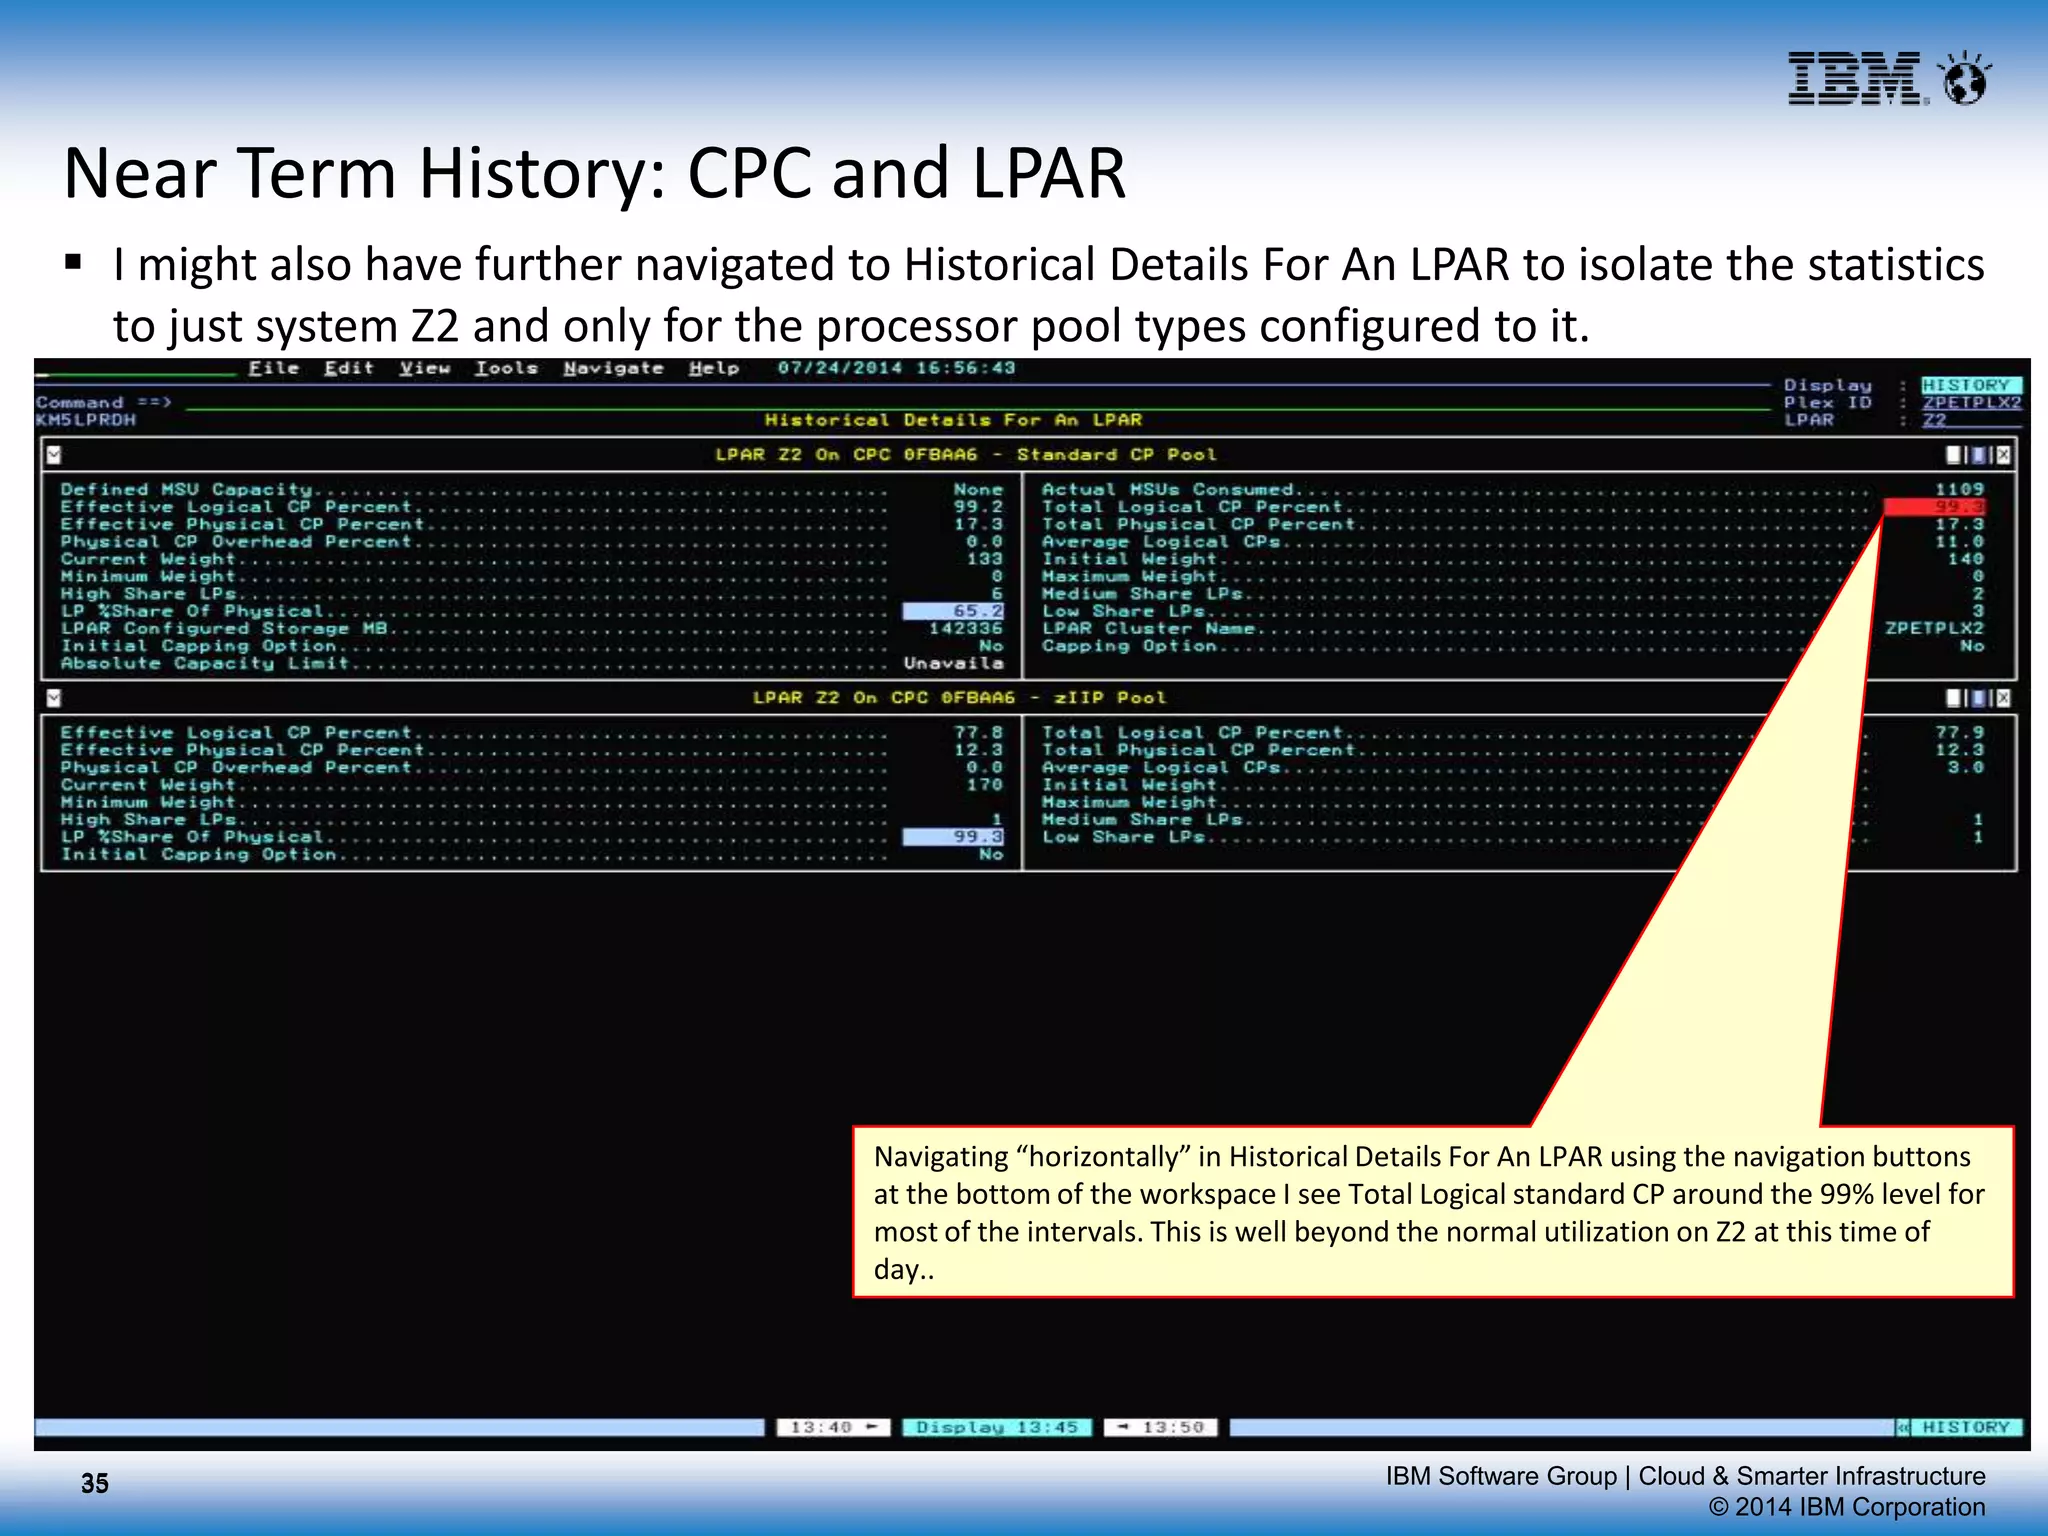


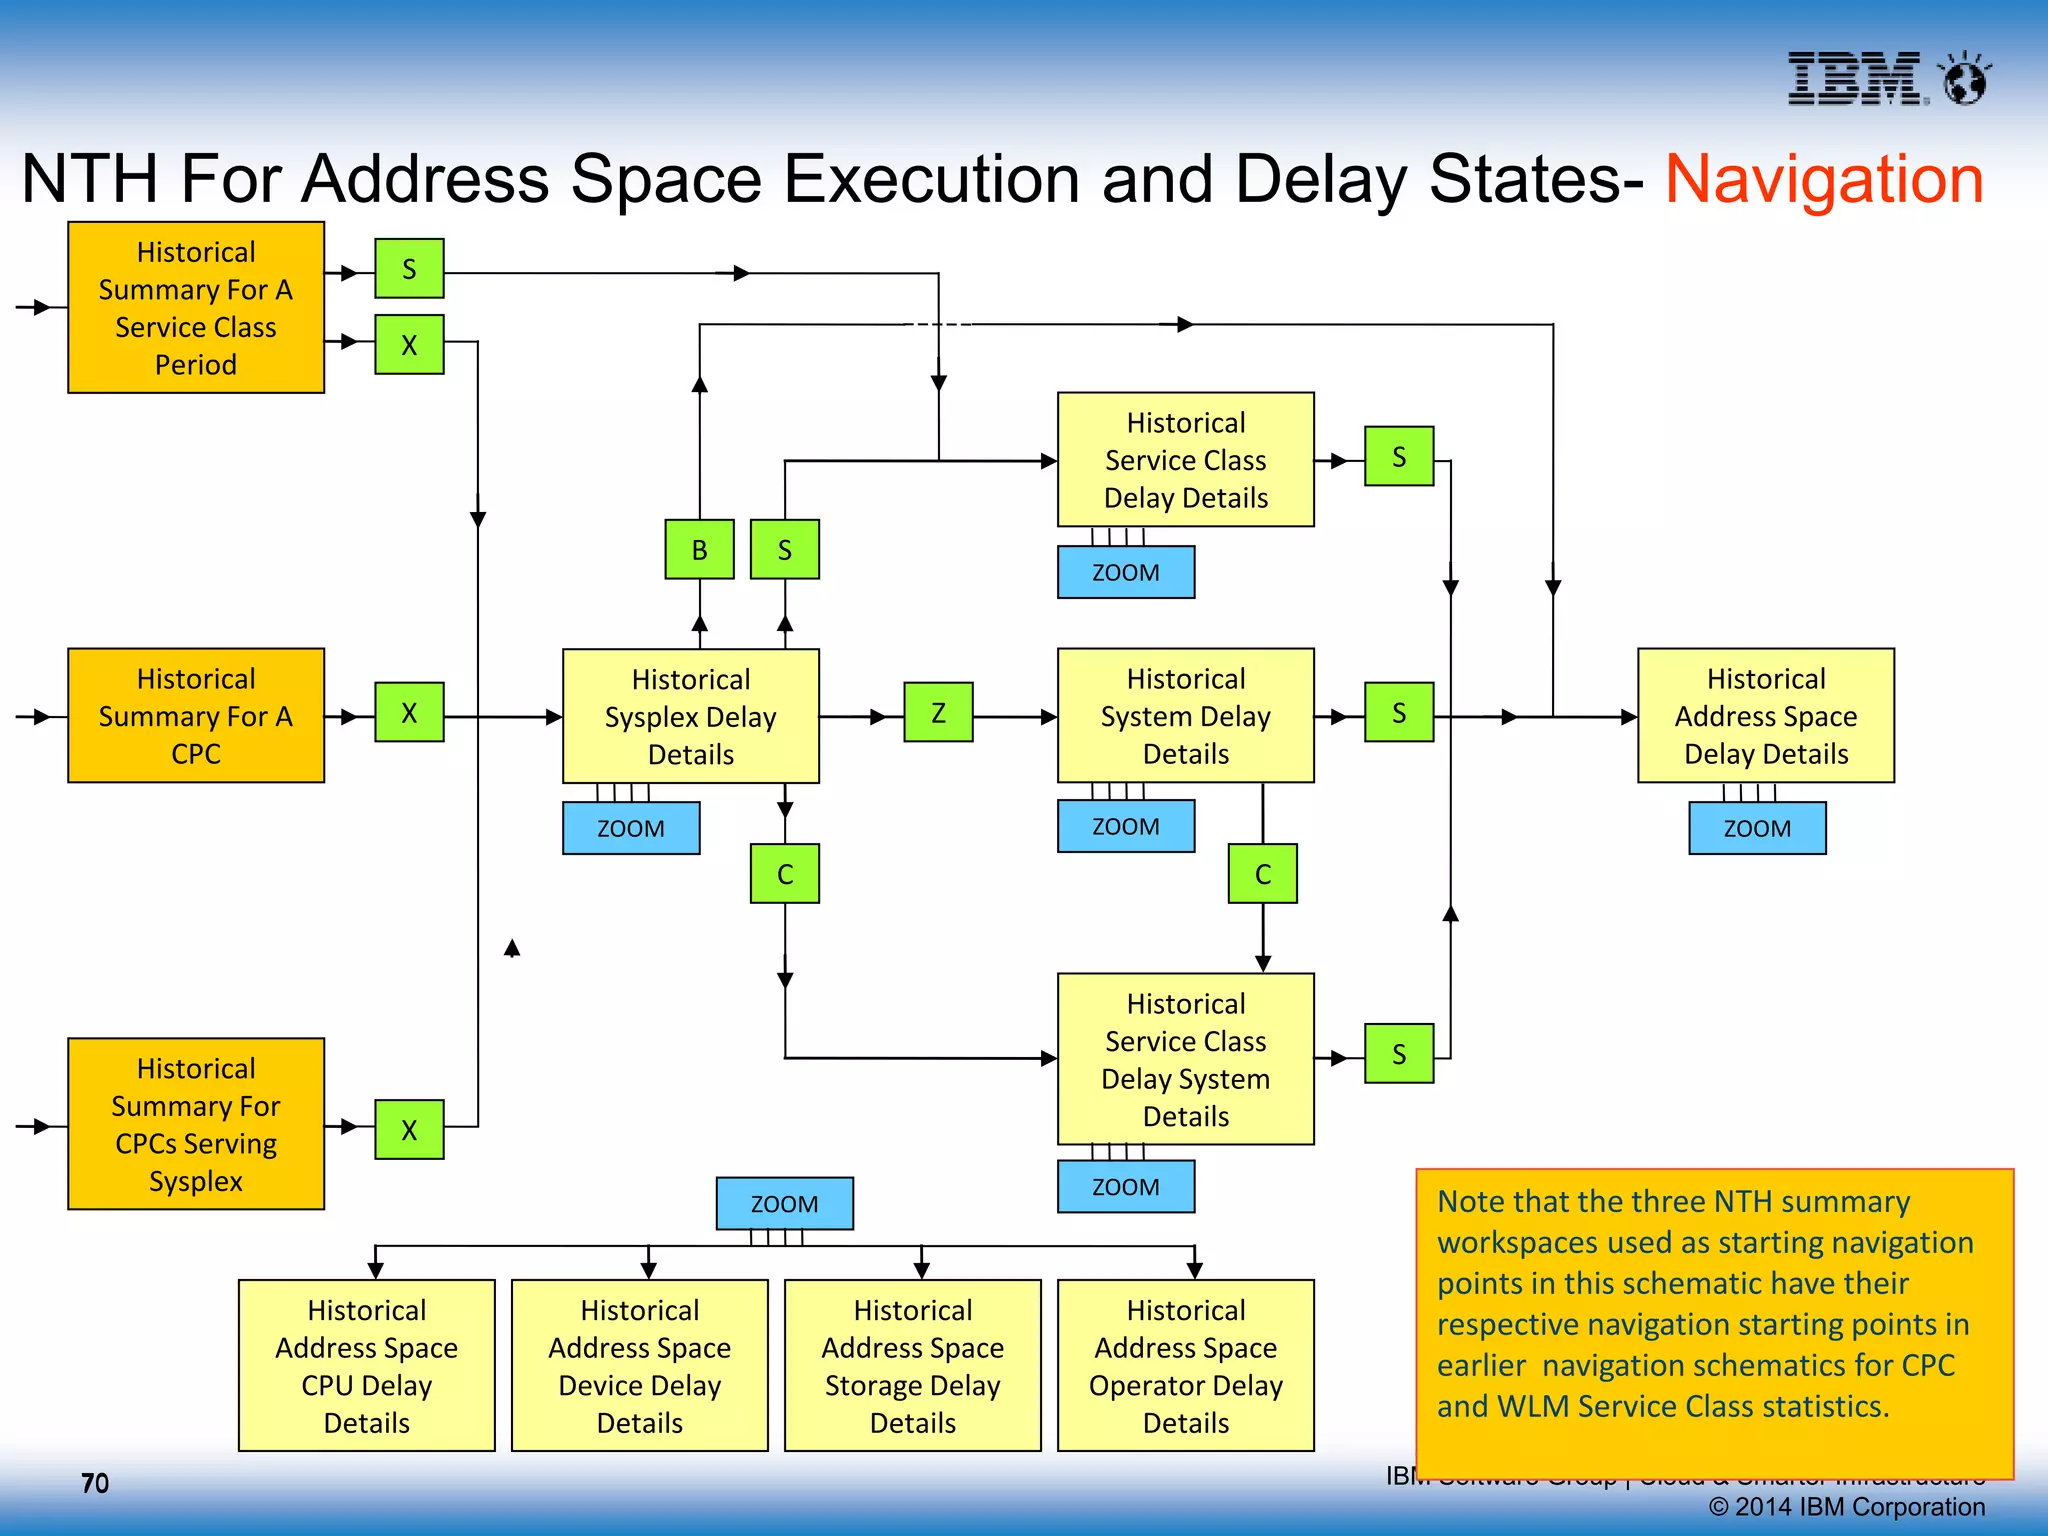
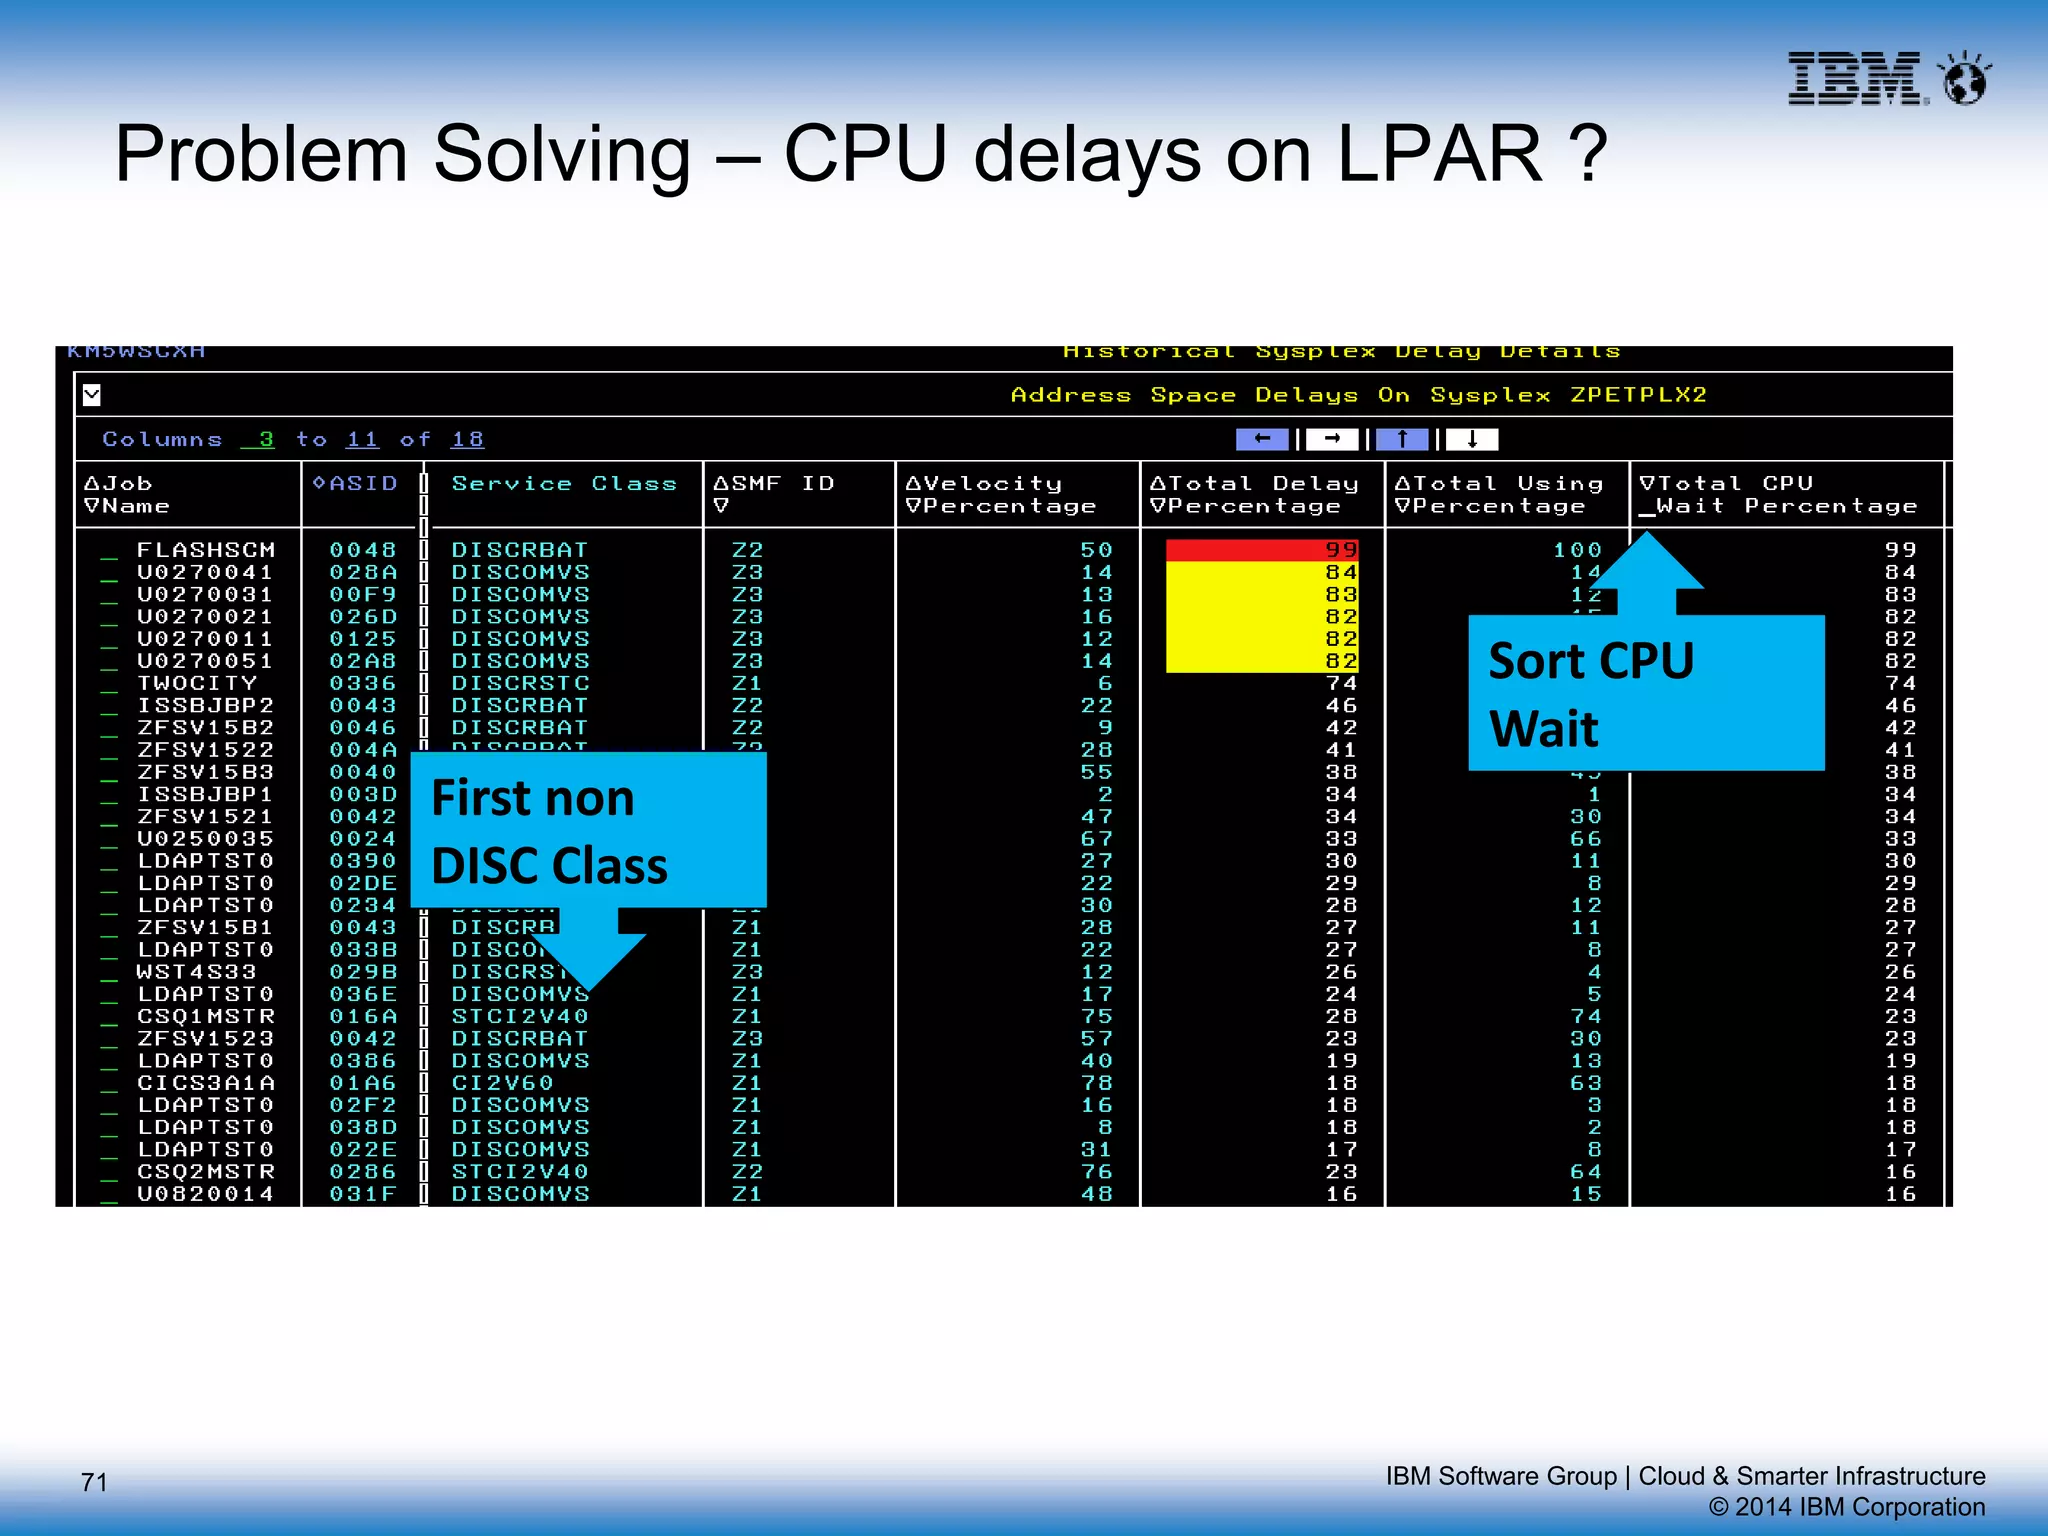


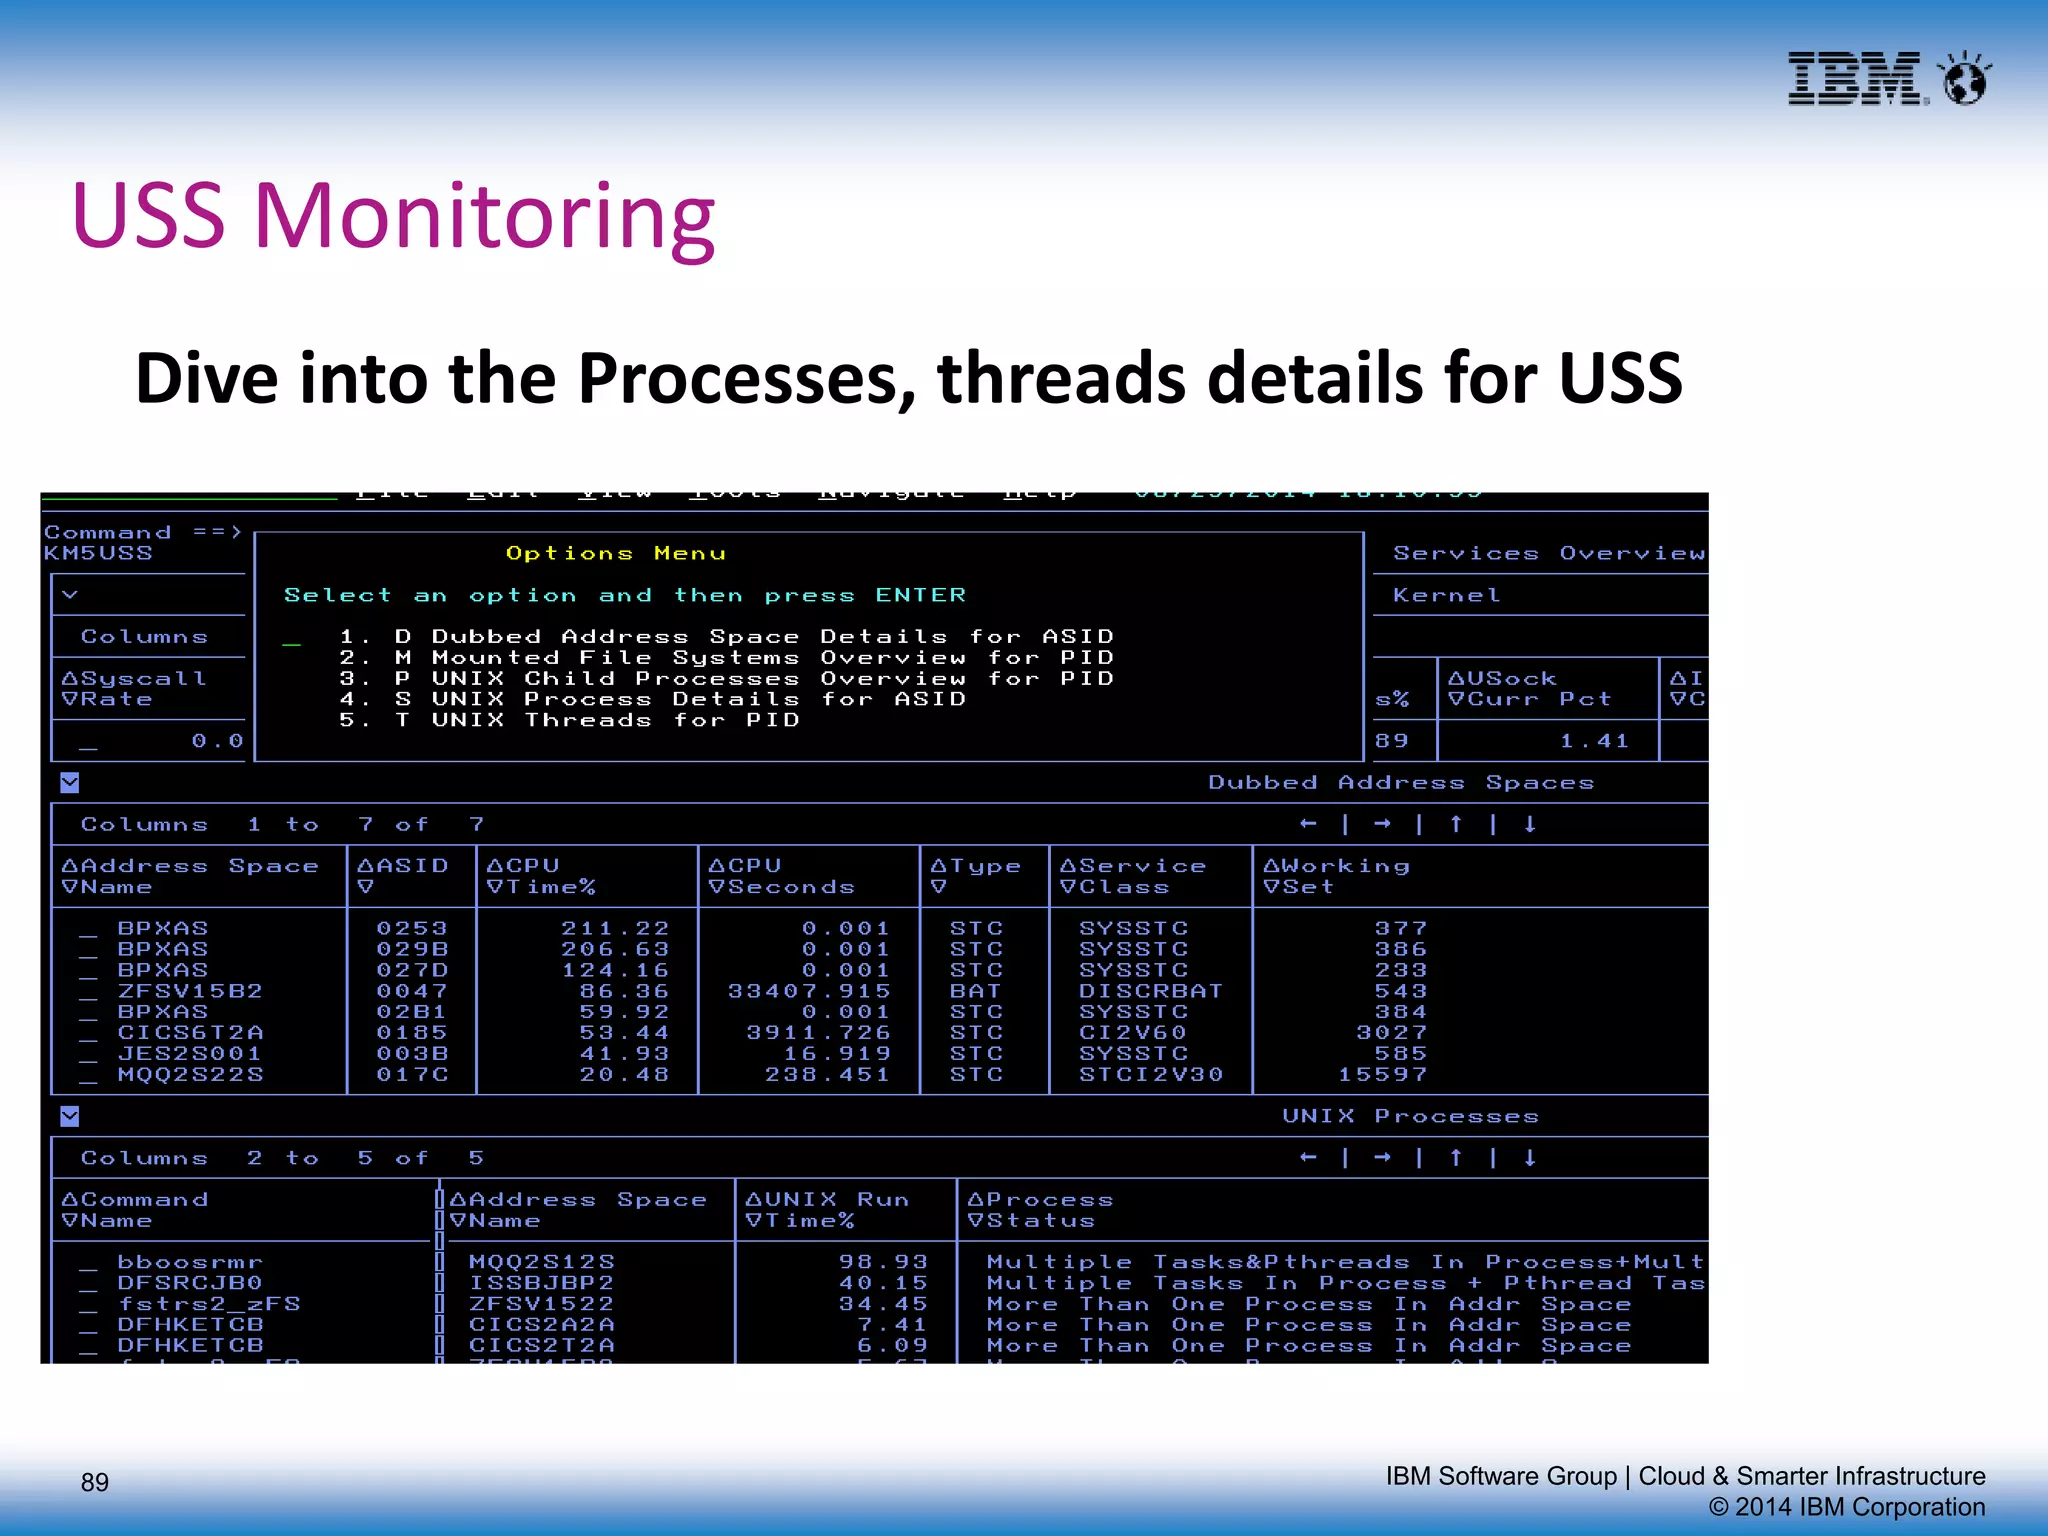


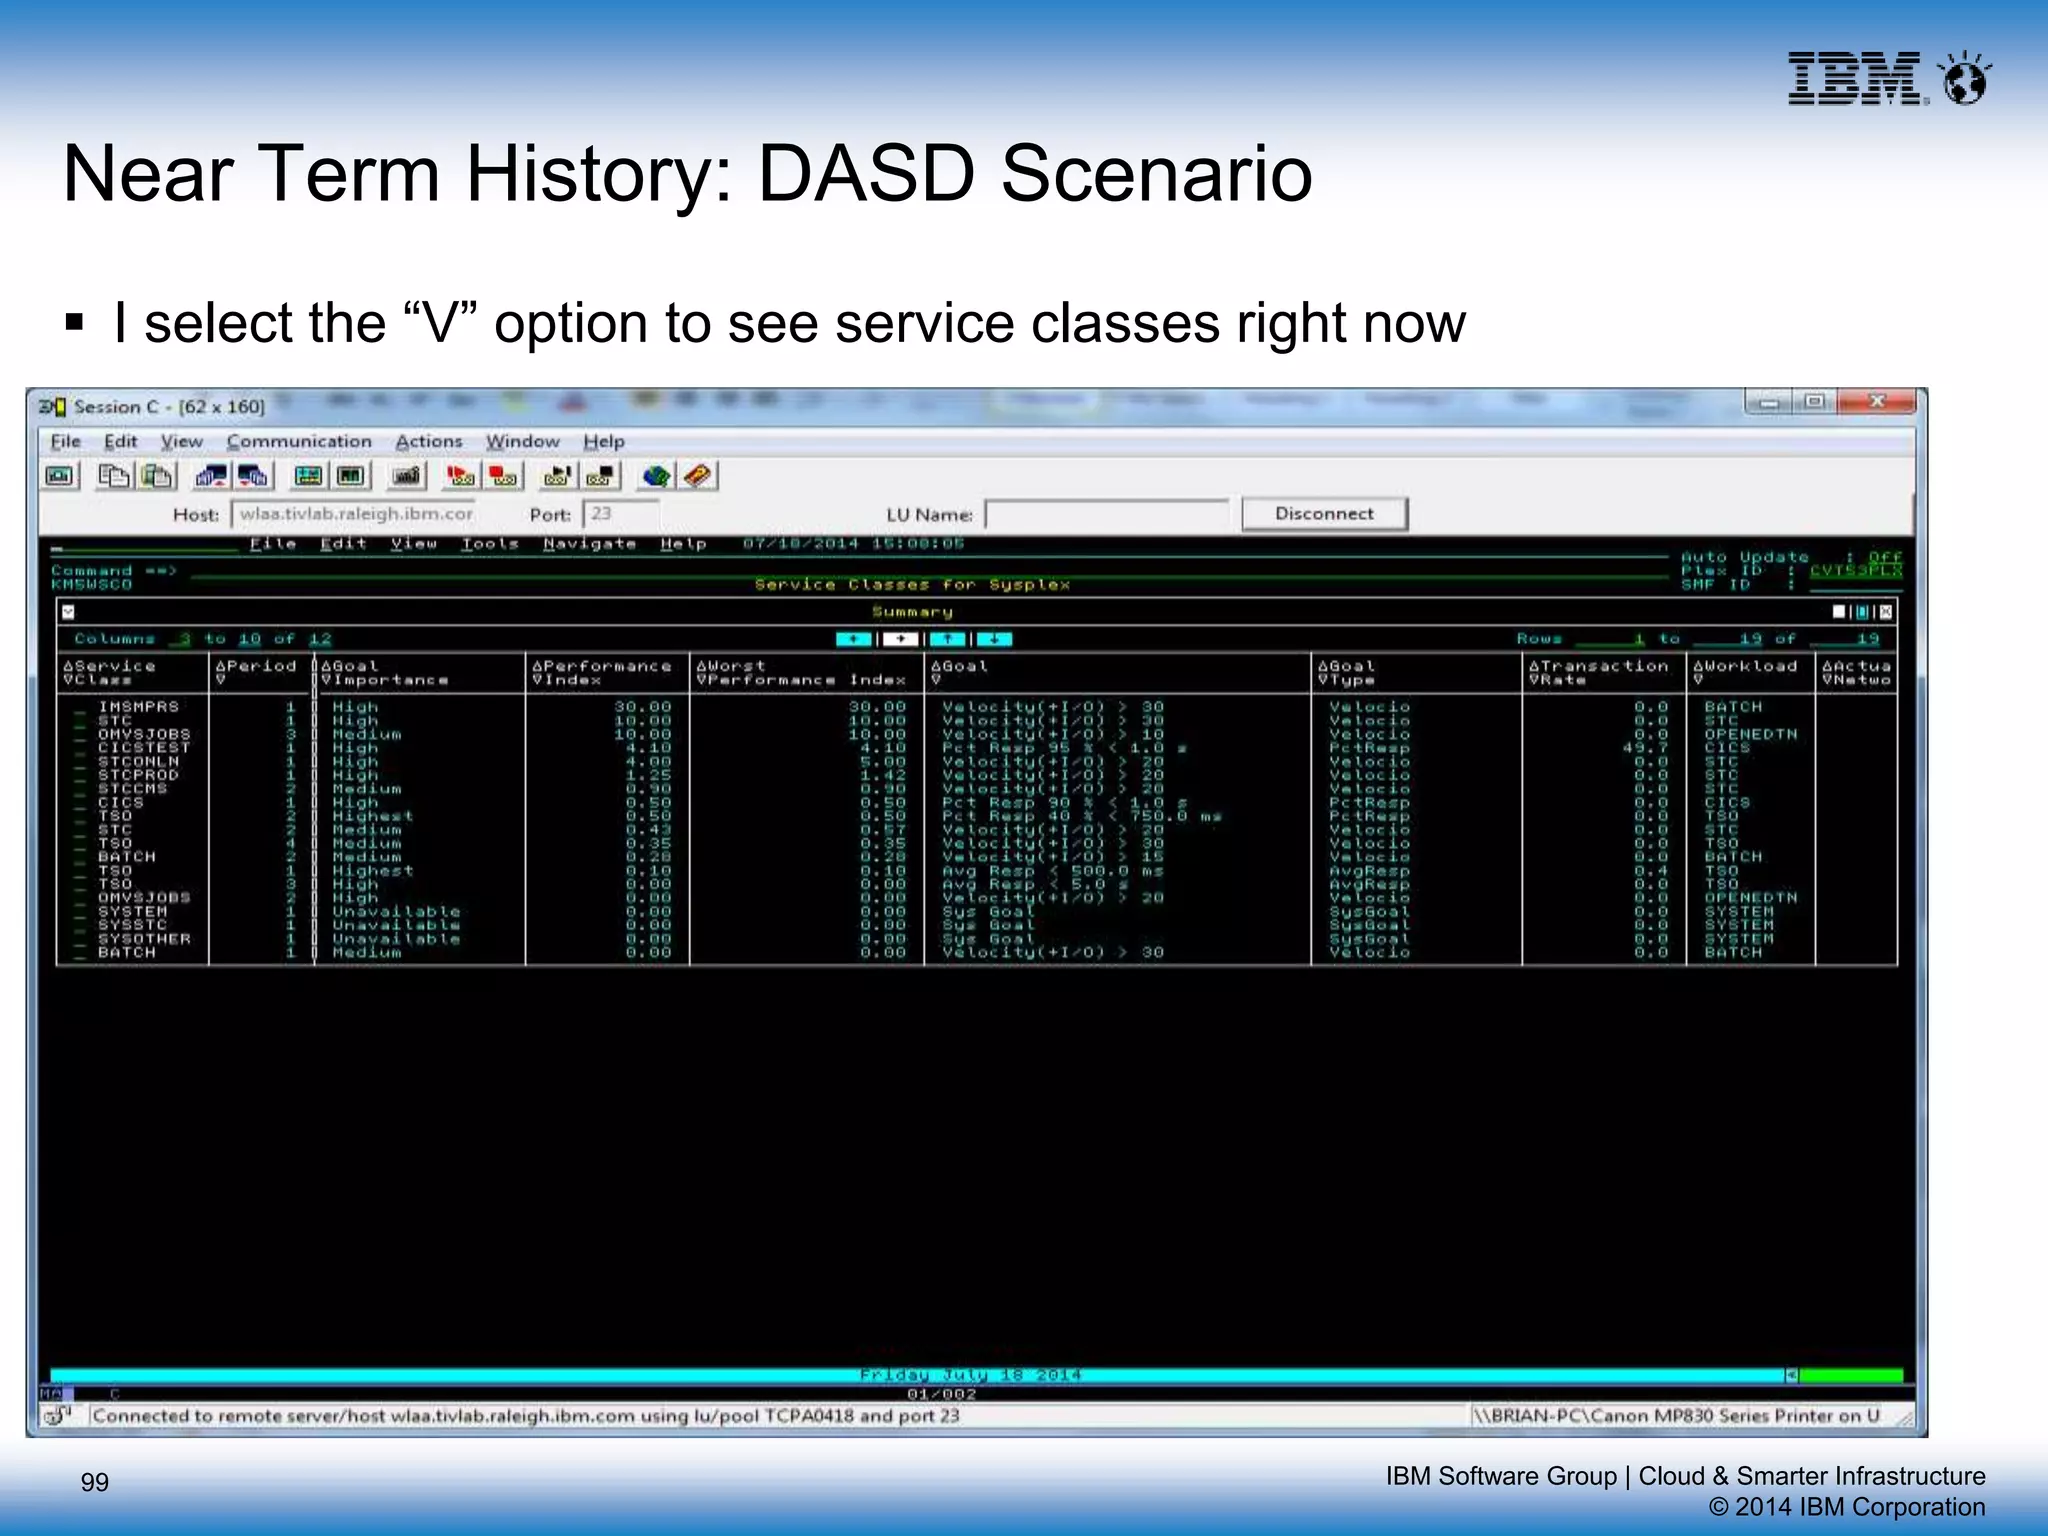


This document discusses the use of Near-Term History (NTH) features in IBM's OMEGAMON XE on z/OS v5.3 to investigate performance issues on a z/OS system. It provides an example where a systems programmer receives a report of response time problems on LPAR Z2 between 1-2pm. The programmer navigates through various NTH workspaces in the Enhanced 3270 User Interface to view historical CPU utilization details for the relevant time period at the CPC and LPAR level in order to identify high utilization on LPAR Z2 as the potential cause. The document demonstrates how NTH allows drilling down from the CPC to LPAR level to help troubleshoot reported