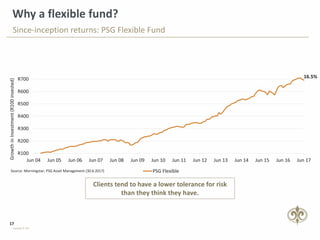
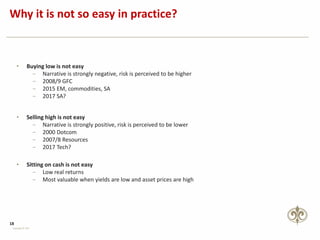
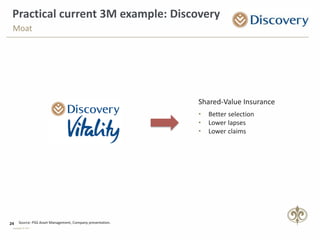
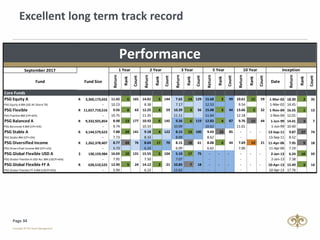
Copyright © PSG
PSG Asset Management
-Finding opportunities in volatile markets-
2
Copyright © PSG
A world of black and white thinking
3
Copyright © PSG
Black or white
• Pic of Donald trump: half black half white
• (cliffy)
Black
o r
White?
4
Copyright © PSG
2016: a lesson in grey thinking and storytelling
5
Copyright © PSG
The dangers for our clients
6
Copyright © PSG
Dangers when investing
1. Forecasting
2. Constructing portfolios based on narratives
7
Copyright © PSG
1. Forecasting
Forecasting is not an investment strategy
70%
Event
70%
Monetise
x = 49%
Success
8
Copyright © PSG
2. Constructing portfolios based on narratives
Recent narratives, often the wrong decision at the wrong time
“I don’t own US stocks because I think Trump will
win”
“I don’t own resources because Chinese growth is
slowing down”
“I don’t own government bonds because SA is
facing more ratings downgrades ”
9
Copyright © PSG
Constructing portfolios when facing binary risks
• How does one construct portfolios when one faces large event risks?
o State capture (including the SARB)
o Vote of no confidence
o ANC National Conference
o Potential sovereign downgrades
• Don’t take binary bets
o The odds are not in your favour
• This is a difficult environment to make short-term decisions, though a good environment to make
long-term decisions
• Focus on second-level thinking (price)
10
Copyright © PSG
The PSG Asset Management way
11
Copyright © PSG
Moat
Management
Margin of
Safety
QUALITY
ASSESMENT
PRICE
Our equity philosophy
A simple checklist to keep us focused
We assess the quality of a company and determine whether it is trading at a high margin
of safety compared to its intrinsic value
12
Copyright © PSG
Portfolio Construction
•Investment has to clear the right hurdle above inflation
•3 M process
Absolute Return mindset
•Team vetted buy-lists with conviction levels
•Backed by proprietary in-depth research
Bottom-up driven
•Building portfolios which have the best chance of meeting goals across several scenarios
•Avoid the need for binary outcomes
•Diversify – mindful of correlated views
Succeed across scenarios
•Ongoing review and “step back” by portfolio manager
•Internal peer review
Feedback loop
Solid principles within an iterative process
13
Copyright © PSG
Investing in times of turbulence
• Don’t forecast, and keep the stories for the dinner table…
• Think long-term
• Patience
• Grab the opportunities that arise in times of panic
• Stay invested, but diversify
14
Copyright © PSG
Results of a bottom up, disciplined process
15
Copyright © PSG
Source: I-Net, PSG Asset Management
Implementing our philosophy
Equity-like returns at lower levels of risk
PE of Fund has always been lower than that of the JSE All Share Index (“ALSI”). Current PE of
14,6 is in line with the long term average PE of 11,1
6
7
8
9
10
11
12
13
14
15
16
17
18
19
20
21
22
23
24
25
0%
20%
40%
60%
80%
100%
Jun-05 Jun-06 Jun-07 Jun-08 Jun-09 Jun-10 Jun-11 Jun-12 Jun-13 Jun-14 Jun-15 Jun-16 Jun-17
PERatio
Assetallocation%
% Cash Ave Cash Since Inception PE - Flexible Fund
PE - ALSI Ave PE Fund Ave PE ALSI
16
Copyright © PSG
Delivering on our clients’ objectives over the long run
Annualised performance to 30 September 2017 after fees, including income:
PSG Flexible Fund Fund Sector Rank Ave cash*
FTSE/ JSE
ALSI
Since inception (1 Nov 04) 16,6% 1st
out of 13 26.6% 16,2%
10 years 13,7% 2nd
out of 32 25.5% 9,5%
5 years 15,1% 3rd
out of 44 28.7% 12,5%
3 years 10,4% 3rd
out of 56 31.7% 7,2%
1 year 9,6% 3rd
out of 63 28.3% 10,2%
Volatility (5 years) 7,8% 10,9%
Source: Morningstar, Inc. All Rights Reserved; PSG Asset Management Research
*-based on 30th June 2017 data
17
Copyright © PSG
Source: Morningstar; PSG Asset Management (30.6.2017)
Why a flexible fund?
Since-inception returns: PSG Flexible Fund
R100
R200
R300
R400
R500
R600
R700
Jun 04 Jun 05 Jun 06 Jun 07 Jun 08 Jun 09 Jun 10 Jun 11 Jun 12 Jun 13 Jun 14 Jun 15 Jun 16 Jun 17
GrowthinInvestment(R100invested)
PSG Flexible
16.5%
Clients tend to have a lower tolerance for risk
than they think they have.
18
Copyright © PSG
Why it is not so easy in practice?
• Sitting on cash is not easy
‒ Low real returns
‒ Most valuable when yields are low and asset prices are high
• Selling high is not easy
‒ Narrative is strongly positive, risk is perceived to be lower
‒ 2000 Dotcom
‒ 2007/8 Resources
‒ 2017 Tech?
• Buying low is not easy
‒ Narrative is strongly negative, risk is perceived to be higher
‒ 2008/9 GFC
‒ 2015 EM, commodities, SA
‒ 2017 SA?
19
Copyright © PSG
PSG Flexible Fund: Finding opportunities outside Top 40
A result of contrarian, bottom-up investing
Source: PSG Asset Management, Statpro, JSE Cap Classification
* - Not in ALSI
Small
9%
Large
19%
Offshore
Equity
22%
Cash
26%
*
2%
Mid
22%
PSG FLEXIBLE
Large
81%
Mid
15%
Small
4%
ALSI
20
Copyright © PSG
PSG Global Flexible Fund
Diversified across sectors and geographies
Materials
6%
Industrials
10%
Consumer
Discretionary
5%
Consumer
Staples
3%
Financials
20%
Banks
8%
Information
Technology
11%
Telecoms
3%
Utilities
4%
Cash
30%
USA
30%
UK
13%
EU
3%
Canada
7%
Asia
10%
Japan
4%
Africa
3%
Cash
30%
21
Copyright © PSG
Margin of safety applied consistently
PSG Global Flexible Fund
Source: I-Net & PSG AM
PE of Fund has always been lower than that of the MSCI World Index
The PSG Global Flexible Fund follows the same
process and philosophy as the PSG Flexible fund
0%
5%
10%
15%
20%
25%
30%
35%
40%
45%
50%
8.0
10.0
12.0
14.0
16.0
18.0
20.0
22.0
24.0
Jun
13
Aug
13
Oct
13
Dec
13
Feb
14
Apr
14
Jun
14
Aug
14
Oct
14
Dec
14
Feb
15
Apr
15
Jun
15
Aug
15
Oct
15
Dec
15
Feb
16
Apr
16
Jun
16
Aug
16
Oct
16
Dec
16
Feb
17
Apr
17
Jun
17
Assetallocation%
PERatio
Cash MXWO Index PSG Global Flexible
22
Copyright © PSG
Source: Morningstar, Inc. All Rights Reserved; PSG Asset Management
PSG Global Flexible Fund
Outcome of flexible 3M process
$12,592
$10,863
7%
12%
17%
22%
27%
32%
37%
42%
47%
$8,000
$8,500
$9,000
$9,500
$10,000
$10,500
$11,000
$11,500
$12,000
$12,500
$13,000
Jan 13 Jul 13 Jan 14 Jul 14 Jan 15 Jul 15 Jan 16 Jul 16 Jan 17
AssetAllocation
InvestmentGrowth($10000invested)
Cash Exposure PSG Global Flexible USD A GIFS OE USD Flexible Allocation
6months 1year 2years 3years since inception
Category Rank 72/ 145 5/ 129 9/ 103 16/ 73 10/ 57
23
Copyright © PSG
Our process in practice – current examples:
MOAT, MANAGEMENT, MARGIN OF SAFETY
24
Copyright © PSG
Source: PSG Asset Management, Company presentation.
Practical current 3M example: Discovery
Moat
• Better selection
• Lower lapses
• Lower claims
Shared-Value Insurance
25
Copyright © PSG
Practical current 3M example: Discovery
• Founder-managed
• Aligned
• Track record of disrupting and scaling businesses in competitive markets
Management
26
Copyright © PSG
Practical current 3M example: Discovery
• Optically expensive: P/E ratio 20x
• We believe earnings power is understated
• Partner markets and Ping An for free?
Margin of Safety
27
Copyright © PSG
Practical current 3M example: Brookfield
• Founded in 1899
• Manager of $250 billion in physical (real) assets – in 30 countries
• Real estate, infrastructure, renewable power, private equity
• Major differentiator:
‒ 70 000-strong workforce
‒ $50bn of controlled listed partnership capital and $27bn of own capital
• Benefiting from increased allocation to real assets
• Poor prospective returns from fixed income and equities
‒ Real assets primarily state funded – governments in poor financial positions
Moat
28
Copyright © PSG
Practical current 3M example: Brookfield
Excellent management
• Significant alignment
‒ $5.1bn exposure by management
• Strong track record
‒ 5-year CAGR: fee bearing capital +11%, +37% in fee-related earnings
• Management invest in counter-cyclical manner
‒ Value investors, often contrarian, long time horizon
‒ Superb capital allocation track record  per share value creation focus
Management
29
Copyright © PSG
Source: Bloomberg, company reports, PSG Asset Management
Practical current 3M example: Brookfield
Margin of safety: Considerable upside potential with limited downside
0
10
20
30
40
50
60
2011 2012 2013 2014 2015 2016 2017
Grow net flows by target
Achieve targeted long-
term return average
Static net flows (very
conservative)
Achieve targeted long-term
return average
Miss target returns, no
carried interest.
Half multiple on fee related
earnings
30
Copyright © PSG
Be greedy when others are fearful…
Opportunities arise in times of panic
“Every decade or so, dark clouds
will fill the economic skies, and they
will briefly rain gold. When
downpours of that sort occur, it’s
imperative that we rush outdoors
carrying washtubs, not teaspoons.
And that we will do….”
Berkshire Hathaway shareholder letter 2017
31
Copyright © PSG
Conclusion
32
Copyright © PSG
The importance of staying invested
Invested amount after a market decline
PSGAM,Morningstar
* - STeFI 12 Month NCD ZAR
Recession (Dec 07- Jun 09)
R350.57
R310.43
R171.98
R50
R100
R150
R200
R250
R300
R350
R400
30-Sep-07
31-Dec-07
31-Mar-08
30-Jun-08
30-Sep-08
31-Dec-08
31-Mar-09
30-Jun-09
30-Sep-09
31-Dec-09
31-Mar-10
30-Jun-10
30-Sep-10
31-Dec-10
31-Mar-11
30-Jun-11
30-Sep-11
31-Dec-11
31-Mar-12
30-Jun-12
30-Sep-12
31-Dec-12
31-Mar-13
30-Jun-13
30-Sep-13
31-Dec-13
31-Mar-14
30-Jun-14
30-Sep-14
31-Dec-14
31-Mar-15
30-Jun-15
30-Sep-15
31-Dec-15
31-Mar-16
30-Jun-16
30-Sep-16
31-Dec-16
31-Mar-17
30-Jun-17
InvestmentGrowth(R100invested)
Stay invested in PSG Flexible
Exit PSG Flexible and reinvest after 1 year
Exit PSG Flexible and invest in cash*
33
Copyright © PSG
Conclusion
• We are contrarian, bottom up investors
• Favourable environment for long-term stock picking:
- Valuation divergences
- Very poor sentiment towards domestic stocks
• We continue to avoid stocks with elevated valuations
• Funds have sufficient cash that act as a buffer
• We urge investors to recognize the:
- Inherent dangers of trying to forecast
- Danger of building a narrative portfolio
Page 34
Excellent long term track record
September 2017
Fund Fund Size
Return
Rank
Count
Return
Rank
Count
Return
Rank
Count
Return
Rank
Count
Return
Rank
Count
Date
Return
Rank
Count
Core Funds
PSG Equity A 3,360,173,655R 11.42 6 165 14.01 5 144 7.65 14 129 15.68 3 99 10.61 12 59 1-Mar-02 18.30 2 35
PSG Equity A BM (JSE All Share TR) - 10.23 8.38 7.17 12.53 9.54 1-Mar-02 14.45
PSG Flexible 11,657,710,516R 9.56 8 63 12.25 4 59 10.39 3 56 15.08 3 44 13.66 2 32 1-Nov-04 16.55 1 13
PSG Flexible BM (CPI+6%) - 10.75 11.35 11.11 11.64 12.18 1-Nov-04 12.01
PSG Balanced A 9,332,925,854R 8.98 13 177 10.93 6 145 9.26 6 119 12.83 4 87 9.76 12 44 1-Jun-99 14.41 3 7
PSG Balanced A BM (CPI+5%) - 9.74 10.33 10.09 10.62 11.01 1-Jun-99 10.60
PSG Stable A 4,144,579,623R 7.88 24 141 9.18 4 122 8.15 13 100 9.43 23 85 - - - 13-Sep-11 9.87 27 74
PSG Stable BM (CPI+3%) - 7.73 8.33 8.09 8.62 - 13-Sep-11 8.52
PSG Diversified Income 1,262,378,407R 8.77 24 76 8.64 17 70 8.15 18 61 8.08 6 44 7.69 13 21 11-Apr-06 7.95 9 18
PSG Diversified Income BM (CPI+1%) - 5.73 6.33 6.09 6.62 7.00 11-Apr-06 7.19
PSG Global Flexible USD A 130,159,984$ 16.69 10 131 15.55 5 104 5.10 17 75 - - - - - - 2-Jan-13 6.24 10 59
PSG Global Flexible A USD Acc BM (USCPI+6%) - 7.95 7.50 7.07 - - 2-Jan-13 7.38
PSG Global Flexible FF A 628,510,525R 12.90 5 24 14.12 2 21 10.83 7 18 - - - - - - 10-Apr-13 15.49 3 14
PSG Global Flexible FF A BM (USCPI+6%) - 5.99 6.23 13.62 - - 10-Apr-13 17.76
Performance
3 Year 5 Year Inception1 Year 2 Year 10 Year
Copyright © PSG
PSG Asset Management (Pty) Ltd is an authorised financial services provider. FSP 29524

PSG Asset Management

  • 1.
    Copyright © PSG PSGAsset Management -Finding opportunities in volatile markets-
  • 2.
    2 Copyright © PSG Aworld of black and white thinking
  • 3.
    3 Copyright © PSG Blackor white • Pic of Donald trump: half black half white • (cliffy) Black o r White?
  • 4.
    4 Copyright © PSG 2016:a lesson in grey thinking and storytelling
  • 5.
    5 Copyright © PSG Thedangers for our clients
  • 6.
    6 Copyright © PSG Dangerswhen investing 1. Forecasting 2. Constructing portfolios based on narratives
  • 7.
    7 Copyright © PSG 1.Forecasting Forecasting is not an investment strategy 70% Event 70% Monetise x = 49% Success
  • 8.
    8 Copyright © PSG 2.Constructing portfolios based on narratives Recent narratives, often the wrong decision at the wrong time “I don’t own US stocks because I think Trump will win” “I don’t own resources because Chinese growth is slowing down” “I don’t own government bonds because SA is facing more ratings downgrades ”
  • 9.
    9 Copyright © PSG Constructingportfolios when facing binary risks • How does one construct portfolios when one faces large event risks? o State capture (including the SARB) o Vote of no confidence o ANC National Conference o Potential sovereign downgrades • Don’t take binary bets o The odds are not in your favour • This is a difficult environment to make short-term decisions, though a good environment to make long-term decisions • Focus on second-level thinking (price)
  • 10.
    10 Copyright © PSG ThePSG Asset Management way
  • 11.
    11 Copyright © PSG Moat Management Marginof Safety QUALITY ASSESMENT PRICE Our equity philosophy A simple checklist to keep us focused We assess the quality of a company and determine whether it is trading at a high margin of safety compared to its intrinsic value
  • 12.
    12 Copyright © PSG PortfolioConstruction •Investment has to clear the right hurdle above inflation •3 M process Absolute Return mindset •Team vetted buy-lists with conviction levels •Backed by proprietary in-depth research Bottom-up driven •Building portfolios which have the best chance of meeting goals across several scenarios •Avoid the need for binary outcomes •Diversify – mindful of correlated views Succeed across scenarios •Ongoing review and “step back” by portfolio manager •Internal peer review Feedback loop Solid principles within an iterative process
  • 13.
    13 Copyright © PSG Investingin times of turbulence • Don’t forecast, and keep the stories for the dinner table… • Think long-term • Patience • Grab the opportunities that arise in times of panic • Stay invested, but diversify
  • 14.
    14 Copyright © PSG Resultsof a bottom up, disciplined process
  • 15.
    15 Copyright © PSG Source:I-Net, PSG Asset Management Implementing our philosophy Equity-like returns at lower levels of risk PE of Fund has always been lower than that of the JSE All Share Index (“ALSI”). Current PE of 14,6 is in line with the long term average PE of 11,1 6 7 8 9 10 11 12 13 14 15 16 17 18 19 20 21 22 23 24 25 0% 20% 40% 60% 80% 100% Jun-05 Jun-06 Jun-07 Jun-08 Jun-09 Jun-10 Jun-11 Jun-12 Jun-13 Jun-14 Jun-15 Jun-16 Jun-17 PERatio Assetallocation% % Cash Ave Cash Since Inception PE - Flexible Fund PE - ALSI Ave PE Fund Ave PE ALSI
  • 16.
    16 Copyright © PSG Deliveringon our clients’ objectives over the long run Annualised performance to 30 September 2017 after fees, including income: PSG Flexible Fund Fund Sector Rank Ave cash* FTSE/ JSE ALSI Since inception (1 Nov 04) 16,6% 1st out of 13 26.6% 16,2% 10 years 13,7% 2nd out of 32 25.5% 9,5% 5 years 15,1% 3rd out of 44 28.7% 12,5% 3 years 10,4% 3rd out of 56 31.7% 7,2% 1 year 9,6% 3rd out of 63 28.3% 10,2% Volatility (5 years) 7,8% 10,9% Source: Morningstar, Inc. All Rights Reserved; PSG Asset Management Research *-based on 30th June 2017 data
  • 17.
    17 Copyright © PSG Source:Morningstar; PSG Asset Management (30.6.2017) Why a flexible fund? Since-inception returns: PSG Flexible Fund R100 R200 R300 R400 R500 R600 R700 Jun 04 Jun 05 Jun 06 Jun 07 Jun 08 Jun 09 Jun 10 Jun 11 Jun 12 Jun 13 Jun 14 Jun 15 Jun 16 Jun 17 GrowthinInvestment(R100invested) PSG Flexible 16.5% Clients tend to have a lower tolerance for risk than they think they have.
  • 18.
    18 Copyright © PSG Whyit is not so easy in practice? • Sitting on cash is not easy ‒ Low real returns ‒ Most valuable when yields are low and asset prices are high • Selling high is not easy ‒ Narrative is strongly positive, risk is perceived to be lower ‒ 2000 Dotcom ‒ 2007/8 Resources ‒ 2017 Tech? • Buying low is not easy ‒ Narrative is strongly negative, risk is perceived to be higher ‒ 2008/9 GFC ‒ 2015 EM, commodities, SA ‒ 2017 SA?
  • 19.
    19 Copyright © PSG PSGFlexible Fund: Finding opportunities outside Top 40 A result of contrarian, bottom-up investing Source: PSG Asset Management, Statpro, JSE Cap Classification * - Not in ALSI Small 9% Large 19% Offshore Equity 22% Cash 26% * 2% Mid 22% PSG FLEXIBLE Large 81% Mid 15% Small 4% ALSI
  • 20.
    20 Copyright © PSG PSGGlobal Flexible Fund Diversified across sectors and geographies Materials 6% Industrials 10% Consumer Discretionary 5% Consumer Staples 3% Financials 20% Banks 8% Information Technology 11% Telecoms 3% Utilities 4% Cash 30% USA 30% UK 13% EU 3% Canada 7% Asia 10% Japan 4% Africa 3% Cash 30%
  • 21.
    21 Copyright © PSG Marginof safety applied consistently PSG Global Flexible Fund Source: I-Net & PSG AM PE of Fund has always been lower than that of the MSCI World Index The PSG Global Flexible Fund follows the same process and philosophy as the PSG Flexible fund 0% 5% 10% 15% 20% 25% 30% 35% 40% 45% 50% 8.0 10.0 12.0 14.0 16.0 18.0 20.0 22.0 24.0 Jun 13 Aug 13 Oct 13 Dec 13 Feb 14 Apr 14 Jun 14 Aug 14 Oct 14 Dec 14 Feb 15 Apr 15 Jun 15 Aug 15 Oct 15 Dec 15 Feb 16 Apr 16 Jun 16 Aug 16 Oct 16 Dec 16 Feb 17 Apr 17 Jun 17 Assetallocation% PERatio Cash MXWO Index PSG Global Flexible
  • 22.
    22 Copyright © PSG Source:Morningstar, Inc. All Rights Reserved; PSG Asset Management PSG Global Flexible Fund Outcome of flexible 3M process $12,592 $10,863 7% 12% 17% 22% 27% 32% 37% 42% 47% $8,000 $8,500 $9,000 $9,500 $10,000 $10,500 $11,000 $11,500 $12,000 $12,500 $13,000 Jan 13 Jul 13 Jan 14 Jul 14 Jan 15 Jul 15 Jan 16 Jul 16 Jan 17 AssetAllocation InvestmentGrowth($10000invested) Cash Exposure PSG Global Flexible USD A GIFS OE USD Flexible Allocation 6months 1year 2years 3years since inception Category Rank 72/ 145 5/ 129 9/ 103 16/ 73 10/ 57
  • 23.
    23 Copyright © PSG Ourprocess in practice – current examples: MOAT, MANAGEMENT, MARGIN OF SAFETY
  • 24.
    24 Copyright © PSG Source:PSG Asset Management, Company presentation. Practical current 3M example: Discovery Moat • Better selection • Lower lapses • Lower claims Shared-Value Insurance
  • 25.
    25 Copyright © PSG Practicalcurrent 3M example: Discovery • Founder-managed • Aligned • Track record of disrupting and scaling businesses in competitive markets Management
  • 26.
    26 Copyright © PSG Practicalcurrent 3M example: Discovery • Optically expensive: P/E ratio 20x • We believe earnings power is understated • Partner markets and Ping An for free? Margin of Safety
  • 27.
    27 Copyright © PSG Practicalcurrent 3M example: Brookfield • Founded in 1899 • Manager of $250 billion in physical (real) assets – in 30 countries • Real estate, infrastructure, renewable power, private equity • Major differentiator: ‒ 70 000-strong workforce ‒ $50bn of controlled listed partnership capital and $27bn of own capital • Benefiting from increased allocation to real assets • Poor prospective returns from fixed income and equities ‒ Real assets primarily state funded – governments in poor financial positions Moat
  • 28.
    28 Copyright © PSG Practicalcurrent 3M example: Brookfield Excellent management • Significant alignment ‒ $5.1bn exposure by management • Strong track record ‒ 5-year CAGR: fee bearing capital +11%, +37% in fee-related earnings • Management invest in counter-cyclical manner ‒ Value investors, often contrarian, long time horizon ‒ Superb capital allocation track record  per share value creation focus Management
  • 29.
    29 Copyright © PSG Source:Bloomberg, company reports, PSG Asset Management Practical current 3M example: Brookfield Margin of safety: Considerable upside potential with limited downside 0 10 20 30 40 50 60 2011 2012 2013 2014 2015 2016 2017 Grow net flows by target Achieve targeted long- term return average Static net flows (very conservative) Achieve targeted long-term return average Miss target returns, no carried interest. Half multiple on fee related earnings
  • 30.
    30 Copyright © PSG Begreedy when others are fearful… Opportunities arise in times of panic “Every decade or so, dark clouds will fill the economic skies, and they will briefly rain gold. When downpours of that sort occur, it’s imperative that we rush outdoors carrying washtubs, not teaspoons. And that we will do….” Berkshire Hathaway shareholder letter 2017
  • 31.
  • 32.
    32 Copyright © PSG Theimportance of staying invested Invested amount after a market decline PSGAM,Morningstar * - STeFI 12 Month NCD ZAR Recession (Dec 07- Jun 09) R350.57 R310.43 R171.98 R50 R100 R150 R200 R250 R300 R350 R400 30-Sep-07 31-Dec-07 31-Mar-08 30-Jun-08 30-Sep-08 31-Dec-08 31-Mar-09 30-Jun-09 30-Sep-09 31-Dec-09 31-Mar-10 30-Jun-10 30-Sep-10 31-Dec-10 31-Mar-11 30-Jun-11 30-Sep-11 31-Dec-11 31-Mar-12 30-Jun-12 30-Sep-12 31-Dec-12 31-Mar-13 30-Jun-13 30-Sep-13 31-Dec-13 31-Mar-14 30-Jun-14 30-Sep-14 31-Dec-14 31-Mar-15 30-Jun-15 30-Sep-15 31-Dec-15 31-Mar-16 30-Jun-16 30-Sep-16 31-Dec-16 31-Mar-17 30-Jun-17 InvestmentGrowth(R100invested) Stay invested in PSG Flexible Exit PSG Flexible and reinvest after 1 year Exit PSG Flexible and invest in cash*
  • 33.
    33 Copyright © PSG Conclusion •We are contrarian, bottom up investors • Favourable environment for long-term stock picking: - Valuation divergences - Very poor sentiment towards domestic stocks • We continue to avoid stocks with elevated valuations • Funds have sufficient cash that act as a buffer • We urge investors to recognize the: - Inherent dangers of trying to forecast - Danger of building a narrative portfolio
  • 34.
    Page 34 Excellent longterm track record September 2017 Fund Fund Size Return Rank Count Return Rank Count Return Rank Count Return Rank Count Return Rank Count Date Return Rank Count Core Funds PSG Equity A 3,360,173,655R 11.42 6 165 14.01 5 144 7.65 14 129 15.68 3 99 10.61 12 59 1-Mar-02 18.30 2 35 PSG Equity A BM (JSE All Share TR) - 10.23 8.38 7.17 12.53 9.54 1-Mar-02 14.45 PSG Flexible 11,657,710,516R 9.56 8 63 12.25 4 59 10.39 3 56 15.08 3 44 13.66 2 32 1-Nov-04 16.55 1 13 PSG Flexible BM (CPI+6%) - 10.75 11.35 11.11 11.64 12.18 1-Nov-04 12.01 PSG Balanced A 9,332,925,854R 8.98 13 177 10.93 6 145 9.26 6 119 12.83 4 87 9.76 12 44 1-Jun-99 14.41 3 7 PSG Balanced A BM (CPI+5%) - 9.74 10.33 10.09 10.62 11.01 1-Jun-99 10.60 PSG Stable A 4,144,579,623R 7.88 24 141 9.18 4 122 8.15 13 100 9.43 23 85 - - - 13-Sep-11 9.87 27 74 PSG Stable BM (CPI+3%) - 7.73 8.33 8.09 8.62 - 13-Sep-11 8.52 PSG Diversified Income 1,262,378,407R 8.77 24 76 8.64 17 70 8.15 18 61 8.08 6 44 7.69 13 21 11-Apr-06 7.95 9 18 PSG Diversified Income BM (CPI+1%) - 5.73 6.33 6.09 6.62 7.00 11-Apr-06 7.19 PSG Global Flexible USD A 130,159,984$ 16.69 10 131 15.55 5 104 5.10 17 75 - - - - - - 2-Jan-13 6.24 10 59 PSG Global Flexible A USD Acc BM (USCPI+6%) - 7.95 7.50 7.07 - - 2-Jan-13 7.38 PSG Global Flexible FF A 628,510,525R 12.90 5 24 14.12 2 21 10.83 7 18 - - - - - - 10-Apr-13 15.49 3 14 PSG Global Flexible FF A BM (USCPI+6%) - 5.99 6.23 13.62 - - 10-Apr-13 17.76 Performance 3 Year 5 Year Inception1 Year 2 Year 10 Year
  • 35.
    Copyright © PSG PSGAsset Management (Pty) Ltd is an authorised financial services provider. FSP 29524