TORONTO REAL ESTATE SALES - APRIL 2018 (TREB)
•
1 like•100 views

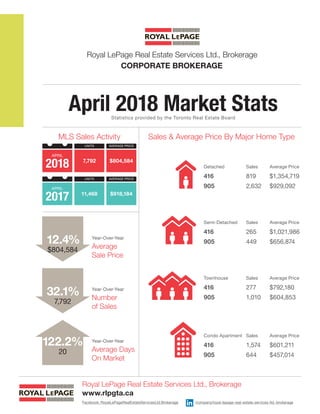
TORONTO, May 3, 2018 -- Toronto Real Estate Board President Tim Syrianos announced that Greater Toronto Area REALTORS® reported 7,792 sales through TREB's MLS® System in April 2018. The average selling price was $804,584. On a year-over-year basis, sales were down by 32.1 per cent and the average selling price was down by 12.4 per cent.

Recommended
Recommended
More Related Content
What's hot
What's hot (20)
Similar to TORONTO REAL ESTATE SALES - APRIL 2018 (TREB)
Similar to TORONTO REAL ESTATE SALES - APRIL 2018 (TREB) (20)
More from Shawn Venasse
More from Shawn Venasse (20)
Recently uploaded
Recently uploaded (20)
TORONTO REAL ESTATE SALES - APRIL 2018 (TREB)
- 1. 20 122.2% APRIL 2018 UNITS 7,792 AVERAGE PRICE $804,584 APRIL 2017 UNITS 11,468 AVERAGE PRICE $918,184 Royal LePage Real Estate Services Ltd., Brokerage CORPORATE BROKERAGE Year-Over-Year Average Sale Price Detached Sales Average Price 416 819 $1,354,719 905 2,632 $929,092 Semi-Detached Sales Average Price 416 265 $1,021,986 905 449 $656,874 Townhouse Sales Average Price 416 277 $792,180 905 1,010 $604,853 Condo Apartment Sales Average Price 416 1,574 $601,211 905 644 $457,014 Year-Over-Year Average Days On Market Year-Over-Year Number of Sales 7,792 $804,584 32.1% 12.4% Sales & Average Price By Major Home TypeMLS Sales Activity April 2018 Market StatsStatistics provided by the Toronto Real Estate Board Royal LePage Real Estate Services Ltd., Brokerage www.rlpgta.ca Facebook: RoyalLePageRealEstateServicesLtd.Brokerage /company/royal-lepage-real-estate-services-ltd.-brokerage
- 2. NEWS RELEASE Share this article TREB RELEASES MONTHLY MARKET FIGURES REPORTED BY GTA REALTORS® TORONTO, May 3, 2018 -- Toronto Real Estate Board President Tim Syrianos announced that Greater Toronto Area REALTORS® reported 7,792 sales through TREB's MLS® System in April 2018. The average selling price was $804,584. On a year-over-year basis, sales were down by 32.1 per cent and the average selling price was down by 12.4 per cent. The year-over-year change in the overall average selling price has been impacted by both changes in market conditions as well as changes in the type and price point of homes being purchased. This is especially clear at the higher end of the market. Detached home sales for $2 million or more accounted for 5.5 per cent of total detached sales in April 2018, versus 10 per cent in April 2017. The MLS® Home Price Index strips out the impact of changes in the mix of home sales from one year to the next. This is why the MLS® HPI Composite Benchmark was down by only 5.2 per cent year-over-year versus 12.4 per cent for the average price. "While average selling prices have not climbed back to last year's record peak, April's price level represents a substantial gain over the past decade. Recent polling conducted for TREB by Ipsos tells us that the great majority of buyers are purchasing a home within which to live. This means these buyers are treating home ownership as a long-term investment. A strong and diverse labour market and continued population growth based on immigration should continue to underpin long-term home price appreciation," said Mr. Syrianos. After preliminary seasonal adjustment1, the month-over-month change (i.e. March 2018 to April 2018) in sales and the average selling price was minimal, with sales decreasing 1.6 per cent and the average selling price decreasing by 0.2 per cent. The month-over-month sales trend has flattened out over the past two months following a steeper drop-off in January and February. "The comparison of this year's sales and price figures to last year's record peak masks the fact that market conditions should support moderate increases in home prices as we move through the second half of the year, particularly for condominium apartments and higher density low-rise home types. Once we are past the current policy-based volatility, home owners should expect to see the resumption of a moderate and sustained pace of price growth in line with a strong local economy and steady population growth," said Jason Mercer, TREB's Director of Market Analysis. Provincial Election Candidates Should Make Housing Issues a Top Priority With a provincial election campaign about to begin, GTA REALTORS® hope that all of the provincial parties will make housing issues a priority. Home ownership is a worthwhile investment that benefits our economy, individual finances and quality of life," said Mr. Syrianos "In recent months and years, there has been significant intervention in housing markets by all levels of government, through regulatory changes and taxation. We believe the next step should be tax relief, especially from Land Transfer Taxes, both provincial and the Toronto Land Transfer Tax, and efforts to facilitate an increase in the supply of missing middle housing that fills the gap between single family homes and high rises. Furthermore, we believe that any attempt to increase the Toronto Land Transfer Tax should require approval from the provincial government, given the significance of Toronto's economy
- 3. to the Province and the connections between the Toronto real estate market and that of the broader GTA," added Syrianos. Notes: 1 Preliminary seasonal adjustment undertaken by the Canadian Real Estate Association (CREA). Removing normal seasonal variations allows for more meaningful analysis of monthly changes and underlying trends. Summary of TREB MLS® Sales and Average Price April 1 - 30, 2018 2018 2017 Sales Average Price New Lis ngs Sales Average Price New Lis ngs City of Toronto ("416") 2,946 865,817 5,299 4,124 942,677 6,990 Rest of GTA ("905") 4,846 767,359 10,974 7,344 904,429 14,581 GTA 7,792 804,584 16,273 11,468 918,184 21,571 TREB MLS® Sales & Average Price By Home Type April 1 - 30, 2018 Sales Average Price 416 905 Total 416 905 Total Detached 819 2,632 3,451 1,354,719 929,092 1,030,103 Yr./Yr. % Change -34.3% -39.6% -38.4% -14.3% -15.2% -14.4% Semi-Detached 265 449 714 1,021,986 656,874 792,385 Yr./Yr. % Change -16.4% -35.2% -29.3% -7.8% -9.6% -6.4% Townhouse 277 1,010 1,287 792,180 604,853 645,172 Yr./Yr. % Change -26.5% -20.8% -22.1% 0.2% -10.1% -7.8% Condo Apartment 1,574 644 2,218 601,211 457,014 559,343 Yr./Yr. % Change -26.4% -24.9% -26.0% 3.8% 1.6% 3.2% April 2018 Year-Over-Year Per Cent Change in the MLS® HPI Composite (All Types) Single-Family Detached Single-Family A ached Townhouse Apartment TREB Total -5.15% -10.34% -8.82% -2.62% 10.17% Halton Region -5.07% -7.01% -6.28% -2.94% 5.87% Peel Region -5.63% -8.32% -7.77% -5.14% 5.97% City of Toronto 1.55% -9.55% -4.53% 3.67% 12.35% York Region -14.54% -16.68% -17.02% -8.95% 4.94% Durham Region -7.25% -7.53% -7.58% -8.22% 1.14% Orangeville 4.40% 4.29% 2.87% - - South Simcoe County1 -10.99% -12.06% -6.04% - - Source: Toronto Real Estate Board ,1South Simcoe includes Adjala-Tosoron o, Bradford West Gwillimbury, Essa, Innisfil and New Tecumseth Annual Summary of TREB MLS® Sales and Average Price Year-to-Date 2018 2017 Sales Average Price New Lis ngs Sales Average Price New Lis ngs City of Toronto ("416") 9,258 822,427 15,868 13,125 878,760 19,160 Rest of GTA ("905") 14,895 752,656 34,288 23,405 891,501 36,504 GTA 24,153 779,400 50,156 36,530 886,923 55,664
- 4. Toronto Employment Growth March 2018 3.2% Month April 2018 1 Year 3 Year 5 Year 3.34% 4.15% 5.14% April 2018 1 Year 3 Year 5 Year -- -- -- Market Watch For All TREB Member Inquiries: (416) 443-8158 For All Media/Public Inquiries: (416) 443-8152 GTA REALTORS® Release April Stats TORONTO, ONTARIO, May 3, 2018 – Toronto Real Estate Board President Tim Syrianos announced that Greater Toronto Area REALTORS® reported 7,792 sales through TREB’s MLS® System in April 2018. The average selling price was $804,584. On a year-over-year basis, sales were down by 32.1 per cent and the average selling price was down by 12.4 per cent. The year-over-year change in the overall average selling price has been impacted by both changes in market conditions as well as changes in the type and price point of homes being purchased. This is especially clear at the higher end of the market. Detached home sales for $2 million or more accounted for 5.5 per cent of total detached sales in April 2018, versus 10 per cent in April 2017. The MLS® Home Price Index strips out the impact of changes in the mix of home sales from one year to the next. This is why the MLS® HPI Composite Benchmark was down by only 5.2 per cent year-over-year versus 12.4 per cent for the average price. “While average selling prices have not climbed back to last year’s record peak, April’s price level represents a substantial gain over the past decade. Recent polling conducted for TREB by Ipsos tells us that the great majority of buyers are purchasing a home within which to live. This means these buyers are treating home ownership as a long-term investment. A strong and diverse labour market and continued population growth based on immigration should continue to underpin long-term home price appreciation,” said Mr. Syrianos. “The comparison of this year’s sales and price figures to last year’s record peak masks the fact that market conditions should support moderate increases in home prices as we move through the second half of the year, particularly for condominium apartments and higher density low-rise home types. Once we are past the current policy-based volatility, home owners should expect to see the resumption of a moderate and sustained pace of price growth in line with a strong local economy and steady population growth,” said Jason Mercer, TREB’s Director of Market Analysis. TREB MLS® Sales Activity 7,792 11,468 April 2018 April 2017 TREB MLS® Average Price $804,584 $918,184 April 2018 April 2017 Year-Over-Year Summary 2018 2017 % Chg. Sales New Listings Active Listings Average Price Average DOM 7,792 11,468 -32.1% 16,273 21,571 -24.6% 18,206 12,926 40.8% $804,584 $918,184 -12.4% 20 9 122.2% Sources and Notes: i - Statistics Canada, Quarter-over-quarter growth, annualized ii - Statistics Canada, Year-over-year growth for the most recently reported month iii - Bank of Canada, Rate from most recent Bank of Canada announcement iv - Bank of Canada, Rates for most recently completed month Real GDP Growth Q4 2017 -- 1.7% Toronto Unemployment Rate March 2018 -- 5.8% Inflation Rate (Yr./Yr. CPI Growth) March 2018 2.3% Bank of Canada Overnight Rate April 2018 -- 1.25% Prime Rate April 2018 -- 3.45% Economic Indicators Metrics Sales Average Price 416 905 Total 416 905 Total 2018 Detached Semi - Detached Townhouse Condo Apartment 819 2,632 3,451 $1,354,719 $929,092 $1,030,103 265 449 714 $1,021,986 $656,874 $792,385 277 1,010 1,287 $792,180 $604,853 $645,172 1,574 644 2,218 $601,211 $457,014 $559,343 Sales & Average Price By Major Home Type April 2018 April 2018 i ii ii iii iv Detached Semi - Detached Townhouse Condo Apartment -14.3% -15.2% -14.4% -7.8% -9.6% -6.4% 0.2% -10.1% -7.8% 3.8% 1.6% 3.2% Detached Semi - Detached Townhouse Condo Apartment -34.3% -39.6% -38.4% -16.4% -35.2% -29.3% -26.5% -20.8% -22.1% -26.4% -24.9% -26.0% 1,7 1,7 1,7 1,7 Year-Over-Year Per Cent Change Mortgage Rates
- 5. Toronto Real Estate Board Market Watch, April 2018 SALES BY PRICE RANGE AND HOUSE TYPE APRIL 2018 2 Price Range Detached Semi-Detached Att/Row/Twnhouse Condo Townhouse Condo Apt Link Co-op Apt Det Condo Co-ownership Apt Total $0 to $99,999 $100,000 to $199,999 $200,000 to $299,999 $300,000 to $399,999 $400,000 to $499,999 $500,000 to $599,999 $600,000 to $699,999 $700,000 to $799,999 $800,000 to $899,999 $900,000 to $999,999 $1,000,000 to $1,249,999 $1,250,000 to $1,499,999 $1,500,000 to $1,749,999 $1,750,000 to $1,999,999 $2,000,000+ 1 0 0 0 2 0 0 0 0 3 0 0 0 4 7 0 0 0 1 12 8 3 0 11 77 0 3 0 1 103 40 10 10 56 437 2 2 0 1 558 144 32 61 172 628 26 1 3 0 1,067 265 83 192 125 453 25 0 1 0 1,144 385 214 202 90 257 10 0 0 0 1,158 553 163 121 29 129 10 1 0 0 1,006 444 55 74 23 77 17 0 1 0 691 351 42 31 13 48 10 0 0 0 495 513 57 34 4 49 6 0 0 0 663 329 30 8 10 20 1 0 0 0 398 144 10 7 1 13 0 0 0 0 175 83 6 2 3 3 0 0 0 0 97 191 9 3 1 18 0 0 0 0 222 Price Range Detached Semi-Detached Att/Row/Twnhouse Condo Townhouse Condo Apt Link Co-op Apt Det Condo Co-ownership Apt Total $0 to $99,999 $100,000 to $199,999 $200,000 to $299,999 $300,000 to $399,999 $400,000 to $499,999 $500,000 to $599,999 $600,000 to $699,999 $700,000 to $799,999 $800,000 to $899,999 $900,000 to $999,999 $1,000,000 to $1,249,999 $1,250,000 to $1,499,999 $1,500,000 to $1,749,999 $1,750,000 to $1,999,999 $2,000,000+ 2 0 0 0 5 0 0 0 0 7 5 1 0 16 39 0 4 0 1 66 27 5 0 37 274 0 6 0 2 351 143 32 26 212 1,616 4 5 0 7 2,045 489 116 207 510 2,125 60 4 4 4 3,519 858 316 543 429 1,419 55 2 5 0 3,627 1,286 683 620 267 757 38 4 2 0 3,657 1,592 458 350 98 393 50 1 0 0 2,942 1,336 193 208 57 229 48 1 2 0 2,074 1,060 132 111 37 141 24 0 0 0 1,505 1,471 139 79 27 145 18 0 0 0 1,879 889 68 33 18 63 2 1 1 0 1,075 455 26 11 6 29 0 0 0 0 527 234 12 5 4 24 0 0 0 0 279 518 28 7 7 39 0 0 1 0 600 SALES BY PRICE RANGE AND HOUSE TYPE YEAR-TO-DATE, 2018 Total Sales Share of Total Sales Average Price 3,451 714 745 542 2,218 107 7 5 3 7,792 44.3% 9.2% 9.6% 7.0% 28.5% 1.4% 0.1% 0.1% 0.0% 100.0% $1,030,103 $792,385 $698,510 $571,856 $559,343 $669,793 $376,143 $536,600 $244,000 $804,584 Total Sales Share of Total Sales Average Price 10,365 2,209 2,200 1,725 7,298 299 28 15 14 24,153 42.9% 9.1% 9.1% 7.1% 30.2% 1.2% 0.1% 0.1% 0.1% 100.0% $1,007,335 $769,807 $692,711 $564,641 $541,280 $689,832 $437,766 $771,393 $356,536 $779,400 1,7 1,7
- 6. Toronto Real Estate Board Market Watch, April 2018 Number of Sales Dollar Volume Average Price Median Price New Listings SNLR (Trend) Active Listings Mos. Inv. (Trend) Avg. SP / LP Avg. DOM TREB Total Halton Region Burlington Halton Hills Milton Oakville Peel Region Brampton Caledon Mississauga City of Toronto Toronto West Toronto Central Toronto East York Region Aurora E. Gwillimbury Georgina King Markham Newmarket Richmond Hill Vaughan Whitchurch-Stouffville Durham Region Ajax Brock Clarington Oshawa Pickering Scugog Uxbridge Whitby Dufferin County Orangeville Simcoe County Adjala-Tosorontio Bradford West GwillimburyEssa Innisfil New Tecumseth 7,792 $6,269,321,360 804,584 $684,900 16,273 46.2% 18,206 2.5 99% 20 779 $661,613,615 849,311 $760,000 1,689 47.8% 2,097 2.6 98% 22 229 $173,105,019 755,917 $693,500 454 53.5% 531 2.4 97% 23 77 $58,627,150 761,392 $760,000 160 60.5% 153 1.7 99% 17 189 $133,835,038 708,122 $669,999 366 48.9% 406 2.1 99% 18 284 $296,046,408 1,042,417 $925,500 709 41.1% 1,007 3.4 97% 26 1,689 $1,225,535,554 725,598 $670,000 3,211 46.2% 3,175 2.4 98% 19 807 $567,490,508 703,210 $670,000 1,519 43.9% 1,400 2.4 99% 18 91 $87,607,575 962,721 $835,000 192 42.0% 264 3.6 97% 31 791 $570,437,471 721,160 $649,000 1,500 49.1% 1,511 2.2 98% 19 2,946 $2,550,698,152 865,817 $685,000 5,299 55.6% 4,785 1.9 102% 16 766 $620,784,215 810,423 $701,000 1,439 56.8% 1,318 1.9 103% 18 1,479 $1,403,694,891 949,084 $655,000 2,611 56.9% 2,387 1.9 101% 15 701 $526,219,046 750,669 $724,000 1,249 52.1% 1,080 1.9 103% 16 1,149 $1,080,520,029 940,400 $855,000 3,499 32.1% 5,132 4.4 97% 26 77 $74,587,568 968,670 $890,000 266 29.7% 363 4.6 97% 21 48 $39,567,300 824,319 $725,250 172 23.5% 283 7.4 97% 42 56 $33,331,900 595,213 $533,750 185 30.4% 313 5.1 96% 33 22 $31,510,000 1,432,273 $1,325,000 114 25.4% 236 7.7 96% 50 306 $278,431,765 909,908 $881,500 782 35.7% 1,051 3.7 98% 26 104 $82,450,277 792,791 $757,500 314 30.8% 483 4.3 97% 27 200 $207,465,664 1,037,328 $934,500 654 29.5% 969 4.8 96% 24 286 $285,870,755 999,548 $899,500 824 34.9% 1,150 3.8 97% 25 50 $47,304,800 946,096 $870,000 188 31.3% 284 4.7 97% 23 930 $567,126,362 609,813 $575,000 1,908 46.4% 1,915 2.2 99% 20 150 $99,466,880 663,113 $628,500 295 45.9% 249 2.0 100% 16 16 $10,102,800 631,425 $463,000 37 45.5% 70 4.0 94% 36 186 $100,270,489 539,089 $511,250 337 49.4% 323 2.0 99% 21 231 $121,461,194 525,806 $507,000 558 44.8% 542 2.2 99% 18 125 $86,810,356 694,483 $640,000 219 44.8% 232 2.4 98% 21 22 $13,912,800 632,400 $606,500 61 48.3% 91 3.2 98% 29 24 $19,006,408 791,934 $671,354 55 45.5% 103 3.7 97% 34 176 $116,095,435 659,633 $622,500 346 47.5% 305 1.9 98% 18 53 $29,675,688 559,919 $537,600 83 65.3% 85 1.6 99% 17 53 $29,675,688 559,919 $537,600 83 65.3% 85 1.6 99% 17 246 $154,151,960 626,634 $577,500 584 34.8% 1,017 4.7 97% 29 12 $9,397,632 783,136 $750,000 21 50.0% 41 4.2 97% 55 64 $43,641,800 681,903 $645,000 148 30.4% 234 4.8 97% 27 52 $25,343,000 487,365 $456,000 85 46.8% 124 3.5 97% 25 59 $39,834,800 675,166 $586,000 189 26.3% 368 6.5 96% 28 59 $35,934,728 609,063 $547,500 141 43.8% 250 3.7 97% 28 SUMMARY OF EXISTING HOME TRANSACTIONS ALL HOME TYPES, APRIL 2018 ALL TREB AREAS 3 1 1 1 2 5498 3
- 7. Toronto Real Estate Board Market Watch, April 2018 SUMMARY OF EXISTING HOME TRANSACTIONS ALL HOME TYPES, APRIL 2018 CITY OF TORONTO MUNICIPAL BREAKDOWN 4 Number of Sales Dollar Volume Average Price Median Price New Listings SNLR (Trend) Active Listings Mos. Inv. (Trend) Avg. SP / LP Avg. DOM TREB Total City of Toronto Total Toronto West Toronto W01 Toronto W02 Toronto W03 Toronto W04 Toronto W05 Toronto W06 Toronto W07 Toronto W08 Toronto W09 Toronto W10 Toronto Central Toronto C01 Toronto C02 Toronto C03 Toronto C04 Toronto C06 Toronto C07 Toronto C08 Toronto C09 Toronto C10 Toronto C11 Toronto C12 Toronto C13 Toronto C14 Toronto C15 Toronto East Toronto E01 Toronto E02 Toronto E03 Toronto E04 Toronto E05 Toronto E06 Toronto E07 Toronto E08 Toronto E09 Toronto E10 Toronto E11 7,792 $6,269,321,360 $804,584 $684,900 16,273 46.2% 18,206 2.5 99% 20 2,946 $2,550,698,152 $865,817 $685,000 5,299 55.6% 4,785 1.9 102% 16 766 $620,784,215 $810,423 $701,000 1,439 56.8% 1,318 1.9 103% 18 67 $72,844,849 $1,087,237 $891,000 82 68.4% 43 1.3 107% 10 85 $83,521,920 $982,611 $900,000 145 63.8% 81 1.2 109% 8 47 $36,650,200 $779,791 $792,000 106 52.2% 82 1.9 103% 18 76 $47,906,500 $630,349 $550,500 131 53.6% 147 2.4 99% 27 98 $56,191,578 $573,383 $600,000 190 52.3% 204 2.5 98% 22 123 $88,694,678 $721,095 $655,000 252 60.0% 262 1.8 101% 16 33 $39,077,900 $1,184,179 $1,022,000 59 58.4% 38 1.7 102% 18 150 $145,671,090 $971,141 $735,000 278 59.4% 233 1.7 103% 18 34 $25,912,800 $762,141 $751,450 71 50.6% 85 2.4 97% 22 53 $24,312,700 $458,730 $399,600 125 49.4% 143 2.6 98% 20 1,479 $1,403,694,891 $949,084 $655,000 2,611 56.9% 2,387 1.9 101% 15 467 $335,388,206 $718,176 $605,000 724 64.9% 547 1.4 102% 15 79 $115,103,068 $1,457,001 $1,150,000 159 56.6% 143 2.2 101% 17 55 $75,327,918 $1,369,599 $930,000 91 55.1% 81 1.9 102% 14 79 $140,289,851 $1,775,821 $1,615,000 171 47.1% 150 2.2 102% 12 29 $20,946,400 $722,290 $548,000 52 50.4% 63 2.4 99% 17 93 $81,991,517 $881,629 $726,000 225 42.2% 268 3.1 98% 18 186 $130,932,102 $703,936 $611,250 292 67.8% 205 1.3 103% 12 30 $54,254,620 $1,808,487 $1,277,910 52 62.5% 45 1.8 102% 22 76 $77,688,376 $1,022,215 $775,000 112 62.7% 76 1.3 101% 15 55 $54,100,250 $983,641 $545,000 72 63.9% 44 1.4 101% 13 29 $77,857,832 $2,684,753 $2,730,000 78 38.0% 104 4.3 96% 23 54 $48,526,099 $898,631 $637,450 97 52.4% 111 2.0 101% 17 115 $93,509,589 $813,127 $588,000 236 50.0% 268 2.3 99% 15 132 $97,779,063 $740,750 $529,000 250 50.3% 282 2.4 98% 17 701 $526,219,046 $750,669 $724,000 1,249 52.1% 1,080 1.9 103% 16 66 $66,877,523 $1,013,296 $999,900 83 64.5% 41 1.0 113% 9 63 $64,567,070 $1,024,874 $988,000 90 60.8% 48 1.2 106% 9 68 $63,575,388 $934,932 $898,500 152 53.0% 105 1.5 109% 10 94 $59,081,588 $628,528 $683,944 148 52.7% 129 1.9 100% 17 68 $43,086,488 $633,625 $531,500 124 44.6% 156 2.6 98% 22 41 $35,033,200 $854,468 $808,100 78 46.0% 58 2.1 100% 16 56 $32,461,166 $579,664 $466,000 113 49.6% 123 2.4 99% 17 49 $43,482,290 $887,394 $784,990 99 53.6% 84 2.0 99% 20 75 $41,269,232 $550,256 $473,000 129 52.8% 117 1.9 100% 17 54 $40,518,200 $750,337 $744,000 119 43.1% 124 2.7 100% 18 67 $36,266,901 $541,297 $540,000 114 52.0% 95 2.0 100% 19 1 1 1 2 8 3 9 4 5
- 8. Toronto Real Estate Board Market Watch, April 2018 SUMMARY OF EXISTING HOME TRANSACTIONS ALL HOME TYPES, YEAR-TO-DATE 2018 ALL TREB AREAS 5 Number of Sales Dollar Volume Average Price Median Price New Listings Avg. SP / LP Avg. DOM TREB Total Halton Region Burlington Halton Hills Milton Oakville Peel Region Brampton Caledon Mississauga City of Toronto Toronto West Toronto Central Toronto East York Region Aurora E. Gwillimbury Georgina King Markham Newmarket Richmond Hill Vaughan Whitchurch-Stouffville Durham Region Ajax Brock Clarington Oshawa Pickering Scugog Uxbridge Whitby Dufferin County Orangeville Simcoe County Adjala-Tosorontio Bradford West GwillimburyEssa Innisfil New Tecumseth 24,153 $18,824,844,614 $779,400 $662,000 50,156 99% 23 2,436 $2,054,306,400 $843,311 $740,000 5,179 97% 25 666 $497,596,922 $747,143 $687,950 1,293 98% 26 234 $174,232,090 $744,582 $682,500 434 99% 23 595 $414,685,850 $696,951 $655,000 1,143 98% 21 941 $967,791,538 $1,028,471 $882,000 2,309 97% 28 5,124 $3,609,421,059 $704,415 $650,000 9,741 98% 22 2,410 $1,661,215,799 $689,301 $655,000 4,654 98% 22 271 $257,147,608 $948,884 $815,000 596 97% 32 2,443 $1,691,057,652 $692,205 $620,500 4,491 98% 22 9,258 $7,614,030,136 $822,427 $651,000 15,868 101% 20 2,509 $1,891,736,710 $753,980 $663,500 4,159 101% 21 4,587 $4,138,576,084 $902,240 $630,000 7,988 100% 19 2,162 $1,583,717,342 $732,524 $699,000 3,721 102% 20 3,602 $3,311,132,526 $919,248 $838,000 11,220 97% 29 263 $240,900,123 $915,970 $820,000 824 96% 27 130 $103,575,030 $796,731 $714,500 549 97% 36 197 $108,110,387 $548,784 $506,000 680 97% 31 73 $104,863,000 $1,436,479 $1,470,000 351 95% 43 904 $834,988,183 $923,659 $870,500 2,480 98% 27 328 $251,743,872 $767,512 $726,250 1,071 97% 30 609 $604,348,887 $992,363 $900,000 2,042 96% 29 939 $913,195,244 $972,519 $890,000 2,665 97% 27 159 $149,407,800 $939,672 $840,000 558 97% 28 2,843 $1,697,484,286 $597,075 $565,000 5,817 99% 22 456 $294,661,747 $646,188 $622,250 864 99% 20 52 $27,873,200 $536,023 $447,450 130 95% 34 517 $277,850,561 $537,429 $507,500 1,013 99% 22 777 $398,006,352 $512,235 $490,000 1,645 99% 19 360 $246,530,274 $684,806 $645,000 740 98% 21 72 $46,346,200 $643,697 $577,500 171 97% 35 88 $67,429,208 $766,241 $685,000 193 97% 37 521 $338,786,744 $650,262 $612,500 1,061 98% 22 165 $87,151,073 $528,188 $529,000 255 99% 21 165 $87,151,073 $528,188 $529,000 255 99% 21 725 $451,319,134 $622,509 $580,000 2,076 97% 35 37 $30,206,032 $816,379 $750,000 83 96% 59 199 $136,033,849 $683,587 $640,000 554 96% 32 111 $56,339,800 $507,566 $475,000 270 98% 31 174 $106,012,100 $609,265 $536,250 679 96% 35 204 $122,727,353 $601,605 $580,000 490 97% 34 1 1 1 2 4 5
- 9. Toronto Real Estate Board Market Watch, April 2018 SUMMARY OF EXISTING HOME TRANSACTIONS ALL HOME TYPES, YEAR-TO-DATE 2018 CITY OF TORONTO MUNICIPAL BREAKDOWN 6 Number of Sales Dollar Volume Average Price Median Price New Listings Avg. SP / LP Avg. DOM TREB Total City of Toronto Total Toronto West Toronto W01 Toronto W02 Toronto W03 Toronto W04 Toronto W05 Toronto W06 Toronto W07 Toronto W08 Toronto W09 Toronto W10 Toronto Central Toronto C01 Toronto C02 Toronto C03 Toronto C04 Toronto C06 Toronto C07 Toronto C08 Toronto C09 Toronto C10 Toronto C11 Toronto C12 Toronto C13 Toronto C14 Toronto C15 Toronto East Toronto E01 Toronto E02 Toronto E03 Toronto E04 Toronto E05 Toronto E06 Toronto E07 Toronto E08 Toronto E09 Toronto E10 Toronto E11 24,153 $18,824,844,614 $779,400 $662,000 50,156 99% 23 9,258 $7,614,030,136 $822,427 $651,000 15,868 101% 20 2,509 $1,891,736,710 $753,980 $663,500 4,159 101% 21 194 $191,980,039 $989,588 $787,000 255 104% 13 240 $225,286,172 $938,692 $870,000 348 106% 11 148 $109,188,600 $737,761 $725,000 280 102% 19 230 $139,548,634 $606,733 $540,000 404 98% 26 329 $182,534,759 $554,817 $590,000 561 98% 26 435 $297,832,580 $684,673 $599,000 754 101% 21 97 $112,830,793 $1,163,204 $1,047,000 143 100% 20 481 $432,476,330 $899,119 $628,500 795 100% 20 124 $88,401,784 $712,918 $736,825 228 98% 28 231 $111,657,019 $483,364 $400,000 391 98% 28 4,587 $4,138,576,084 $902,240 $630,000 7,988 100% 19 1,538 $1,082,865,840 $704,074 $594,495 2,284 101% 18 230 $340,802,844 $1,481,751 $1,105,000 427 100% 21 151 $208,778,654 $1,382,640 $900,000 284 102% 17 181 $299,257,466 $1,653,356 $1,615,000 436 102% 15 97 $84,505,988 $871,196 $580,000 175 97% 23 300 $262,458,417 $874,861 $649,500 660 97% 24 582 $414,317,674 $711,886 $615,250 865 102% 16 82 $152,940,274 $1,865,125 $1,255,410 135 102% 20 193 $183,873,113 $952,710 $695,000 324 101% 14 126 $110,642,349 $878,114 $425,500 182 101% 17 81 $216,138,569 $2,668,377 $2,350,000 238 96% 26 193 $171,235,940 $887,233 $630,000 355 98% 21 401 $308,530,922 $769,404 $566,000 801 98% 20 432 $302,228,034 $699,602 $506,500 822 98% 23 2,162 $1,583,717,342 $732,524 $699,000 3,721 102% 20 196 $192,353,344 $981,395 $941,000 266 111% 12 198 $208,510,815 $1,053,085 $988,500 279 105% 15 247 $236,823,093 $958,798 $897,000 403 106% 13 281 $167,709,312 $596,830 $650,000 457 100% 20 198 $121,036,233 $611,294 $531,500 409 98% 26 107 $95,598,654 $893,445 $808,100 208 99% 18 203 $114,945,054 $566,232 $439,500 378 99% 24 165 $118,496,935 $718,163 $697,000 267 99% 25 259 $136,832,877 $528,312 $460,000 439 99% 19 134 $96,838,738 $722,677 $742,000 309 100% 21 174 $94,572,287 $543,519 $542,500 306 99% 25 1 1 1 2 4 5
- 10. Toronto Real Estate Board Market Watch, April 2018 SUMMARY OF EXISTING HOME TRANSACTIONS DETACHED HOUSES, APRIL 2018 ALL TREB AREAS 7 Sales Dollar Volume Average Price Median Price New Listings Active Listings Avg. SP / LP Avg. DOM TREB Total Halton Region Burlington Halton Hills Milton Oakville Peel Region Brampton Caledon Mississauga City of Toronto Toronto West Toronto Central Toronto East York Region Aurora E. Gwillimbury Georgina King Markham Newmarket Richmond Hill Vaughan Whitchurch-Stouffville Durham Region Ajax Brock Clarington Oshawa Pickering Scugog Uxbridge Whitby Dufferin County Orangeville Simcoe County Adjala-Tosorontio Bradford West GwillimburyEssa Innisfil New Tecumseth 3,451 $3,554,884,068 $1,030,103 $870,000 8,578 10,956 98% 22 425 $449,879,903 $1,058,541 $935,000 1,032 1,411 97% 22 125 $120,553,466 $964,428 $845,000 271 359 97% 23 58 $48,684,700 $839,391 $827,900 127 135 99% 17 89 $75,918,200 $853,013 $792,500 200 268 98% 22 153 $204,723,537 $1,338,062 $1,220,000 434 649 97% 24 754 $707,650,777 $938,529 $860,000 1,645 1,797 98% 21 427 $351,832,205 $823,963 $780,525 881 847 98% 19 71 $74,497,475 $1,049,260 $875,000 140 224 96% 37 256 $281,321,097 $1,098,911 $968,750 624 726 97% 21 819 $1,109,515,236 $1,354,719 $1,080,000 1,811 1,909 101% 17 280 $333,225,921 $1,190,093 $992,500 565 545 103% 19 243 $493,157,320 $2,029,454 $1,707,000 624 792 100% 16 296 $283,131,995 $956,527 $860,000 622 572 101% 17 624 $731,984,739 $1,173,052 $1,080,000 2,182 3,456 96% 27 51 $56,611,380 $1,110,027 $1,060,000 174 244 96% 21 38 $33,431,800 $879,784 $805,000 146 243 97% 48 50 $30,712,900 $614,258 $572,500 166 295 96% 32 19 $28,820,000 $1,516,842 $1,555,000 97 211 96% 54 116 $150,067,926 $1,293,689 $1,198,500 358 540 97% 24 68 $61,071,877 $898,116 $830,000 215 341 96% 27 99 $145,307,476 $1,467,752 $1,245,000 393 642 95% 26 146 $187,188,580 $1,282,114 $1,175,000 482 713 97% 24 37 $38,772,800 $1,047,914 $952,800 151 227 96% 24 620 $415,179,531 $669,644 $640,000 1,370 1,458 98% 21 95 $69,457,630 $731,133 $725,000 181 158 100% 18 16 $10,102,800 $631,425 $463,000 37 69 94% 36 121 $72,105,399 $595,912 $555,000 248 257 99% 23 174 $98,596,894 $566,649 $542,400 428 429 99% 20 67 $55,107,350 $822,498 $765,000 127 153 98% 23 21 $13,520,800 $643,848 $630,000 59 90 98% 31 17 $15,060,008 $885,883 $785,000 45 85 97% 35 109 $81,228,650 $745,217 $705,000 245 217 98% 18 35 $21,978,300 $627,951 $579,000 59 65 99% 19 35 $21,978,300 $627,951 $579,000 59 65 99% 19 174 $118,695,582 $682,159 $619,900 479 860 96% 31 12 $9,397,632 $783,136 $750,000 21 41 97% 55 39 $29,574,800 $758,328 $765,000 118 202 97% 29 33 $17,101,000 $518,212 $533,000 60 95 96% 27 52 $36,340,400 $698,854 $592,500 169 333 96% 30 38 $26,281,750 $691,625 $616,000 111 189 97% 31 1 2 3 4 51 1 1
- 11. Toronto Real Estate Board Market Watch, April 2018 SUMMARY OF EXISTING HOME TRANSACTIONS DETACHED HOUSES, APRIL 2018 CITY OF TORONTO MUNICIPAL BREAKDOWN 8 Sales Dollar Volume Average Price Median Price New Listings Active Listings Avg. SP / LP Avg. DOM TREB Total City of Toronto Total Toronto West Toronto W01 Toronto W02 Toronto W03 Toronto W04 Toronto W05 Toronto W06 Toronto W07 Toronto W08 Toronto W09 Toronto W10 Toronto Central Toronto C01 Toronto C02 Toronto C03 Toronto C04 Toronto C06 Toronto C07 Toronto C08 Toronto C09 Toronto C10 Toronto C11 Toronto C12 Toronto C13 Toronto C14 Toronto C15 Toronto East Toronto E01 Toronto E02 Toronto E03 Toronto E04 Toronto E05 Toronto E06 Toronto E07 Toronto E08 Toronto E09 Toronto E10 Toronto E11 3,451 $3,554,884,068 $1,030,103 $870,000 8,578 10,956 98% 22 819 $1,109,515,236 $1,354,719 $1,080,000 1,811 1,909 101% 17 280 $333,225,921 $1,190,093 $992,500 565 545 103% 19 14 $27,766,000 $1,983,286 $1,840,000 19 16 108% 7 29 $36,811,721 $1,269,370 $1,251,000 61 37 109% 8 29 $24,170,200 $833,455 $820,000 58 44 101% 15 28 $26,585,600 $949,486 $875,000 52 76 99% 26 19 $16,779,000 $883,105 $796,000 45 57 96% 31 36 $36,443,400 $1,012,317 $914,500 64 60 101% 20 29 $36,017,900 $1,241,997 $1,171,000 38 21 102% 18 64 $99,023,700 $1,547,245 $1,338,750 134 124 104% 22 17 $18,585,800 $1,093,282 $910,000 34 41 97% 19 15 $11,042,600 $736,173 $705,000 60 69 97% 19 243 $493,157,320 $2,029,454 $1,707,000 624 792 100% 16 4 $9,484,000 $2,371,000 $2,603,500 9 12 103% 17 9 $20,995,018 $2,332,780 $2,058,018 25 23 104% 12 29 $52,594,018 $1,813,587 $1,480,000 56 51 102% 13 57 $119,750,018 $2,100,878 $2,050,000 138 126 102% 12 10 $11,454,000 $1,145,400 $1,156,000 29 42 98% 22 28 $38,826,011 $1,386,643 $1,355,000 84 126 98% 17 3 $4,849,900 $1,616,633 $1,600,000 2 0 113% 6 8 $27,585,000 $3,448,125 $3,790,000 20 22 104% 9 11 $22,426,055 $2,038,732 $1,844,555 17 15 101% 8 16 $32,204,300 $2,012,769 $1,918,150 23 20 101% 12 17 $59,248,000 $3,485,176 $3,288,000 54 83 95% 31 16 $27,305,000 $1,706,563 $1,265,400 36 48 102% 16 12 $28,315,000 $2,359,583 $2,545,000 67 135 95% 27 23 $38,121,000 $1,657,435 $1,450,000 64 89 96% 15 296 $283,131,995 $956,527 $860,000 622 572 101% 17 11 $14,323,760 $1,302,160 $1,175,000 19 11 106% 16 19 $26,235,290 $1,380,805 $1,175,120 37 24 104% 7 37 $39,836,500 $1,076,662 $985,000 100 78 108% 12 45 $36,319,888 $807,109 $730,000 86 78 99% 16 19 $19,738,900 $1,038,889 $1,000,000 37 56 96% 21 30 $28,496,200 $949,873 $882,050 64 46 100% 17 16 $14,018,166 $876,135 $877,000 37 40 98% 19 34 $36,545,490 $1,074,867 $912,500 79 66 99% 17 29 $21,978,000 $757,862 $741,000 52 54 99% 19 38 $32,241,300 $848,455 $772,500 76 86 100% 19 18 $13,398,501 $744,361 $727,500 35 33 100% 19 1 1 1 1 2 3 4 5
- 12. Toronto Real Estate Board Market Watch, April 2018 SUMMARY OF EXISTING HOME TRANSACTIONS SEMI-DETACHED HOUSES, APRIL 2018 ALL TREB AREAS 9 Sales Dollar Volume Average Price Median Price New Listings Active Listings Avg. SP / LP Avg. DOM TREB Total Halton Region Burlington Halton Hills Milton Oakville Peel Region Brampton Caledon Mississauga City of Toronto Toronto West Toronto Central Toronto East York Region Aurora E. Gwillimbury Georgina King Markham Newmarket Richmond Hill Vaughan Whitchurch-Stouffville Durham Region Ajax Brock Clarington Oshawa Pickering Scugog Uxbridge Whitby Dufferin County Orangeville Simcoe County Adjala-Tosorontio Bradford West GwillimburyEssa Innisfil New Tecumseth 714 $565,762,643 $792,385 $703,400 1,293 1,066 102% 15 41 $26,856,950 $655,048 $655,000 96 98 100% 15 8 $4,693,000 $586,625 $575,500 20 21 99% 14 4 $2,175,850 $543,963 $540,425 9 4 102% 14 20 $13,297,500 $664,875 $655,000 37 39 99% 14 9 $6,690,600 $743,400 $752,600 30 34 101% 18 257 $170,812,312 $664,639 $664,000 467 356 99% 13 139 $87,953,912 $632,762 $625,000 241 182 99% 14 6 $4,118,800 $686,467 $678,400 21 14 100% 5 112 $78,739,600 $703,032 $700,000 205 160 99% 12 265 $270,826,272 $1,021,986 $905,000 423 288 106% 13 81 $71,687,987 $885,037 $775,500 143 112 107% 14 81 $106,855,833 $1,319,208 $1,195,000 144 107 102% 14 103 $92,282,452 $895,946 $841,000 136 69 111% 11 74 $58,400,375 $789,194 $790,000 195 236 97% 27 4 $2,849,000 $712,250 $723,000 12 20 96% 43 2 $1,200,000 $600,000 $600,000 9 12 99% 5 0 - - - 4 4 - - 0 - - - 4 5 - - 25 $22,473,375 $898,935 $901,800 55 59 98% 27 15 $9,118,700 $607,913 $635,000 33 39 97% 31 4 $3,239,000 $809,750 $794,000 27 43 99% 30 21 $17,340,300 $825,729 $825,000 44 45 97% 24 3 $2,180,000 $726,667 $730,000 7 9 98% 19 57 $28,508,934 $500,157 $492,900 89 65 100% 13 14 $8,471,500 $605,107 $597,500 22 18 101% 14 0 - - - 0 0 - - 4 $1,565,088 $391,272 $394,500 7 4 103% 4 22 $8,904,100 $404,732 $415,000 37 28 101% 9 13 $7,777,746 $598,288 $620,000 15 9 99% 17 1 $392,000 $392,000 $392,000 2 1 98% 2 0 - - - 0 0 - - 3 $1,398,500 $466,167 $470,000 6 5 96% 39 6 $2,603,900 $433,983 $428,250 8 4 99% 11 6 $2,603,900 $433,983 $428,250 8 4 99% 11 14 $7,753,900 $553,850 $606,000 15 19 98% 27 0 - - - 0 0 - - 8 $4,749,000 $593,625 $622,500 7 5 98% 27 1 $440,000 $440,000 $440,000 0 1 98% 56 0 - - - 1 2 - - 5 $2,564,900 $512,980 $555,000 7 11 98% 20 1 1 1 1 2 3 4 5
- 13. Toronto Real Estate Board Market Watch, April 2018 SUMMARY OF EXISTING HOME TRANSACTIONS SEMI-DETACHED HOUSES, APRIL 2018 CITY OF TORONTO MUNICIPAL BREAKDOWN 10 Sales Dollar Volume Average Price Median Price New Listings Active Listings Avg. SP / LP Avg. DOM TREB Total City of Toronto Total Toronto West Toronto W01 Toronto W02 Toronto W03 Toronto W04 Toronto W05 Toronto W06 Toronto W07 Toronto W08 Toronto W09 Toronto W10 Toronto Central Toronto C01 Toronto C02 Toronto C03 Toronto C04 Toronto C06 Toronto C07 Toronto C08 Toronto C09 Toronto C10 Toronto C11 Toronto C12 Toronto C13 Toronto C14 Toronto C15 Toronto East Toronto E01 Toronto E02 Toronto E03 Toronto E04 Toronto E05 Toronto E06 Toronto E07 Toronto E08 Toronto E09 Toronto E10 Toronto E11 714 $565,762,643 $792,385 $703,400 1,293 1,066 102% 15 265 $270,826,272 $1,021,986 $905,000 423 288 106% 13 81 $71,687,987 $885,037 $775,500 143 112 107% 14 12 $16,243,000 $1,353,583 $1,304,000 14 6 114% 6 22 $22,294,999 $1,013,409 $968,000 34 14 111% 7 10 $7,269,000 $726,900 $718,500 33 27 104% 33 4 $2,862,500 $715,625 $722,500 6 8 99% 20 28 $19,343,488 $690,839 $693,500 46 45 100% 15 4 $3,045,000 $761,250 $767,500 5 6 102% 16 0 - - - 2 1 - - 0 - - - 0 0 - - 0 - - - 1 3 - - 1 $630,000 $630,000 $630,000 2 2 99% 22 81 $106,855,833 $1,319,208 $1,195,000 144 107 102% 14 16 $20,518,000 $1,282,375 $1,219,000 24 21 101% 12 10 $22,502,500 $2,250,250 $2,200,000 19 13 102% 15 12 $12,275,900 $1,022,992 $880,000 16 4 106% 11 7 $9,967,933 $1,423,990 $1,400,000 9 2 105% 7 1 $935,000 $935,000 $935,000 0 0 120% 31 5 $4,689,000 $937,800 $920,000 9 10 98% 24 1 $1,820,000 $1,820,000 $1,820,000 4 5 98% 7 1 $2,500,000 $2,500,000 $2,500,000 3 3 109% 7 11 $15,191,000 $1,381,000 $1,300,000 18 7 102% 12 7 $8,504,000 $1,214,857 $1,150,000 8 1 102% 7 0 - - - 1 1 - - 6 $4,532,000 $755,333 $721,000 13 10 98% 34 0 - - - 0 0 - - 4 $3,420,500 $855,125 $852,500 20 30 95% 25 103 $92,282,452 $895,946 $841,000 136 69 111% 11 26 $27,776,698 $1,068,335 $1,100,000 32 14 117% 8 25 $24,160,280 $966,411 $988,000 29 10 111% 8 20 $18,768,388 $938,419 $946,250 31 12 114% 8 3 $1,910,000 $636,667 $628,000 6 4 100% 16 5 $3,605,900 $721,180 $721,000 7 8 97% 25 3 $2,015,000 $671,667 $673,000 3 2 99% 15 4 $2,704,000 $676,000 $675,500 7 7 98% 37 0 - - - 0 1 - - 3 $1,947,786 $649,262 $671,000 4 2 108% 9 6 $4,244,900 $707,483 $721,500 9 5 101% 11 8 $5,149,500 $643,688 $634,750 8 4 100% 20 1 1 1 1 2 3 4 5
- 14. Toronto Real Estate Board Market Watch, April 2018 SUMMARY OF EXISTING HOME TRANSACTIONS CONDOMINIUM TOWNHOUSES, APRIL 2018 ALL TREB AREAS 11 Sales Dollar Volume Average Price Median Price New Listings Active Listings Avg. SP / LP Avg. DOM TREB Total Halton Region Burlington Halton Hills Milton Oakville Peel Region Brampton Caledon Mississauga City of Toronto Toronto West Toronto Central Toronto East York Region Aurora E. Gwillimbury Georgina King Markham Newmarket Richmond Hill Vaughan Whitchurch-Stouffville Durham Region Ajax Brock Clarington Oshawa Pickering Scugog Uxbridge Whitby Dufferin County Orangeville Simcoe County Adjala-Tosorontio Bradford West GwillimburyEssa Innisfil New Tecumseth 542 $309,946,084 $571,856 $525,000 1,056 1,028 100% 18 72 $36,069,583 $500,966 $480,000 126 117 99% 23 38 $18,714,083 $492,476 $475,200 58 47 98% 25 6 $2,811,300 $468,550 $479,500 9 3 100% 10 6 $2,733,000 $455,500 $476,250 9 8 100% 26 22 $11,811,200 $536,873 $502,250 50 59 98% 24 190 $100,021,024 $526,426 $516,500 341 323 99% 19 46 $20,623,200 $448,330 $442,500 100 101 98% 17 2 $1,007,400 $503,700 $503,700 1 0 98% 14 142 $78,390,424 $552,045 $547,000 240 222 99% 19 168 $114,729,839 $682,916 $612,500 329 295 103% 15 75 $44,321,590 $590,955 $609,000 122 94 101% 17 52 $48,689,349 $936,334 $805,800 116 109 104% 11 41 $21,718,900 $529,729 $530,000 91 92 102% 17 53 $33,914,600 $639,898 $605,000 156 201 99% 19 8 $5,262,300 $657,788 $488,400 26 30 98% 13 0 - - - 0 0 - - 0 - - - 0 0 - - 0 - - - 0 0 - - 23 $15,757,300 $685,100 $635,000 56 74 98% 23 4 $1,979,000 $494,750 $514,500 14 26 100% 18 10 $6,400,000 $640,000 $648,000 33 34 101% 16 7 $4,093,000 $584,714 $570,000 22 33 98% 20 1 $423,000 $423,000 $423,000 5 4 99% 15 56 $24,219,650 $432,494 $440,000 97 85 99% 18 13 $6,143,250 $472,558 $468,000 26 17 99% 17 0 - - - 0 0 - - 8 $3,381,900 $422,738 $426,500 11 9 99% 23 13 $4,093,800 $314,908 $296,000 31 28 102% 11 12 $5,825,900 $485,492 $496,950 14 15 98% 19 0 - - - 0 0 - - 2 $1,226,000 $613,000 $613,000 4 6 99% 18 8 $3,548,800 $443,600 $430,000 11 10 98% 22 2 $621,488 $310,744 $310,744 3 2 97% 23 2 $621,488 $310,744 $310,744 3 2 97% 23 1 $369,900 $369,900 $369,900 4 5 99% 18 0 - - - 0 0 - - 0 - - - 1 1 - - 0 - - - 0 0 - - 0 - - - 0 0 - - 1 $369,900 $369,900 $369,900 3 4 99% 18 1 1 1 1 2 3 4 5
- 15. Toronto Real Estate Board Market Watch, April 2018 SUMMARY OF EXISTING HOME TRANSACTIONS CONDOMINIUM TOWNHOUSES, APRIL 2018 CITY OF TORONTO MUNICIPAL BREAKDOWN 12 Sales Dollar Volume Average Price Median Price New Listings Active Listings Avg. SP / LP Avg. DOM TREB Total City of Toronto Total Toronto West Toronto W01 Toronto W02 Toronto W03 Toronto W04 Toronto W05 Toronto W06 Toronto W07 Toronto W08 Toronto W09 Toronto W10 Toronto Central Toronto C01 Toronto C02 Toronto C03 Toronto C04 Toronto C06 Toronto C07 Toronto C08 Toronto C09 Toronto C10 Toronto C11 Toronto C12 Toronto C13 Toronto C14 Toronto C15 Toronto East Toronto E01 Toronto E02 Toronto E03 Toronto E04 Toronto E05 Toronto E06 Toronto E07 Toronto E08 Toronto E09 Toronto E10 Toronto E11 542 $309,946,084 $571,856 $525,000 1,056 1,028 100% 18 168 $114,729,839 $682,916 $612,500 329 295 103% 15 75 $44,321,590 $590,955 $609,000 122 94 101% 17 7 $5,202,500 $743,214 $632,500 7 2 103% 11 15 $10,793,500 $719,567 $690,000 16 7 105% 7 1 $670,000 $670,000 $670,000 6 4 103% 7 7 $3,616,900 $516,700 $442,000 19 10 101% 27 18 $7,225,890 $401,438 $456,500 31 30 98% 27 14 $9,943,800 $710,271 $727,000 22 12 101% 11 1 $785,000 $785,000 $785,000 1 0 92% 20 3 $1,795,000 $598,333 $610,000 10 16 97% 23 3 $1,812,000 $604,000 $584,000 4 4 98% 23 6 $2,477,000 $412,833 $411,000 6 9 100% 16 52 $48,689,349 $936,334 $805,800 116 109 104% 11 16 $12,149,462 $759,341 $800,750 31 17 106% 8 2 $4,400,000 $2,200,000 $2,200,000 3 3 100% 35 0 - - - 0 3 - - 0 - - - 2 3 - - 1 $575,000 $575,000 $575,000 1 1 100% 13 5 $4,031,388 $806,278 $633,000 16 14 100% 14 6 $5,569,000 $928,167 $805,000 9 8 104% 9 2 $2,950,000 $1,475,000 $1,475,000 2 0 107% 3 3 $3,463,000 $1,154,333 $1,383,000 4 3 99% 8 0 - - - 1 1 - - 4 $4,915,000 $1,228,750 $1,199,000 10 11 104% 9 3 $2,097,500 $699,167 $767,500 5 7 98% 17 6 $5,048,000 $841,333 $739,150 15 12 108% 11 4 $3,490,999 $872,750 $686,500 17 26 111% 11 41 $21,718,900 $529,729 $530,000 91 92 102% 17 4 $2,049,900 $512,475 $522,500 5 2 104% 13 5 $3,605,700 $721,140 $660,000 8 4 104% 7 0 - - - 0 0 - - 3 $1,844,500 $614,833 $553,500 4 3 103% 9 4 $2,240,000 $560,000 $547,500 15 19 100% 25 1 $559,000 $559,000 $559,000 4 4 100% 15 2 $1,265,000 $632,500 $632,500 7 12 111% 9 2 $966,000 $483,000 $483,000 3 3 99% 18 3 $1,482,900 $494,300 $499,900 9 8 99% 16 4 $1,663,000 $415,750 $466,000 14 17 99% 19 13 $6,042,900 $464,838 $449,900 22 20 100% 23 1 1 1 1 2 3 4 5
- 16. Toronto Real Estate Board Market Watch, April 2018 SUMMARY OF EXISTING HOME TRANSACTIONS CONDOMINIUM APARTMENT, APRIL 2018 ALL TREB AREAS 13 Sales Dollar Volume Average Price Median Price New Listings Active Listings Avg. SP / LP Avg. DOM TREB Total Halton Region Burlington Halton Hills Milton Oakville Peel Region Brampton Caledon Mississauga City of Toronto Toronto West Toronto Central Toronto East York Region Aurora E. Gwillimbury Georgina King Markham Newmarket Richmond Hill Vaughan Whitchurch-Stouffville Durham Region Ajax Brock Clarington Oshawa Pickering Scugog Uxbridge Whitby Dufferin County Orangeville Simcoe County Adjala-Tosorontio Bradford West GwillimburyEssa Innisfil New Tecumseth 2,218 $1,240,623,041 $559,343 $490,000 3,652 3,394 100% 18 97 $51,742,653 $533,429 $411,000 173 217 97% 33 36 $15,245,470 $423,485 $390,500 59 68 98% 31 1 $325,000 $325,000 $325,000 1 1 99% 19 16 $7,142,000 $446,375 $438,500 27 24 100% 20 44 $29,030,183 $659,777 $425,500 86 124 96% 39 301 $127,759,251 $424,449 $405,000 440 420 99% 20 51 $18,694,901 $366,567 $358,000 68 73 97% 24 1 $686,000 $686,000 $686,000 0 0 98% 25 249 $108,378,350 $435,254 $415,000 372 347 99% 19 1,574 $946,305,789 $601,211 $530,000 2,535 2,130 101% 16 296 $143,599,017 $485,132 $450,000 544 513 101% 17 1,065 $710,722,273 $667,345 $579,000 1,667 1,331 101% 15 213 $91,984,499 $431,852 $395,000 324 286 100% 17 196 $95,107,588 $485,243 $449,950 411 511 98% 26 0 - - - 11 16 - - 0 - - - 0 0 - - 1 $238,000 $238,000 $238,000 1 1 97% 27 0 - - - 5 9 - - 81 $38,595,788 $476,491 $439,500 159 170 99% 27 4 $1,965,000 $491,250 $490,000 11 18 98% 40 54 $24,172,200 $447,633 $439,000 104 129 98% 22 56 $30,136,600 $538,154 $512,500 119 157 98% 28 0 - - - 1 11 - - 44 $17,313,360 $393,485 $373,450 84 88 100% 23 2 $729,000 $364,500 $364,500 9 10 99% 37 0 - - - 0 0 - - 14 $4,863,600 $347,400 $366,825 16 16 100% 36 5 $1,731,900 $346,380 $287,000 13 23 98% 19 16 $7,236,360 $452,273 $423,450 32 22 102% 10 0 - - - 0 0 - - 1 $335,000 $335,000 $335,000 2 3 96% 48 6 $2,417,500 $402,917 $406,250 12 14 99% 22 2 $570,000 $285,000 $285,000 4 4 96% 20 2 $570,000 $285,000 $285,000 4 4 96% 20 4 $1,824,400 $456,100 $374,250 5 24 99% 23 0 - - - 0 0 - - 0 - - - 3 12 - - 0 - - - 0 0 - - 1 $789,900 $789,900 $789,900 1 8 100% 15 3 $1,034,500 $344,833 $333,500 1 4 98% 26 1 1 1 1 2 3 4 5
- 17. Toronto Real Estate Board Market Watch, April 2018 SUMMARY OF EXISTING HOME TRANSACTIONS CONDOMINIUM APARTMENT, APRIL 2018 CITY OF TORONTO MUNICIPAL BREAKDOWN 14 Sales Dollar Volume Average Price Median Price New Listings Active Listings Avg. SP / LP Avg. DOM TREB Total City of Toronto Total Toronto West Toronto W01 Toronto W02 Toronto W03 Toronto W04 Toronto W05 Toronto W06 Toronto W07 Toronto W08 Toronto W09 Toronto W10 Toronto Central Toronto C01 Toronto C02 Toronto C03 Toronto C04 Toronto C06 Toronto C07 Toronto C08 Toronto C09 Toronto C10 Toronto C11 Toronto C12 Toronto C13 Toronto C14 Toronto C15 Toronto East Toronto E01 Toronto E02 Toronto E03 Toronto E04 Toronto E05 Toronto E06 Toronto E07 Toronto E08 Toronto E09 Toronto E10 Toronto E11 2,218 $1,240,623,041 $559,343 $490,000 3,652 3,394 100% 18 1,574 $946,305,789 $601,211 $530,000 2,535 2,130 101% 16 296 $143,599,017 $485,132 $450,000 544 513 101% 17 29 $18,707,849 $645,098 $636,200 36 17 102% 13 14 $9,465,400 $676,100 $701,000 28 19 108% 8 3 $1,216,000 $405,333 $415,000 4 6 101% 13 36 $14,201,500 $394,486 $419,000 49 46 99% 27 27 $9,393,300 $347,900 $375,000 56 63 99% 18 65 $36,149,478 $556,146 $522,500 151 171 101% 16 2 $1,285,000 $642,500 $642,500 12 10 98% 18 76 $38,257,390 $503,387 $465,500 127 91 101% 15 13 $4,760,000 $366,154 $340,000 26 30 98% 21 31 $10,163,100 $327,842 $340,000 55 60 99% 21 1,065 $710,722,273 $667,345 $579,000 1,667 1,331 101% 15 423 $283,852,744 $671,047 $592,000 646 485 102% 15 53 $57,830,550 $1,091,142 $750,000 107 101 100% 17 12 $8,013,000 $667,750 $576,500 19 22 101% 19 14 $10,311,900 $736,564 $530,500 20 17 100% 14 17 $7,982,400 $469,553 $472,500 22 19 99% 14 53 $32,500,118 $613,210 $553,000 108 113 99% 18 164 $106,444,806 $649,054 $595,000 262 183 102% 12 16 $18,724,800 $1,170,300 $1,039,500 23 17 98% 29 51 $36,608,321 $717,810 $620,000 70 49 101% 17 31 $12,361,950 $398,773 $367,000 39 22 102% 15 8 $13,694,832 $1,711,854 $1,167,500 12 8 101% 11 28 $13,511,599 $482,557 $451,500 40 40 100% 15 94 $56,138,689 $597,220 $538,900 152 120 99% 13 101 $52,746,564 $522,243 $490,000 147 135 99% 17 213 $91,984,499 $431,852 $395,000 324 286 100% 17 10 $7,607,365 $760,737 $802,000 12 7 105% 8 12 $8,983,800 $748,650 $660,000 11 7 100% 15 10 $4,020,500 $402,050 $355,000 19 14 102% 12 31 $10,981,800 $354,252 $362,000 44 39 99% 17 37 $15,436,688 $417,208 $418,000 59 65 99% 20 7 $3,963,000 $566,143 $470,000 6 5 98% 12 30 $11,909,500 $396,983 $401,500 55 55 101% 13 12 $5,230,800 $435,900 $405,000 14 12 100% 31 40 $15,860,546 $396,514 $386,500 61 50 99% 15 4 $1,196,000 $299,000 $302,000 9 8 99% 25 20 $6,794,500 $339,725 $340,000 34 24 100% 17 1 1 1 1 2 3 4 5
- 18. Toronto Real Estate Board Market Watch, April 2018 SUMMARY OF EXISTING HOME TRANSACTIONS LINK, APRIL 2018 ALL TREB AREAS 15 Sales Dollar Volume Average Price Median Price New Listings Active Listings Avg. SP / LP Avg. DOM TREB Total Halton Region Burlington Halton Hills Milton Oakville Peel Region Brampton Caledon Mississauga City of Toronto Toronto West Toronto Central Toronto East York Region Aurora E. Gwillimbury Georgina King Markham Newmarket Richmond Hill Vaughan Whitchurch-Stouffville Durham Region Ajax Brock Clarington Oshawa Pickering Scugog Uxbridge Whitby Dufferin County Orangeville Simcoe County Adjala-Tosorontio Bradford West GwillimburyEssa Innisfil New Tecumseth 107 $71,667,829 $669,793 $615,500 216 240 99% 21 3 $1,948,500 $649,500 $693,500 17 15 96% 28 1 $693,500 $693,500 $693,500 5 3 99% 5 1 $425,000 $425,000 $425,000 0 0 90% 37 1 $830,000 $830,000 $830,000 3 2 97% 41 0 - - - 9 10 - - 7 $4,639,404 $662,772 $640,000 14 16 100% 11 4 $2,484,404 $621,101 $608,778 10 10 98% 13 0 - - - 1 1 - - 3 $2,155,000 $718,333 $729,900 3 5 101% 9 2 $1,460,000 $730,000 $730,000 10 16 98% 36 0 - - - 0 1 - - 0 - - - 1 1 - - 2 $1,460,000 $730,000 $730,000 9 14 98% 36 38 $33,989,488 $894,460 $882,500 91 119 99% 29 0 - - - 2 3 - - 0 - - - 0 0 - - 1 $410,000 $410,000 $410,000 1 0 96% 5 0 - - - 1 1 - - 25 $22,813,488 $912,540 $910,000 60 79 100% 31 0 - - - 3 3 - - 7 $6,257,000 $893,857 $869,000 11 19 98% 25 5 $4,509,000 $901,800 $870,000 12 13 99% 29 0 - - - 1 1 - - 37 $19,649,937 $531,079 $516,000 58 42 100% 12 0 - - - 1 1 - - 0 - - - 0 0 - - 19 $9,478,702 $498,879 $500,000 28 17 99% 10 5 $2,194,500 $438,900 $462,000 9 7 100% 15 1 $721,000 $721,000 $721,000 4 3 96% 11 0 - - - 0 0 - - 1 $615,500 $615,500 $615,500 2 2 96% 32 11 $6,640,235 $603,658 $585,000 14 12 101% 12 1 $560,000 $560,000 $560,000 1 0 100% 15 1 $560,000 $560,000 $560,000 1 0 100% 15 19 $9,420,500 $495,816 $485,000 25 32 98% 24 0 - - - 0 0 - - 8 $4,386,000 $548,250 $564,250 9 8 98% 26 10 $4,552,500 $455,250 $450,000 10 16 98% 22 0 - - - 4 4 - - 1 $482,000 $482,000 $482,000 2 4 97% 29 1 1 1 1 2 3 4 5
- 19. Toronto Real Estate Board Market Watch, April 2018 SUMMARY OF EXISTING HOME TRANSACTIONS LINK, APRIL 2018 CITY OF TORONTO MUNICIPAL BREAKDOWN 16 Sales Dollar Volume Average Price Median Price New Listings Active Listings Avg. SP / LP Avg. DOM TREB Total City of Toronto Total Toronto West Toronto W01 Toronto W02 Toronto W03 Toronto W04 Toronto W05 Toronto W06 Toronto W07 Toronto W08 Toronto W09 Toronto W10 Toronto Central Toronto C01 Toronto C02 Toronto C03 Toronto C04 Toronto C06 Toronto C07 Toronto C08 Toronto C09 Toronto C10 Toronto C11 Toronto C12 Toronto C13 Toronto C14 Toronto C15 Toronto East Toronto E01 Toronto E02 Toronto E03 Toronto E04 Toronto E05 Toronto E06 Toronto E07 Toronto E08 Toronto E09 Toronto E10 Toronto E11 107 $71,667,829 $669,793 $615,500 216 240 99% 21 2 $1,460,000 $730,000 $730,000 10 16 98% 36 0 - - - 0 1 - - 0 - - - 0 0 - - 0 - - - 0 0 - - 0 - - - 0 0 - - 0 - - - 0 0 - - 0 - - - 0 0 - - 0 - - - 0 0 - - 0 - - - 0 0 - - 0 - - - 0 0 - - 0 - - - 0 0 - - 0 - - - 0 1 - - 0 - - - 1 1 - - 0 - - - 0 0 - - 0 - - - 0 0 - - 0 - - - 0 0 - - 0 - - - 0 0 - - 0 - - - 0 0 - - 0 - - - 0 0 - - 0 - - - 0 0 - - 0 - - - 0 0 - - 0 - - - 0 0 - - 0 - - - 0 0 - - 0 - - - 0 0 - - 0 - - - 0 0 - - 0 - - - 0 0 - - 0 - - - 1 1 - - 2 $1,460,000 $730,000 $730,000 9 14 98% 36 0 - - - 0 0 - - 0 - - - 0 0 - - 0 - - - 0 0 - - 0 - - - 0 0 - - 1 $760,000 $760,000 $760,000 4 6 95% 40 0 - - - 0 0 - - 1 $700,000 $700,000 $700,000 3 5 100% 31 0 - - - 0 0 - - 0 - - - 0 0 - - 0 - - - 0 0 - - 0 - - - 2 3 - - 1 1 1 1 2 3 4 5
- 20. Toronto Real Estate Board Market Watch, April 2018 SUMMARY OF EXISTING HOME TRANSACTIONS ATTACHED/ROW/TOWNHOUSE, APRIL 2018 ALL TREB AREAS 17 Sales Dollar Volume Average Price Median Price New Listings Active Listings Avg. SP / LP Avg. DOM TREB Total Halton Region Burlington Halton Hills Milton Oakville Peel Region Brampton Caledon Mississauga City of Toronto Toronto West Toronto Central Toronto East York Region Aurora E. Gwillimbury Georgina King Markham Newmarket Richmond Hill Vaughan Whitchurch-Stouffville Durham Region Ajax Brock Clarington Oshawa Pickering Scugog Uxbridge Whitby Dufferin County Orangeville Simcoe County Adjala-Tosorontio Bradford West GwillimburyEssa Innisfil New Tecumseth 745 $520,389,695 $698,510 $646,000 1,454 1,471 100% 18 139 $94,078,026 $676,820 $640,000 245 237 98% 16 19 $12,167,500 $640,395 $630,000 41 31 98% 12 7 $4,205,300 $600,757 $614,900 14 10 102% 13 57 $33,914,338 $594,988 $586,500 90 65 99% 13 56 $43,790,888 $781,980 $752,500 100 131 97% 22 180 $114,652,786 $636,960 $628,500 304 259 99% 18 140 $85,901,886 $613,585 $616,500 219 187 99% 18 11 $7,297,900 $663,445 $685,000 29 22 100% 7 29 $21,453,000 $739,759 $711,000 56 50 99% 17 109 $104,704,016 $960,587 $878,000 180 130 104% 15 31 $27,229,700 $878,377 $895,000 60 45 103% 16 33 $42,059,116 $1,274,519 $1,080,000 54 39 102% 14 45 $35,415,200 $787,004 $739,900 66 46 108% 14 164 $127,123,239 $775,142 $780,000 460 605 99% 23 14 $9,864,888 $704,635 $695,000 41 50 99% 19 8 $4,935,500 $616,938 $620,250 17 28 97% 22 4 $1,971,000 $492,750 $495,500 13 13 99% 49 3 $2,690,000 $896,667 $895,000 7 10 99% 23 36 $28,723,888 $797,886 $780,250 92 127 100% 23 13 $8,315,700 $639,669 $645,000 38 56 97% 22 26 $22,089,988 $849,615 $851,500 85 101 98% 22 51 $42,603,275 $835,358 $815,000 144 188 99% 24 9 $5,929,000 $658,778 $662,000 23 32 98% 19 113 $60,881,950 $538,778 $536,000 208 176 99% 16 23 $13,292,500 $577,935 $565,000 54 44 99% 11 0 - - - 0 1 - - 20 $8,875,800 $443,790 $443,500 27 20 101% 8 12 $5,940,000 $495,000 $501,500 40 27 100% 14 16 $10,142,000 $633,875 $610,000 27 30 98% 29 0 - - - 0 0 - - 3 $1,769,900 $589,967 $590,000 2 7 98% 35 39 $20,861,750 $534,917 $540,000 58 47 99% 17 7 $3,342,000 $477,429 $480,000 8 10 100% 10 7 $3,342,000 $477,429 $480,000 8 10 100% 10 33 $15,607,678 $472,960 $455,000 49 54 98% 19 0 - - - 0 0 - - 9 $4,932,000 $548,000 $540,000 10 6 97% 21 8 $3,249,500 $406,188 $397,000 15 12 99% 13 6 $2,704,500 $450,750 $448,500 14 21 97% 20 10 $4,721,678 $472,168 $462,150 10 15 99% 23 1 1 1 1 2 3 4 5
- 21. Toronto Real Estate Board Market Watch, April 2018 SUMMARY OF EXISTING HOME TRANSACTIONS ATTACHED/ROW/TOWNHOUSE, APRIL 2018 CITY OF TORONTO MUNICIPAL BREAKDOWN 18 Sales Dollar Volume Average Price Median Price New Listings Active Listings Avg. SP / LP Avg. DOM TREB Total City of Toronto Total Toronto West Toronto W01 Toronto W02 Toronto W03 Toronto W04 Toronto W05 Toronto W06 Toronto W07 Toronto W08 Toronto W09 Toronto W10 Toronto Central Toronto C01 Toronto C02 Toronto C03 Toronto C04 Toronto C06 Toronto C07 Toronto C08 Toronto C09 Toronto C10 Toronto C11 Toronto C12 Toronto C13 Toronto C14 Toronto C15 Toronto East Toronto E01 Toronto E02 Toronto E03 Toronto E04 Toronto E05 Toronto E06 Toronto E07 Toronto E08 Toronto E09 Toronto E10 Toronto E11 745 $520,389,695 $698,510 $646,000 1,454 1,471 100% 18 109 $104,704,016 $960,587 $878,000 180 130 104% 15 31 $27,229,700 $878,377 $895,000 60 45 103% 16 5 $4,925,500 $985,100 $1,003,000 6 2 104% 12 5 $4,156,300 $831,260 $766,500 6 3 107% 6 4 $3,325,000 $831,250 $887,500 5 1 118% 4 1 $640,000 $640,000 $640,000 5 7 99% 47 4 $3,039,900 $759,975 $757,450 11 7 97% 33 3 $2,803,000 $934,333 $895,000 8 11 101% 4 1 $990,000 $990,000 $990,000 6 6 100% 8 7 $6,595,000 $942,143 $960,000 6 1 99% 12 1 $755,000 $755,000 $755,000 5 5 98% 96 0 - - - 2 2 - - 33 $42,059,116 $1,274,519 $1,080,000 54 39 102% 14 8 $9,384,000 $1,173,000 $1,001,500 14 12 100% 13 5 $9,375,000 $1,875,000 $1,644,000 4 2 101% 19 1 $2,050,000 $2,050,000 $2,050,000 0 0 106% 47 0 - - - 1 1 - - 0 - - - 0 0 - - 2 $1,945,000 $972,500 $972,500 8 5 95% 19 11 $11,926,396 $1,084,218 $970,000 15 9 104% 9 1 $1,260,820 $1,260,820 $1,260,820 3 1 93% 14 0 - - - 3 2 - - 1 $1,030,000 $1,030,000 $1,030,000 1 0 103% 7 0 - - - 1 1 - - 1 $1,080,000 $1,080,000 $1,080,000 2 5 109% 7 3 $4,007,900 $1,335,967 $1,230,000 2 1 103% 15 0 - - - 0 0 - - 45 $35,415,200 $787,004 $739,900 66 46 108% 14 15 $15,119,800 $1,007,987 $1,000,000 15 7 118% 7 2 $1,582,000 $791,000 $791,000 5 3 97% 15 1 $950,000 $950,000 $950,000 2 1 136% 3 11 $7,799,400 $709,036 $738,000 8 5 102% 16 2 $1,305,000 $652,500 $652,500 2 2 96% 57 0 - - - 1 1 - - 3 $1,864,500 $621,500 $623,000 4 4 97% 17 1 $740,000 $740,000 $740,000 2 1 101% 3 0 - - - 3 3 - - 2 $1,173,000 $586,500 $586,500 11 8 98% 12 8 $4,881,500 $610,188 $594,000 13 11 100% 17 1 1 1 1 2 3 4 5
- 22. Toronto Real Estate Board Market Watch, April 2018 SUMMARY OF EXISTING HOME TRANSACTIONS CO-OP APARTMENT, APRIL 2018 ALL TREB AREAS 19 Sales Dollar Volume Average Price Median Price New Listings Active Listings Avg. SP / LP Average DOM TREB Total Halton Region Burlington Halton Hills Milton Oakville Peel Region Brampton Caledon Mississauga City of Toronto Toronto West Toronto Central Toronto East York Region Aurora E. Gwillimbury Georgina King Markham Newmarket Richmond Hill Vaughan Whitchurch-Stouffville Durham Region Ajax Brock Clarington Oshawa Pickering Scugog Uxbridge Whitby Dufferin County Orangeville Simcoe County Adjala-Tosorontio Bradford West GwillimburyEssa Innisfil New Tecumseth 7 $2,633,000 $376,143 $310,000 10 14 101% 28 1 $208,000 $208,000 $208,000 0 0 100% 14 1 $208,000 $208,000 $208,000 0 0 100% 14 0 - - - 0 0 - - 0 - - - 0 0 - - 0 - - - 0 0 - - 0 - - - 0 0 - - 0 - - - 0 0 - - 0 - - - 0 0 - - 0 - - - 0 0 - - 6 $2,425,000 $404,167 $352,500 7 11 101% 30 1 $310,000 $310,000 $310,000 4 6 103% 19 4 $1,889,000 $472,250 $425,000 3 5 101% 30 1 $226,000 $226,000 $226,000 0 0 98% 39 0 - - - 3 3 - - 0 - - - 0 0 - - 0 - - - 0 0 - - 0 - - - 0 0 - - 0 - - - 0 0 - - 0 - - - 1 1 - - 0 - - - 0 0 - - 0 - - - 1 1 - - 0 - - - 1 1 - - 0 - - - 0 0 - - 0 - - - 0 0 - - 0 - - - 0 0 - - 0 - - - 0 0 - - 0 - - - 0 0 - - 0 - - - 0 0 - - 0 - - - 0 0 - - 0 - - - 0 0 - - 0 - - - 0 0 - - 0 - - - 0 0 - - 0 - - - 0 0 - - 0 - - - 0 0 - - 0 - - - 0 0 - - 0 - - - 0 0 - - 0 - - - 0 0 - - 0 - - - 0 0 - - 0 - - - 0 0 - - 0 - - - 0 0 - - 1 1 1 1 2 3 4 5
- 23. Toronto Real Estate Board Market Watch, April 2018 SUMMARY OF EXISTING HOME TRANSACTIONS CO-OP APARTMENT, APRIL 2018 CITY OF TORONTO MUNICIPAL BREAKDOWN 20 Sales Dollar Volume Average Price Median Price New Listings Active Listings Avg. SP / LP Avg. DOM TREB Total City of Toronto Total Toronto West Toronto W01 Toronto W02 Toronto W03 Toronto W04 Toronto W05 Toronto W06 Toronto W07 Toronto W08 Toronto W09 Toronto W10 Toronto Central Toronto C01 Toronto C02 Toronto C03 Toronto C04 Toronto C06 Toronto C07 Toronto C08 Toronto C09 Toronto C10 Toronto C11 Toronto C12 Toronto C13 Toronto C14 Toronto C15 Toronto East Toronto E01 Toronto E02 Toronto E03 Toronto E04 Toronto E05 Toronto E06 Toronto E07 Toronto E08 Toronto E09 Toronto E10 Toronto E11 7 $2,633,000 $376,143 $310,000 10 14 101% 28 6 $2,425,000 $404,167 $352,500 7 11 101% 30 1 $310,000 $310,000 $310,000 4 6 103% 19 0 - - - 0 0 - - 0 - - - 0 1 - - 0 - - - 0 0 - - 0 - - - 0 0 - - 0 - - - 0 0 - - 1 $310,000 $310,000 $310,000 2 2 103% 19 0 - - - 0 0 - - 0 - - - 1 1 - - 0 - - - 1 2 - - 0 - - - 0 0 - - 4 $1,889,000 $472,250 $425,000 3 5 101% 30 0 - - - 0 0 - - 0 - - - 1 1 - - 1 $395,000 $395,000 $395,000 0 0 99% 14 1 $260,000 $260,000 $260,000 0 0 100% 24 0 - - - 0 1 - - 0 - - - 0 0 - - 0 - - - 0 0 - - 2 $1,234,000 $617,000 $617,000 1 2 102% 42 0 - - - 0 0 - - 0 - - - 0 0 - - 0 - - - 0 0 - - 0 - - - 0 0 - - 0 - - - 0 0 - - 0 - - - 1 1 - - 1 $226,000 $226,000 $226,000 0 0 98% 39 0 - - - 0 0 - - 0 - - - 0 0 - - 0 - - - 0 0 - - 1 $226,000 $226,000 $226,000 0 0 98% 39 0 - - - 0 0 - - 0 - - - 0 0 - - 0 - - - 0 0 - - 0 - - - 0 0 - - 0 - - - 0 0 - - 0 - - - 0 0 - - 0 - - - 0 0 - - 1 1 1 1 2 3 4 5
- 24. Toronto Real Estate Board Market Watch, April 2018 SUMMARY OF EXISTING HOME TRANSACTIONS DETACHED CONDOMINIUM, APRIL 2018 ALL TREB AREAS 21 Sales Dollar Volume Average Price Median Price New Listings Active Listings Avg. SP / LP Avg. DOM TREB Total Halton Region Burlington Halton Hills Milton Oakville Peel Region Brampton Caledon Mississauga City of Toronto Toronto West Toronto Central Toronto East York Region Aurora E. Gwillimbury Georgina King Markham Newmarket Richmond Hill Vaughan Whitchurch-Stouffville Durham Region Ajax Brock Clarington Oshawa Pickering Scugog Uxbridge Whitby Dufferin County Orangeville Simcoe County Adjala-Tosorontio Bradford West GwillimburyEssa Innisfil New Tecumseth 5 $2,683,000 $536,600 $480,000 11 32 99% 22 1 $830,000 $830,000 $830,000 0 2 98% 17 1 $830,000 $830,000 $830,000 0 2 98% 17 0 - - - 0 0 - - 0 - - - 0 0 - - 0 - - - 0 0 - - 0 - - - 0 4 - - 0 - - - 0 0 - - 0 - - - 0 3 - - 0 - - - 0 1 - - 0 - - - 1 1 - - 0 - - - 0 0 - - 0 - - - 0 0 - - 0 - - - 1 1 - - 0 - - - 1 1 - - 0 - - - 0 0 - - 0 - - - 0 0 - - 0 - - - 0 0 - - 0 - - - 0 0 - - 0 - - - 1 1 - - 0 - - - 0 0 - - 0 - - - 0 0 - - 0 - - - 0 0 - - 0 - - - 0 0 - - 3 $1,373,000 $457,667 $468,000 2 1 101% 15 3 $1,373,000 $457,667 $468,000 2 1 101% 15 0 - - - 0 0 - - 0 - - - 0 0 - - 0 - - - 0 0 - - 0 - - - 0 0 - - 0 - - - 0 0 - - 0 - - - 0 0 - - 0 - - - 0 0 - - 0 - - - 0 0 - - 0 - - - 0 0 - - 1 $480,000 $480,000 $480,000 7 23 96% 48 0 - - - 0 0 - - 0 - - - 0 0 - - 0 - - - 0 0 - - 0 - - - 0 0 - - 1 $480,000 $480,000 $480,000 7 23 96% 48 1 1 1 1 2 3 4 5
- 25. Toronto Real Estate Board Market Watch, April 2018 SUMMARY OF EXISTING HOME TRANSACTIONS DETACHED CONDOMINIUM, APRIL 2018 CITY OF TORONTO MUNICIPAL BREAKDOWN 22 Sales Dollar Volume Average Price Median Price New Listings Active Listings Avg. SP / LP Avg. DOM TREB Total City of Toronto Total Toronto West Toronto W01 Toronto W02 Toronto W03 Toronto W04 Toronto W05 Toronto W06 Toronto W07 Toronto W08 Toronto W09 Toronto W10 Toronto Central Toronto C01 Toronto C02 Toronto C03 Toronto C04 Toronto C06 Toronto C07 Toronto C08 Toronto C09 Toronto C10 Toronto C11 Toronto C12 Toronto C13 Toronto C14 Toronto C15 Toronto East Toronto E01 Toronto E02 Toronto E03 Toronto E04 Toronto E05 Toronto E06 Toronto E07 Toronto E08 Toronto E09 Toronto E10 Toronto E11 5 $2,683,000 $536,600 $480,000 11 32 99% 22 0 - - - 1 1 - - 0 - - - 0 0 - - 0 - - - 0 0 - - 0 - - - 0 0 - - 0 - - - 0 0 - - 0 - - - 0 0 - - 0 - - - 0 0 - - 0 - - - 0 0 - - 0 - - - 0 0 - - 0 - - - 0 0 - - 0 - - - 0 0 - - 0 - - - 0 0 - - 0 - - - 0 0 - - 0 - - - 0 0 - - 0 - - - 0 0 - - 0 - - - 0 0 - - 0 - - - 0 0 - - 0 - - - 0 0 - - 0 - - - 0 0 - - 0 - - - 0 0 - - 0 - - - 0 0 - - 0 - - - 0 0 - - 0 - - - 0 0 - - 0 - - - 0 0 - - 0 - - - 0 0 - - 0 - - - 0 0 - - 0 - - - 0 0 - - 0 - - - 1 1 - - 0 - - - 0 0 - - 0 - - - 0 0 - - 0 - - - 0 0 - - 0 - - - 0 0 - - 0 - - - 0 0 - - 0 - - - 0 0 - - 0 - - - 0 0 - - 0 - - - 1 1 - - 0 - - - 0 0 - - 0 - - - 0 0 - - 0 - - - 0 0 - - 1 1 1 1 2 3 4 5
- 26. Toronto Real Estate Board Market Watch, April 2018 SUMMARY OF EXISTING HOME TRANSACTIONS CO-OWNERSHIP APARTMENT, APRIL 2018 ALL TREB AREAS 23 Sales Dollar Volume Average Price Median Price New Listings Active Listings Avg. SP / LP Avg. DOM TREB Total Halton Region Burlington Halton Hills Milton Oakville Peel Region Brampton Caledon Mississauga City of Toronto Toronto West Toronto Central Toronto East York Region Aurora E. Gwillimbury Georgina King Markham Newmarket Richmond Hill Vaughan Whitchurch-Stouffville Durham Region Ajax Brock Clarington Oshawa Pickering Scugog Uxbridge Whitby Dufferin County Orangeville Simcoe County Adjala-Tosorontio Bradford West GwillimburyEssa Innisfil New Tecumseth 3 $732,000 $244,000 $230,000 3 5 96% 21 0 - - - 0 0 - - 0 - - - 0 0 - - 0 - - - 0 0 - - 0 - - - 0 0 - - 0 - - - 0 0 - - 0 - - - 0 0 - - 0 - - - 0 0 - - 0 - - - 0 0 - - 0 - - - 0 0 - - 3 $732,000 $244,000 $230,000 3 5 96% 21 2 $410,000 $205,000 $205,000 1 2 94% 22 1 $322,000 $322,000 $322,000 2 3 98% 19 0 - - - 0 0 - - 0 - - - 0 0 - - 0 - - - 0 0 - - 0 - - - 0 0 - - 0 - - - 0 0 - - 0 - - - 0 0 - - 0 - - - 0 0 - - 0 - - - 0 0 - - 0 - - - 0 0 - - 0 - - - 0 0 - - 0 - - - 0 0 - - 0 - - - 0 0 - - 0 - - - 0 0 - - 0 - - - 0 0 - - 0 - - - 0 0 - - 0 - - - 0 0 - - 0 - - - 0 0 - - 0 - - - 0 0 - - 0 - - - 0 0 - - 0 - - - 0 0 - - 0 - - - 0 0 - - 0 - - - 0 0 - - 0 - - - 0 0 - - 0 - - - 0 0 - - 0 - - - 0 0 - - 0 - - - 0 0 - - 0 - - - 0 0 - - 0 - - - 0 0 - - 1 1 1 1 2 3 4 5
- 27. Toronto Real Estate Board Market Watch, April 2018 SUMMARY OF EXISTING HOME TRANSACTIONS CO-OWNERSHIP APARTMENT, APRIL 2018 CITY OF TORONTO MUNICIPAL BREAKDOWN 24 Sales Dollar Volume Average Price Median Price New Listings Active Listings Avg. SP / LP Avg. DOM TREB Total City of Toronto Total Toronto West Toronto W01 Toronto W02 Toronto W03 Toronto W04 Toronto W05 Toronto W06 Toronto W07 Toronto W08 Toronto W09 Toronto W10 Toronto Central Toronto C01 Toronto C02 Toronto C03 Toronto C04 Toronto C06 Toronto C07 Toronto C08 Toronto C09 Toronto C10 Toronto C11 Toronto C12 Toronto C13 Toronto C14 Toronto C15 Toronto East Toronto E01 Toronto E02 Toronto E03 Toronto E04 Toronto E05 Toronto E06 Toronto E07 Toronto E08 Toronto E09 Toronto E10 Toronto E11 3 $732,000 $244,000 $230,000 3 5 96% 21 3 $732,000 $244,000 $230,000 3 5 96% 21 2 $410,000 $205,000 $205,000 1 2 94% 22 0 - - - 0 0 - - 0 - - - 0 0 - - 0 - - - 0 0 - - 0 - - - 0 0 - - 2 $410,000 $205,000 $205,000 1 2 94% 22 0 - - - 0 0 - - 0 - - - 0 0 - - 0 - - - 0 0 - - 0 - - - 0 0 - - 0 - - - 0 0 - - 1 $322,000 $322,000 $322,000 2 3 98% 19 0 - - - 0 0 - - 0 - - - 0 0 - - 0 - - - 0 1 - - 0 - - - 1 1 - - 0 - - - 0 0 - - 0 - - - 0 0 - - 1 $322,000 $322,000 $322,000 0 0 98% 19 0 - - - 0 0 - - 0 - - - 0 0 - - 0 - - - 0 0 - - 0 - - - 0 0 - - 0 - - - 1 1 - - 0 - - - 0 0 - - 0 - - - 0 0 - - 0 - - - 0 0 - - 0 - - - 0 0 - - 0 - - - 0 0 - - 0 - - - 0 0 - - 0 - - - 0 0 - - 0 - - - 0 0 - - 0 - - - 0 0 - - 0 - - - 0 0 - - 0 - - - 0 0 - - 0 - - - 0 0 - - 0 - - - 0 0 - - 0 - - - 0 0 - - 1 1 1 1 2 3 4 5
- 28. Toronto Real Estate Board Market Watch, April 2018 FOCUS ON THE MLS HOME PRICE INDEX INDEX AND BENCHMARK PRICE, APRIL 2018 ALL TREB AREAS 25 Composite Single-Family Detached Single-Family Attached Townhouse Apartment Index Benchmark Yr./Yr. % Chg. Index Benchmark Yr./Yr. % Chg. Index Benchmark Yr./Yr. % Chg. Index Benchmark Yr./Yr. % Chg. Index Benchmark Yr./Yr. % Chg. TREB Total Halton Region Burlington Halton Hills Milton Oakville Peel Region Brampton Caledon Mississauga City of Toronto York Region Aurora East Gwillimbury Georgina King Markham Newmarket Richmond Hill Vaughan Whitchurch-Stouffville Durham Region Ajax Brock Clarington Oshawa Pickering Scugog Uxbridge Whitby Dufferin County Orangeville Simcoe County Adjala-Tosorontio Bradford West GwillimburyEssa Innisfil New Tecumseth 252.1 $766,300 -5.15% 250.5 $927,800 -10.34% 254.4 $715,600 -8.82% 253.1 $561,500 -2.62% 248.1 $495,600 10.17% 260.5 $840,000 -5.07% 260.0 $959,000 -7.01% 267.0 $683,100 -6.28% 277.1 $511,100 -2.94% 245.3 $453,600 5.87% 259.6 $705,200 -2.84% 257.2 $870,700 -6.61% 274.6 $658,800 1.37% 284.5 $522,900 -2.54% 245.1 $403,400 5.74% 246.1 $728,400 -5.09% 246.0 $800,400 -5.24% 250.3 $567,100 -7.09% 250.3 $402,300 -1.42% 232.6 $470,300 5.06% 245.7 $728,300 -8.08% 242.6 $868,200 -8.90% 255.2 $616,800 -8.89% 251.3 $416,100 -2.41% 242.9 $494,700 8.00% 270.7 $990,200 -5.58% 271.5 $1,147,700 -7.05% 277.2 $774,000 -7.63% 276.0 $597,200 -3.66% 246.5 $473,500 5.43% 241.5 $685,800 -5.63% 239.0 $843,800 -8.32% 242.3 $620,300 -7.77% 239.8 $514,800 -5.14% 237.9 $408,900 5.97% 241.4 $612,100 -6.22% 235.7 $688,400 -7.50% 242.1 $567,800 -6.78% 242.1 $442,500 -0.33% 227.3 $339,300 4.03% 216.6 $795,400 -2.96% 217.4 $826,400 -2.60% 241.0 $595,400 -4.97% - - - 237.9 $578,300 11.69% 243.6 $723,000 -5.36% 247.6 $988,900 -10.00% 242.8 $669,600 -9.20% 238.9 $537,000 -6.75% 239.7 $422,600 6.25% 256.2 $830,500 1.55% 252.9 $1,109,700 -9.55% 263.4 $878,100 -4.53% 257.3 $620,800 3.67% 254.7 $523,000 12.35% 256.8 $867,000 -14.54% 262.8 $1,000,100 -16.68% 257.4 $744,700 -17.02% 234.0 $599,100 -8.95% 218.9 $481,200 4.94% 254.2 $841,200 -15.27% 255.5 $965,100 -17.18% 252.3 $650,700 -15.28% 235.4 $643,600 -10.80% 241.9 $505,700 -0.94% 227.9 $778,700 -16.76% 231.5 $825,100 -16.76% 238.4 $498,600 -13.47% - - - - - - 233.1 $444,200 -16.96% 239.3 $451,200 -16.91% 237.2 $467,600 -17.44% - - - - - - 239.6 $1,002,400 -11.55% 241.4 $1,004,200 -11.58% 233.8 $547,500 -17.44% - - - 228.8 $625,800 10.69% 262.4 $909,300 -13.97% 283.9 $1,168,000 -16.43% 264.4 $790,700 -16.41% 226.9 $598,900 -6.20% 209.0 $500,300 2.10% 234.1 $689,800 -18.80% 236.1 $795,800 -19.75% 233.6 $550,200 -20.35% 225.8 $468,800 -12.62% 259.8 $437,600 -0.95% 277.5 $997,000 -15.24% 298.0 $1,266,400 -17.13% 272.7 $828,800 -17.59% 236.7 $599,400 -13.33% 223.3 $454,400 4.05% 253.0 $915,100 -10.60% 247.2 $1,027,600 -12.99% 256.5 $777,000 -15.68% 258.7 $703,400 -6.23% 223.2 $515,000 11.43% 255.4 $880,100 -19.58% 256.5 $920,200 -19.89% 225.1 $618,300 -18.97% 209.3 $375,700 -10.44% 248.0 $551,100 -1.35% 239.3 $558,900 -7.25% 234.7 $609,900 -7.53% 244.0 $487,300 -7.58% 252.2 $400,000 -8.22% 240.2 $409,500 1.14% 241.7 $595,500 -7.78% 240.5 $645,200 -8.59% 245.6 $530,000 -6.40% 231.6 $423,300 -13.84% 229.4 $371,900 3.85% 198.6 $361,300 4.20% 199.8 $364,600 4.23% - - - - - - - - - 235.1 $496,300 -8.45% 228.1 $549,300 -8.17% 229.7 $438,800 -10.66% 291.1 $456,000 -4.87% 218.3 $323,600 2.01% 244.6 $465,700 -7.10% 235.3 $502,100 -8.19% 256.8 $429,800 -6.79% 282.6 $350,900 -3.45% 231.4 $271,300 0.96% 241.3 $647,100 -6.76% 235.6 $733,800 -6.77% 244.0 $569,400 -4.46% 238.9 $426,600 -13.41% 273.0 $507,400 -0.51% 226.3 $590,900 3.05% 233.9 $605,900 3.22% 218.6 $457,500 2.58% - - - - - - 230.7 $705,100 2.22% 229.7 $709,300 2.45% 229.2 $562,400 2.96% - - - - - - 237.7 $619,000 -9.52% 238.7 $686,500 -10.03% 242.2 $533,600 -9.15% 200.0 $364,200 -10.87% 226.7 $411,000 2.16% 256.2 $587,300 4.40% 267.5 $609,600 4.29% 247.4 $463,600 2.87% - - - - - - 256.2 $587,300 4.40% 267.5 $609,600 4.29% 247.4 $463,600 2.87% - - - - - - 245.4 $550,900 -10.99% 239.8 $557,500 -12.06% 253.4 $474,800 -6.04% - - - - - - 221.6 $666,800 -14.80% 221.5 $668,100 -14.84% - - - - - - - - - 252.3 $614,900 -13.95% 237.6 $650,000 -14.16% 260.5 $541,400 -10.30% - - - - - - 250.0 $477,600 -6.99% 245.6 $489,700 -10.66% 260.1 $405,000 0.74% - - - - - - 256.7 $496,900 -11.30% 256.5 $495,800 -11.67% 259.4 $396,600 -3.57% - - - - - - 224.3 $533,000 -7.92% 216.8 $549,500 -11.37% 233.2 $422,600 -6.04% - - - - - -
- 29. Toronto Real Estate Board Market Watch, April 2018 FOCUS ON THE MLS HOME PRICE INDEX INDEX AND BENCHMARK PRICE, APRIL 2018 CITY OF TORONTO 26 Composite Single-Family Detached Single-Family Attached Townhouse Apartment Index Benchmark Yr./Yr. % Chg. Index Benchmark Yr./Yr. % Chg. Index Benchmark Yr./Yr. % Chg. Index Benchmark Yr./Yr. % Chg. Index Benchmark Yr./Yr. % Chg. TREB Total City of Toronto Toronto W01 Toronto W02 Toronto W03 Toronto W04 Toronto W05 Toronto W06 Toronto W07 Toronto W08 Toronto W09 Toronto W10 Toronto C01 Toronto C02 Toronto C03 Toronto C04 Toronto C06 Toronto C07 Toronto C08 Toronto C09 Toronto C10 Toronto C11 Toronto C12 Toronto C13 Toronto C14 Toronto C15 Toronto E01 Toronto E02 Toronto E03 Toronto E04 Toronto E05 Toronto E06 Toronto E07 Toronto E08 Toronto E09 Toronto E10 Toronto E11 252.1 $766,300 -5.15% 250.5 $927,800 -10.34% 254.4 $715,600 -8.82% 253.1 $561,500 -2.62% 248.1 $495,600 10.17% 256.2 $830,500 1.55% 252.9 $1,109,700 -9.55% 263.4 $878,100 -4.53% 257.3 $620,800 3.67% 254.7 $523,000 12.35% 244.6 $985,800 11.84% 240.4 $1,254,400 10.28% 262.6 $1,012,600 9.33% 248.5 $526,000 14.57% 241.8 $546,700 12.94% 265.4 $944,000 1.65% 251.4 $1,063,500 -2.93% 290.1 $889,200 -2.91% 269.1 $634,100 10.33% 261.1 $559,800 14.12% 283.4 $731,500 1.07% 286.1 $777,800 -0.73% 281.4 $720,800 -0.57% 270.2 $551,200 15.13% 262.6 $452,100 14.17% 250.4 $641,300 4.81% 251.9 $793,300 -1.79% 240.7 $696,000 1.69% 229.1 $541,400 15.18% 251.5 $368,300 18.46% 234.7 $557,100 8.91% 240.5 $797,600 -1.15% 221.4 $646,500 -0.94% 229.1 $416,000 15.47% 247.8 $325,600 29.67% 204.5 $598,900 0.99% 264.9 $845,800 -10.23% 215.0 $651,500 -6.15% 282.5 $840,200 5.61% 172.7 $437,600 15.21% 228.2 $978,200 -8.39% 241.5 $1,046,700 -9.99% 211.5 $867,200 -5.16% 0.0 $0 -100.00% 151.1 $612,700 8.01% 214.2 $854,000 1.81% 210.9 $1,102,400 -8.14% 208.0 $770,600 -4.72% 231.3 $556,300 10.67% 216.3 $450,400 11.15% 230.2 $579,500 -0.09% 228.6 $852,500 -6.43% 207.3 $596,100 1.02% 263.9 $686,600 15.14% 224.4 $287,800 6.45% 238.9 $550,300 4.19% 246.2 $738,600 0.29% 248.6 $636,200 1.39% 209.6 $446,400 11.79% 237.8 $330,300 8.63% 283.6 $702,600 9.24% 285.1 $1,079,700 2.63% 275.0 $962,700 2.04% 272.3 $774,200 4.05% 283.8 $590,800 10.21% 262.5 $1,255,600 5.25% 236.6 $1,890,400 -1.46% 273.8 $1,436,000 -1.83% 275.9 $1,232,100 3.49% 257.7 $734,200 13.18% 293.6 $1,535,100 0.96% 275.1 $1,690,700 -2.76% 295.4 $1,095,400 -2.19% - - - 320.1 $842,000 9.40% 242.3 $1,495,300 -5.02% 241.7 $1,702,900 -8.62% 242.4 $1,134,800 -10.78% 297.4 $1,093,200 6.98% 235.8 $545,400 13.09% 264.1 $1,028,500 -6.65% 257.2 $1,098,600 -17.62% 211.6 $782,800 -8.32% 252.2 $676,400 14.90% 273.1 $604,000 7.90% 256.3 $886,700 -2.84% 292.6 $1,338,500 -15.46% 211.4 $756,500 -15.27% 248.6 $700,700 13.72% 238.1 $581,400 11.11% 262.6 $686,900 7.14% 266.0 $1,551,900 -6.07% 261.7 $1,248,400 -7.46% 269.8 $704,600 8.31% 262.2 $566,800 8.44% 178.5 $1,263,500 6.06% 140.2 $1,761,100 -6.28% 155.8 $1,267,800 -4.77% 300.3 $1,644,700 15.50% 198.9 $659,000 12.18% 266.6 $1,040,800 5.79% 247.0 $1,525,000 -9.99% 237.7 $1,174,300 -9.76% 272.2 $794,500 8.92% 278.2 $664,300 14.67% 260.0 $920,000 7.88% 212.2 $1,445,500 -5.65% 237.2 $1,050,300 -5.72% 210.6 $364,800 -5.86% 301.4 $437,600 17.83% 218.0 $1,859,900 -7.98% 199.6 $2,139,200 -15.71% 255.0 $1,067,400 -17.37% 206.1 $824,600 -6.66% 276.1 $865,700 14.28% 241.4 $874,100 -6.83% 251.2 $1,339,600 -20.10% 226.0 $721,100 -19.43% 232.7 $672,700 -5.83% 233.1 $469,400 15.74% 266.8 $872,400 -1.95% 294.9 $1,595,400 -18.76% 235.9 $1,148,700 -17.14% 308.5 $830,800 1.98% 255.2 $642,700 7.09% 247.5 $803,200 -5.21% 301.6 $1,416,100 -19.98% 248.3 $807,200 -21.45% 273.3 $654,100 -2.25% 220.5 $512,700 16.05% 326.5 $1,019,700 3.29% 320.4 $1,130,600 -0.96% 328.3 $1,035,600 -0.48% 373.5 $682,800 2.61% 309.7 $734,600 22.27% 279.7 $1,049,900 1.67% 245.0 $1,116,300 1.45% 295.9 $990,900 1.65% 297.9 $894,400 0.30% 254.0 $694,400 -0.08% 266.5 $819,800 -3.69% 276.8 $933,200 -4.88% 257.9 $844,500 -3.77% - - - 230.6 $336,900 8.26% 255.1 $630,100 -2.74% 244.1 $719,700 -12.26% 255.0 $614,500 -8.99% 235.4 $510,300 0.30% 282.1 $432,800 18.93% 242.5 $636,300 -7.37% 251.3 $885,000 -19.56% 240.7 $663,200 -21.16% 245.9 $534,800 -5.68% 231.2 $454,100 18.99% 263.2 $734,000 -5.43% 265.5 $758,300 -6.78% 271.7 $646,300 -3.99% 241.2 $596,500 4.06% 243.5 $514,900 6.33% 256.9 $629,700 -1.00% 262.7 $861,000 -13.50% 251.7 $658,200 -12.60% 254.9 $552,200 -5.03% 254.1 $435,200 17.15% 260.2 $627,900 1.25% 253.9 $791,400 -8.34% 233.4 $605,000 -3.15% 246.6 $503,300 3.22% 275.7 $439,800 21.45% 246.8 $590,100 0.16% 242.4 $688,300 -14.41% 233.3 $570,600 -11.73% 267.1 $496,400 0.38% 248.8 $466,700 19.50% 255.7 $716,700 -6.68% 246.7 $790,500 -9.43% 238.2 $617,700 -6.73% 296.2 $517,100 -2.28% 248.4 $400,400 21.94% 257.9 $564,100 2.91% 261.8 $728,200 -5.59% 255.7 $579,100 -4.73% 206.9 $406,100 6.21% 292.9 $437,100 22.60%
- 30. Toronto Real Estate Board Market Watch, April 2018 HISTORIC ANNUAL STATISTICS 27 Year Sales Average Price 2006 2007 2008 2009 2010 2011 2012 2013 2014 2015 2016 83,084 $351,941 93,193 $376,236 74,552 $379,347 87,308 $395,460 85,545 $431,276 89,096 $465,014 85,496 $497,130 87,049 $522,958 92,782 $566,624 101,213 $622,121 113,040 $729,837 2017 MONTHLY STATISTICS NOTES 1 - Sales, dollar volume, average sale prices and median sale prices are based on firm transactions entered into the TREB MLS® system between the first and last day of the month/period being reported. 2 - New listings entered into the TREB MLS® system between the first and last day of the month/period being reported. 3 - Active listings at the end of the last day of the month/period being reported. 4 - Ratio of the average selling price to the average listing price for firm transactions entered into the TREB MLS® system between the first and last day of the month/period being reported. 5 - Average number of days on the market for firm transactions entered into the TREB MLS® system between the first and last day of the month/period being reported. 6 - Due to past changes to TREB's service area, caution should be exercised when making historical comparisons. 7 - Past monthly and year-to-date figures are revised on a monthly basis. 8 - SNLR = Sales-to-New Listings Ratio. Calculated using a 12-month moving average (sales/new listings). 9 - Mos. Inv. = Months of Inventory. Calculated using a 12-month moving average (active listings/sales). 2018 MONTHLY STATISTICS *For historic annual sales and average price data over a longer time frame go to: January February March April May June July August September October November December Year to Date 3,991 $735,754 5,158 $767,693 7,212 $784,715 7,792 $804,584 - - - - - - - - - - - - - - - - 24,153 $773,187 January February March April May June July August September October November December Annual 5,154 $768,427 7,954 $876,250 11,954 $915,125 11,468 $918,184 10,066 $862,149 7,893 $791,929 5,870 $745,896 6,308 $730,907 6,337 $774,705 7,071 $780,585 7,327 $761,385 4,879 $735,145 92,281 $822,614 1,6,7 1,7 1,7 http://www.torontorealestateboard.com/market_news/market_watch/historic_stats/p df/TREB_historic_statistics.pdf Copyright® 2018 Toronto Real Estate Board $779,40024,153