SlideShare a Scribd company logo
1 of 4
Download to read offline
averages to eliminate monthly and
seasonal variations.
If you are planning on selling your property,
call me for a free comparative market
analysis.
The median sales price for single-family,
re-sale was up 1.2% in October from
September. It was down 7.7% year-over-
year.
The average sales price for single-family,
re-sale homes was up 9.6% month-over-
month. Year-over-year, it was down
11.9%.
Sales of single-family, re-sale homes fell
39.3% year-over-year. Sales were up
8.2% from September. There were 184
homes sold in San Francisco last month.
The average since 2000 is 214.
The median sales price for condos/lofts
was down 4% year-over-year.
The average sales price was down 4.6%
year-over-year.
Sales of condos/lofts fell 38.9% year-over-
year. There were 212 condos/lofts sold
last month. The average since 2000 is
230.
The sales price to list price ratio, or what
buyers are paying over what sellers are
asking, fell from 106.4% to 104.4% for
homes. The ratio for condos/townhomes
fell from 100.4% to 99.9%.
Average days on market, or the time from
when a property is listed to when it goes
into contract, was 28 for homes and 42
for condos/lofts.
Sales momentum…
for homes dropped 6.2 points to –20.
Sales momentum for
condos/lofts was down
6.6 points to –26.2.
Pricing
momentum…
for single-family homes
fell 1.4 points to +2.1.
Pricing momentum for
condos/lofts fell 1 point
to +0.7.
Our momentum
statistics are based on
12-month moving
Sotheby's International Realty
117 Greenwich Street
San Francisco, CA 94111
Cell: (415) 819-2663
AnnieWilliamsSF@gmail.com
http://www.anniewilliamshomes.com
Annie Williams
ANNIE WILLIAMS | ANNIEWILLIAMSSF@GMAIL.COM | HTTP://WWW.ANNIEWILLIAMSHOMES.COM
Prices and Sales Continue to Drop
Local Market Trends November 2022
San Francisco
Oct 22 Month % Sep 22 Year % Oct 21
Median Price: 1,670,000
$ 1.2% 1,650,000
$ -7.7% 1,810,000
$
Average Price: 2,077,939
$ 9.6% 1,895,515
$ -11.9% 2,358,448
$
Home Sales: 184 8.2% 170 -39.3% 303
Sale/List Price Ratio: 104.4% -1.9% 106.4% -7.3% 112.6%
Days on Market: 28 12.0% 25 47.4% 19
(Condominiums)
Oct 22 Month % Sep 22 Year % Oct 21
Median Price: 1,200,000
$ 2.6% 1,170,000
$ -4.0% 1,250,000
$
Average Price: 1,402,101
$ 4.2% 1,345,866
$ -4.6% 1,469,110
$
Condo Sales: 212 10.4% 192 -38.9% 347
Sale/List Price Ratio: 99.9% -0.5% 100.4% -4.7% 104.8%
Days on Market: 42 -23.6% 55 23.5% 34
Trends at a Glance
(Single-family Homes)
0
10
20
30
40
50
60
70
80
90
1
0
A J O 1
1
A J O 1
2
A J O 1
3
A J O 1
4
A J O 1
5
A J O 1
6
A J O 1
7
A J O 1
8
A J O 1
9
A J O 2
0
A J O 2
1
A J O 2
2
A J O
San Francisco Homes: Days on Market
© 2022 rereport.com
Oct 28, 2022 -- Various central banks across the
globe continue to lift interest rates to combat inflation.
The European Central Bank lifted their policy rate by
another 75 basis points this week and the Bank of
Canada kicked their 50 basis points higher as well.
The Bank of England is also expected to join in short-
ly as well. The Federal Reserve also raised rates by
75 basis point, lifting the key U.S. monetary policy
rate to about a 15-year high.
With home prices high and mortgage rates both high
and rising, sales of new homes slumped anew in
September, declining 11% from August to a 603,000
annual rate of sale. At this pace, sales are also now
17.6% below year-ago levels and the prospect for an
uptick anytime soon aren't very good at the moment,
as mortgage rates legged up by quite a bit in Octo-
ber. The slowing in sales helped re-bloat inventories
of new homes for sale; at the present rate of sale,
there's an 8.1 month supply, with the 462,000 units
available representing the most available since
March 2008. With such stockpiles, new home con-
struction will need to slow or builders will need to trim
prices to move inventory. At least for September, that
didn't happen, as the median price of a new home
sold was $470,600, up from $435,800 in August.
The new house market is a fraction of the size of the
existing home portion. With conditions increasingly
adverse, potential homebuyers are staying away, and
the National Association of Realtors Pending Home
Sales Index for September shows this quite clearly.
The PHSI dropped by 10.2% in September and is
now some 31% below year-ago levels. The index's
actual level is now at about a 12-year low, if the hard-
stop of the early pandemic is left out of the compari-
son. Even then, September's value is only about a
little above that level, so very few contracts to buy
existing homes were executed last month. Even then,
it's very possible that some of those that were signed
will not come to fruition, and it looks like more slow-
ing is ahead for home sales, and that before we get
into the seasonal holiday effects that traditionally
dampen sales.
New home sales and pending existing home sales
were both down last month, and mortgage rates have
run up to 20-year highs this month. As such, there
are fewer and fewer applications for mortgages being
placed. In the week ending October 21, the Mortgage
Bankers Association reported another 1.7% decline
in requests for mortgage credit, pulled lower by a
(Continued on page 4)
ANNIE WILLIAMS
SOTHEBY'S INTERNATIONAL REALTY
ANNIEWILLIAMSSF@GMAIL.COM
2 Local Market Trends | San Francisco |
Next Up: More Fed
The chart above shows the National monthly
average for 30-year fixed rate mortgages as
compiled by http://www.freddiemac.com/.
November 2022
1.0% 3.0% 5.0% 7.0%
01-10
07-10
01-11
07-11
01-12
07-12
01-13
07-13
01-14
07-14
01-15
07-15
01-16
07-16
01-17
07-17
01-18
07-18
01-19
07-19
01-20
07-20
01-21
07-21
01-22
07-22
30-Year Fixed Mortgage Rates
0
50
100
150
200
250
300
350
$300
$800
$1,300
$1,800
$2,300
$2,800
1
0
A J O 1
1
A J O 1
2
A J O 1
3
A J O 1
4
A J O 1
5
A J O 1
6
A J O 1
7
A J O 1
8
A J O 1
9
A J O 2
0
A J O 2
1
A J O 2
2
A J O
San Francisco Homes: Sold Prices & Unit Sales
(3-month moving average — $000's)
Ave Med Units © 2022 rereport.com
Unit
Median Average Sales DOM SP/LP Median Average Sales Median Average Sales
San Francisco $1,670,000 $2,077,939 184 28 104.4% -7.7% -11.9% -39.3% 1.2% 9.6% 8.2%
D1: Northwest $1,700,000 $2,315,867 15 238 109.9% -26.1% -3.5% -51.6% -19.0% 9.5% -25.0%
D2: Central West $1,570,000 $1,688,485 33 30 111.1% -8.7% -10.2% -47.6% 1.3% 6.9% -19.5%
D3: Southwest $1,362,500 $1,385,500 12 40 100.9% -3.0% -12.1% -42.9% 0.9% -4.6% -7.7%
D4: Twin Peaks $1,662,500 $1,664,712 26 24 108.0% -13.0% -27.8% -42.2% -7.6% -23.7% -3.7%
D5: Central $2,202,000 $2,668,500 36 26 104.1% -15.7% -7.2% 0.0% -16.5% 2.5% 176.9%
D6: Central North $0 $0 0 0 0.0% n/a n/a n/a n/a n/a n/a
D7: North $5,379,625 $6,047,781 8 20 95.9% -23.1% -26.9% -42.9% 55.9% 68.7% 0.0%
D8: Northeast $2,794,500 $2,794,500 2 86 94.8% -25.5% -36.4% -60.0% -25.0% -25.0% 0.0%
D9: Central East $2,050,000 $1,969,333 15 19 107.7% 0.0% -12.4% -55.9% 24.2% 10.1% -11.8%
D10: Southeast $1,125,000 $1,161,343 33 30 101.4% -8.5% -3.2% -34.0% 7.1% 10.0% 17.9%
October Sales Statistics
(Single-family Homes)
Prices Yearly Change Monthly Change
Table Definitions
_______________
Median Price
The price at which 50% of prices
were higher and 50% were lower.
Average Price
Add all prices and divide by the
number of sales.
SP/LP
Sales price to list price ratio or the
price paid for the property divided
by the asking price.
DOI
Days of Inventory, or how many
days it would take to sell all the
property for sale at the current rate
of sales.
Pend
Property under contract to sell that
hasn’t closed escrow.
Inven
Number pf properties actively for
sale as of the last day of the month.
Local Market Trends | San Francisco | 3
November 2022
ANNIE WILLIAMS
SOTHEBY'S INTERNATIONAL REALTY
ANNIEWILLIAMSSF@GMAIL.COM
80.0%
85.0%
90.0%
95.0%
100.0%
105.0%
110.0%
115.0%
120.0%
125.0%
1
0
A J O 1
1
A J O 1
2
A J O 1
3
A J O 1
4
A J O 1
5
A J O 1
6
A J O 1
7
A J O 1
8
A J O 1
9
A J O 2
0
A J O 2
1
A J O 2
2
A J O
San Francisco Homes: Sales Price to List Price Ratio
© 2022 rereport.com
-30.0
-20.0
-10.0
0.0
10.0
20.0
30.0
40.0
0
6
A J O 0
7
A J O 0
8
A J O 0
9
A J O 1
0
A J O 1
1
A J O 1
2
A J O 1
3
A J O 1
4
A J O 1
5
A J O 1
6
A J O 1
7
A J O 1
8
A J O 1
9
A J O 2
0
A J O 2
1
A J O 2
2
A J O
San Francisco Homes: Sales Momentum
Sales Pricing © 2022 rereport.com
0
100
200
300
400
500
$300
$500
$700
$900
$1,100
$1,300
$1,500
$1,700
1
0
A J O 1
1
A J O 1
2
A J O 1
3
A J O 1
4
A J O 1
5
A J O 1
6
A J O 1
7
A J O 1
8
A J O 1
9
A J O 2
0
A J O 2
1
A J O 2
2
A J O
San Francisco Condos: Sold Prices & Unit Sales
(3-month moving average — $000's)
Ave Med Units © 2022 rereport.com
Unit
Median Average Sales DOM SP/LP Median Average Sales Median Average Sales
San Francisco $1,200,000 $1,402,101 212 42 99.9% -4.0% -4.6% -38.9% 2.6% 4.2% 10.4%
D1: Northwest $1,050,000 $1,321,923 13 32 101.4% -27.6% -20.8% -13.3% -30.7% -9.1% 85.7%
D2: Central West $853,000 $886,000 3 17 104.5% -27.9% -31.6% -40.0% -45.2% -43.1% 50.0%
D3: Southwest $605,000 $632,258 3 77 101.4% -32.6% -30.7% 0.0% -29.0% -27.7% 0.0%
D4: Twin Peaks $802,500 $802,500 2 90 100.0% -6.7% -21.4% -71.4% -7.5% -2.2% -66.7%
D5: Central $1,500,000 $1,509,979 48 22 100.6% 7.1% 4.5% -7.7% 7.1% 6.4% 92.0%
D6: Central North $1,237,500 $1,252,895 26 38 103.1% -6.6% -8.5% -42.2% 12.3% 11.7% 52.9%
D7: North $1,562,500 $2,041,727 22 34 98.1% -9.4% -5.2% -40.5% 12.1% 12.3% 83.3%
D8: Northeast $1,130,000 $1,650,806 31 53 98.3% 13.2% 15.1% -57.5% -5.8% 3.6% -24.4%
D9: Central East $1,083,125 $1,194,043 56 47 99.4% -26.2% -31.9% -6.7% -1.5% -4.5% -21.1%
D10: Southeast $694,500 $735,875 8 130 101.0% -18.3% -14.4% 33.3% -11.0% -0.9% 33.3%
October Sales Statistics
(Condos/TICs/Co-ops/Lofts)
Prices Yearly Change Monthly Change
San Francisco
This Real Estate Report is published and copyrighted by http://rereport.com.
Information contained herein is deemed accurate and correct, but no warranty is implied or given.
Annie Williams
Sotheby's International Realty
117 Greenwich Street
San Francisco, CA 94111
Go online to see the full report with the district by district breakdown: https://rereport.com/sf/aw/
2.3% drop in purchase-money mortgages requests
as refinance applications remained unchanged
from the prior week. The current twenty-year highs
for mortgage rates and corresponding twenty-odd
year lows for mortgage applications go hand-in-
hand.
(Continued from page 2)
2009 2010 2011 2012 2013 2014 2015 2016 2017 2018 2019 2020 2021 2022
Condos 1,568 2,001 2,160 2,639 2,597 2,706 2,393 2,290 2,367 2,550 2,356 2,059 3,536 2,630
Homes 1,680 1,950 2,010 2,144 2,261 2,009 2,104 2,025 1,875 1,845 1,798 1,704 2,415 1,969
0
1,000
2,000
3,000
4,000
5,000
6,000
7,000
Property Sales
(Year-to-Date)
© 2021 rereport.com

More Related Content

Similar to Annie Williams Real Estate Report, Nov 2022

Annie Williams Real Estate Report - February 2022
Annie Williams Real Estate Report - February 2022Annie Williams Real Estate Report - February 2022
Annie Williams Real Estate Report - February 2022Annie Williams
 
Annie Williams Real Estate Report - August 2023
Annie Williams Real Estate Report - August 2023Annie Williams Real Estate Report - August 2023
Annie Williams Real Estate Report - August 2023Annie Williams
 
Annie Williams Real Estate Report - April 2023
Annie Williams Real Estate Report - April 2023Annie Williams Real Estate Report - April 2023
Annie Williams Real Estate Report - April 2023Annie Williams
 
Annie Williams Real Estate Report - July 2020
Annie Williams Real Estate Report - July 2020Annie Williams Real Estate Report - July 2020
Annie Williams Real Estate Report - July 2020Jon Weaver
 
Annie Williams Real Estate Report-September 2023-9.pdf
Annie Williams Real Estate Report-September 2023-9.pdfAnnie Williams Real Estate Report-September 2023-9.pdf
Annie Williams Real Estate Report-September 2023-9.pdfAnnie Williams
 
Annie Williams Real Estate Report - August 2020
Annie Williams Real Estate Report - August 2020Annie Williams Real Estate Report - August 2020
Annie Williams Real Estate Report - August 2020Jon Weaver
 
Annie Williams Real Estate Report - March 2020
Annie Williams Real Estate Report - March 2020Annie Williams Real Estate Report - March 2020
Annie Williams Real Estate Report - March 2020Jon Weaver
 
Annie Williams Real Estate Report - September 2021
Annie Williams Real Estate Report - September 2021Annie Williams Real Estate Report - September 2021
Annie Williams Real Estate Report - September 2021Annie Williams
 
Annie Williams Real Estate Report - June 2020
Annie Williams Real Estate Report - June 2020Annie Williams Real Estate Report - June 2020
Annie Williams Real Estate Report - June 2020Jon Weaver
 
Annie Williams Real Estate Report - January 2021
Annie Williams Real Estate Report - January 2021Annie Williams Real Estate Report - January 2021
Annie Williams Real Estate Report - January 2021Jon Weaver
 
Annie Williams Real Estate Report - February 2020
Annie Williams Real Estate Report - February 2020Annie Williams Real Estate Report - February 2020
Annie Williams Real Estate Report - February 2020Jon Weaver
 
Annie Williams Real Estate Report - November 2021
Annie Williams Real Estate Report - November 2021Annie Williams Real Estate Report - November 2021
Annie Williams Real Estate Report - November 2021Annie Williams
 
Annie Williams Real Estate Report - August 2021
Annie Williams Real Estate Report - August 2021Annie Williams Real Estate Report - August 2021
Annie Williams Real Estate Report - August 2021Annie Williams
 
Annie Williams Real Estate Report - February 2021
Annie Williams Real Estate Report - February 2021Annie Williams Real Estate Report - February 2021
Annie Williams Real Estate Report - February 2021Annie Williams
 
Annie Williams Real Estate Report - October 2021
Annie Williams Real Estate Report - October 2021Annie Williams Real Estate Report - October 2021
Annie Williams Real Estate Report - October 2021Annie Williams
 
Annie Williams Real Estate Report - April 2019
Annie Williams Real Estate Report - April 2019Annie Williams Real Estate Report - April 2019
Annie Williams Real Estate Report - April 2019Jon Weaver
 
Annie Williams Real Estate Report - December 2020
Annie Williams Real Estate Report - December 2020Annie Williams Real Estate Report - December 2020
Annie Williams Real Estate Report - December 2020Jon Weaver
 
Annie Williams Real Estate Report - October 2019
Annie Williams Real Estate Report - October 2019Annie Williams Real Estate Report - October 2019
Annie Williams Real Estate Report - October 2019Jon Weaver
 
Annie Williams Real Estate Report - March 2022
Annie Williams Real Estate Report - March 2022Annie Williams Real Estate Report - March 2022
Annie Williams Real Estate Report - March 2022Annie Williams
 
Annie Williams Real Estate Report - May 2020
Annie Williams Real Estate Report - May 2020Annie Williams Real Estate Report - May 2020
Annie Williams Real Estate Report - May 2020Jon Weaver
 

Similar to Annie Williams Real Estate Report, Nov 2022 (20)

Annie Williams Real Estate Report - February 2022
Annie Williams Real Estate Report - February 2022Annie Williams Real Estate Report - February 2022
Annie Williams Real Estate Report - February 2022
 
Annie Williams Real Estate Report - August 2023
Annie Williams Real Estate Report - August 2023Annie Williams Real Estate Report - August 2023
Annie Williams Real Estate Report - August 2023
 
Annie Williams Real Estate Report - April 2023
Annie Williams Real Estate Report - April 2023Annie Williams Real Estate Report - April 2023
Annie Williams Real Estate Report - April 2023
 
Annie Williams Real Estate Report - July 2020
Annie Williams Real Estate Report - July 2020Annie Williams Real Estate Report - July 2020
Annie Williams Real Estate Report - July 2020
 
Annie Williams Real Estate Report-September 2023-9.pdf
Annie Williams Real Estate Report-September 2023-9.pdfAnnie Williams Real Estate Report-September 2023-9.pdf
Annie Williams Real Estate Report-September 2023-9.pdf
 
Annie Williams Real Estate Report - August 2020
Annie Williams Real Estate Report - August 2020Annie Williams Real Estate Report - August 2020
Annie Williams Real Estate Report - August 2020
 
Annie Williams Real Estate Report - March 2020
Annie Williams Real Estate Report - March 2020Annie Williams Real Estate Report - March 2020
Annie Williams Real Estate Report - March 2020
 
Annie Williams Real Estate Report - September 2021
Annie Williams Real Estate Report - September 2021Annie Williams Real Estate Report - September 2021
Annie Williams Real Estate Report - September 2021
 
Annie Williams Real Estate Report - June 2020
Annie Williams Real Estate Report - June 2020Annie Williams Real Estate Report - June 2020
Annie Williams Real Estate Report - June 2020
 
Annie Williams Real Estate Report - January 2021
Annie Williams Real Estate Report - January 2021Annie Williams Real Estate Report - January 2021
Annie Williams Real Estate Report - January 2021
 
Annie Williams Real Estate Report - February 2020
Annie Williams Real Estate Report - February 2020Annie Williams Real Estate Report - February 2020
Annie Williams Real Estate Report - February 2020
 
Annie Williams Real Estate Report - November 2021
Annie Williams Real Estate Report - November 2021Annie Williams Real Estate Report - November 2021
Annie Williams Real Estate Report - November 2021
 
Annie Williams Real Estate Report - August 2021
Annie Williams Real Estate Report - August 2021Annie Williams Real Estate Report - August 2021
Annie Williams Real Estate Report - August 2021
 
Annie Williams Real Estate Report - February 2021
Annie Williams Real Estate Report - February 2021Annie Williams Real Estate Report - February 2021
Annie Williams Real Estate Report - February 2021
 
Annie Williams Real Estate Report - October 2021
Annie Williams Real Estate Report - October 2021Annie Williams Real Estate Report - October 2021
Annie Williams Real Estate Report - October 2021
 
Annie Williams Real Estate Report - April 2019
Annie Williams Real Estate Report - April 2019Annie Williams Real Estate Report - April 2019
Annie Williams Real Estate Report - April 2019
 
Annie Williams Real Estate Report - December 2020
Annie Williams Real Estate Report - December 2020Annie Williams Real Estate Report - December 2020
Annie Williams Real Estate Report - December 2020
 
Annie Williams Real Estate Report - October 2019
Annie Williams Real Estate Report - October 2019Annie Williams Real Estate Report - October 2019
Annie Williams Real Estate Report - October 2019
 
Annie Williams Real Estate Report - March 2022
Annie Williams Real Estate Report - March 2022Annie Williams Real Estate Report - March 2022
Annie Williams Real Estate Report - March 2022
 
Annie Williams Real Estate Report - May 2020
Annie Williams Real Estate Report - May 2020Annie Williams Real Estate Report - May 2020
Annie Williams Real Estate Report - May 2020
 

More from Annie Williams

Annie Williams Real Estate Report - March 2021
Annie Williams Real Estate Report - March 2021Annie Williams Real Estate Report - March 2021
Annie Williams Real Estate Report - March 2021Annie Williams
 
Annie Williams - San Francisco Demographics - Household Expenditures
Annie Williams - San Francisco Demographics - Household ExpendituresAnnie Williams - San Francisco Demographics - Household Expenditures
Annie Williams - San Francisco Demographics - Household ExpendituresAnnie Williams
 
Annie Williams - San Francisco Demographics - Commuting
Annie Williams - San Francisco Demographics - CommutingAnnie Williams - San Francisco Demographics - Commuting
Annie Williams - San Francisco Demographics - CommutingAnnie Williams
 
Annie Williams - San Francisco Demographics - Employment
Annie Williams - San Francisco Demographics - EmploymentAnnie Williams - San Francisco Demographics - Employment
Annie Williams - San Francisco Demographics - EmploymentAnnie Williams
 
Annie Williams - San Francisco Demographics - Median Income by Education & Sex
Annie Williams - San Francisco Demographics - Median Income by Education & SexAnnie Williams - San Francisco Demographics - Median Income by Education & Sex
Annie Williams - San Francisco Demographics - Median Income by Education & SexAnnie Williams
 
Annie Williams - San Francisco Demographics - Education
Annie Williams - San Francisco Demographics - EducationAnnie Williams - San Francisco Demographics - Education
Annie Williams - San Francisco Demographics - EducationAnnie Williams
 
Annie Williams Real Estate Report - March 2018
Annie Williams Real Estate Report - March 2018Annie Williams Real Estate Report - March 2018
Annie Williams Real Estate Report - March 2018Annie Williams
 
Annie Williams - San Francisco Demographics - Beliefs & Practices
Annie Williams - San Francisco Demographics - Beliefs & PracticesAnnie Williams - San Francisco Demographics - Beliefs & Practices
Annie Williams - San Francisco Demographics - Beliefs & PracticesAnnie Williams
 
Annie Williams - San Francisco Demographics - Religion or Lack Thereof
Annie Williams - San Francisco Demographics - Religion or Lack ThereofAnnie Williams - San Francisco Demographics - Religion or Lack Thereof
Annie Williams - San Francisco Demographics - Religion or Lack ThereofAnnie Williams
 
Annie Williams Real Estate Report July-Aug 2017
Annie Williams Real Estate Report July-Aug 2017Annie Williams Real Estate Report July-Aug 2017
Annie Williams Real Estate Report July-Aug 2017Annie Williams
 
Annie W: Interest Rate History since 1995
Annie W: Interest Rate History since 1995Annie W: Interest Rate History since 1995
Annie W: Interest Rate History since 1995Annie Williams
 
Annie Williams 2016 Annual Real Estate Report
Annie Williams 2016 Annual Real Estate ReportAnnie Williams 2016 Annual Real Estate Report
Annie Williams 2016 Annual Real Estate ReportAnnie Williams
 
Annie Williams Real Estate Report Nov-Dec 2016
Annie Williams Real Estate Report Nov-Dec 2016Annie Williams Real Estate Report Nov-Dec 2016
Annie Williams Real Estate Report Nov-Dec 2016Annie Williams
 

More from Annie Williams (13)

Annie Williams Real Estate Report - March 2021
Annie Williams Real Estate Report - March 2021Annie Williams Real Estate Report - March 2021
Annie Williams Real Estate Report - March 2021
 
Annie Williams - San Francisco Demographics - Household Expenditures
Annie Williams - San Francisco Demographics - Household ExpendituresAnnie Williams - San Francisco Demographics - Household Expenditures
Annie Williams - San Francisco Demographics - Household Expenditures
 
Annie Williams - San Francisco Demographics - Commuting
Annie Williams - San Francisco Demographics - CommutingAnnie Williams - San Francisco Demographics - Commuting
Annie Williams - San Francisco Demographics - Commuting
 
Annie Williams - San Francisco Demographics - Employment
Annie Williams - San Francisco Demographics - EmploymentAnnie Williams - San Francisco Demographics - Employment
Annie Williams - San Francisco Demographics - Employment
 
Annie Williams - San Francisco Demographics - Median Income by Education & Sex
Annie Williams - San Francisco Demographics - Median Income by Education & SexAnnie Williams - San Francisco Demographics - Median Income by Education & Sex
Annie Williams - San Francisco Demographics - Median Income by Education & Sex
 
Annie Williams - San Francisco Demographics - Education
Annie Williams - San Francisco Demographics - EducationAnnie Williams - San Francisco Demographics - Education
Annie Williams - San Francisco Demographics - Education
 
Annie Williams Real Estate Report - March 2018
Annie Williams Real Estate Report - March 2018Annie Williams Real Estate Report - March 2018
Annie Williams Real Estate Report - March 2018
 
Annie Williams - San Francisco Demographics - Beliefs & Practices
Annie Williams - San Francisco Demographics - Beliefs & PracticesAnnie Williams - San Francisco Demographics - Beliefs & Practices
Annie Williams - San Francisco Demographics - Beliefs & Practices
 
Annie Williams - San Francisco Demographics - Religion or Lack Thereof
Annie Williams - San Francisco Demographics - Religion or Lack ThereofAnnie Williams - San Francisco Demographics - Religion or Lack Thereof
Annie Williams - San Francisco Demographics - Religion or Lack Thereof
 
Annie Williams Real Estate Report July-Aug 2017
Annie Williams Real Estate Report July-Aug 2017Annie Williams Real Estate Report July-Aug 2017
Annie Williams Real Estate Report July-Aug 2017
 
Annie W: Interest Rate History since 1995
Annie W: Interest Rate History since 1995Annie W: Interest Rate History since 1995
Annie W: Interest Rate History since 1995
 
Annie Williams 2016 Annual Real Estate Report
Annie Williams 2016 Annual Real Estate ReportAnnie Williams 2016 Annual Real Estate Report
Annie Williams 2016 Annual Real Estate Report
 
Annie Williams Real Estate Report Nov-Dec 2016
Annie Williams Real Estate Report Nov-Dec 2016Annie Williams Real Estate Report Nov-Dec 2016
Annie Williams Real Estate Report Nov-Dec 2016
 

Recently uploaded

SSPL The Strand Abodes Kharadi Pune Brochure.pdf
SSPL The Strand Abodes Kharadi Pune Brochure.pdfSSPL The Strand Abodes Kharadi Pune Brochure.pdf
SSPL The Strand Abodes Kharadi Pune Brochure.pdfabbu831446
 
Call Girls In Mundka Industrial Metro@꧂8447779280 ↬Enjoy ꧂Escort Service in ...
Call Girls In Mundka Industrial Metro@꧂8447779280 ↬Enjoy ꧂Escort Service in  ...Call Girls In Mundka Industrial Metro@꧂8447779280 ↬Enjoy ꧂Escort Service in  ...
Call Girls In Mundka Industrial Metro@꧂8447779280 ↬Enjoy ꧂Escort Service in ...asmaqueen5
 
9990771857 Call Girls in Noida Sector 03 Noida (Call Girls) Delhi
9990771857 Call Girls in Noida Sector 03 Noida (Call Girls) Delhi9990771857 Call Girls in Noida Sector 03 Noida (Call Girls) Delhi
9990771857 Call Girls in Noida Sector 03 Noida (Call Girls) Delhidelhimodel235
 
9990771857 Call Girls in Noida Sector 1 Noida (Call Girls) Delhi
9990771857 Call Girls in Noida Sector 1 Noida (Call Girls) Delhi9990771857 Call Girls in Noida Sector 1 Noida (Call Girls) Delhi
9990771857 Call Girls in Noida Sector 1 Noida (Call Girls) Delhidelhimodel235
 
Rustomjee The Panorama At Pali Hill, Bandra West, Mumbai - Brochure.pdf
Rustomjee The Panorama At Pali Hill, Bandra West, Mumbai - Brochure.pdfRustomjee The Panorama At Pali Hill, Bandra West, Mumbai - Brochure.pdf
Rustomjee The Panorama At Pali Hill, Bandra West, Mumbai - Brochure.pdfmonikasharma630
 
SVN Live 4.22.24 Weekly Property Broadcast
SVN Live 4.22.24 Weekly Property BroadcastSVN Live 4.22.24 Weekly Property Broadcast
SVN Live 4.22.24 Weekly Property BroadcastSVN International Corp.
 
Puravankara Mundhwa Pune E-Brochure.pdf
Puravankara Mundhwa Pune  E-Brochure.pdfPuravankara Mundhwa Pune  E-Brochure.pdf
Puravankara Mundhwa Pune E-Brochure.pdfManishSaxena95
 
Low Rate Call Girls in Tughlakabad Delhi Call 9990771857
Low Rate Call Girls in Tughlakabad Delhi Call 9990771857Low Rate Call Girls in Tughlakabad Delhi Call 9990771857
Low Rate Call Girls in Tughlakabad Delhi Call 9990771857delhimodel235
 
Call Girls In The Lalit New Delhi ❤️8860477959 Good Looking Escorts In 24/7 D...
Call Girls In The Lalit New Delhi ❤️8860477959 Good Looking Escorts In 24/7 D...Call Girls In The Lalit New Delhi ❤️8860477959 Good Looking Escorts In 24/7 D...
Call Girls In The Lalit New Delhi ❤️8860477959 Good Looking Escorts In 24/7 D...lizamodels9
 
Omaxe Dwarka In Delhi E Brochure Pdf
Omaxe Dwarka In Delhi E Brochure     PdfOmaxe Dwarka In Delhi E Brochure     Pdf
Omaxe Dwarka In Delhi E Brochure Pdfashiyadav24
 
How to Build Multifamily and Laneway Suites in Toronto!! (feat. Expert Archi...
How to Build Multifamily and Laneway Suites  in Toronto!! (feat. Expert Archi...How to Build Multifamily and Laneway Suites  in Toronto!! (feat. Expert Archi...
How to Build Multifamily and Laneway Suites in Toronto!! (feat. Expert Archi...Volition Properties
 
Namrata 7 Plumeria Drive Pimpri Chinchwad Pune Brochure.pdf
Namrata 7 Plumeria Drive Pimpri Chinchwad Pune Brochure.pdfNamrata 7 Plumeria Drive Pimpri Chinchwad Pune Brochure.pdf
Namrata 7 Plumeria Drive Pimpri Chinchwad Pune Brochure.pdfPrachiRudram
 
Call Girls in Sarai Kale Khan Delhi 💯Call Us 🔝8264348440🔝
Call Girls in Sarai Kale Khan Delhi 💯Call Us 🔝8264348440🔝Call Girls in Sarai Kale Khan Delhi 💯Call Us 🔝8264348440🔝
Call Girls in Sarai Kale Khan Delhi 💯Call Us 🔝8264348440🔝soniya singh
 
9990771857 Call Girls in Noida Sector 11 Noida (Call Girls) Delhi
9990771857 Call Girls in Noida Sector 11 Noida (Call Girls) Delhi9990771857 Call Girls in Noida Sector 11 Noida (Call Girls) Delhi
9990771857 Call Girls in Noida Sector 11 Noida (Call Girls) Delhidelhimodel235
 
Call Girls in Khan Market 9654467111 ESCORTS SERVICE
Call Girls in Khan Market 9654467111 ESCORTS SERVICECall Girls in Khan Market 9654467111 ESCORTS SERVICE
Call Girls in Khan Market 9654467111 ESCORTS SERVICESapana Sha
 
9990771857 Call Girls in Noida Sector 06 Noida (Call Girls) Delhi
9990771857 Call Girls in Noida Sector 06 Noida (Call Girls) Delhi9990771857 Call Girls in Noida Sector 06 Noida (Call Girls) Delhi
9990771857 Call Girls in Noida Sector 06 Noida (Call Girls) Delhidelhimodel235
 
Shapoorji Pallonji Parkwest Sequoia Tower Bangalore.pdf
Shapoorji Pallonji Parkwest Sequoia Tower Bangalore.pdfShapoorji Pallonji Parkwest Sequoia Tower Bangalore.pdf
Shapoorji Pallonji Parkwest Sequoia Tower Bangalore.pdfashiyadav24
 
Low Rate Call Girls in Akshardham Delhi Call 9990771857
Low Rate Call Girls in Akshardham   Delhi Call 9990771857Low Rate Call Girls in Akshardham   Delhi Call 9990771857
Low Rate Call Girls in Akshardham Delhi Call 9990771857delhimodel235
 
The Omaxe State Dwarka Delhi-broucher.pdf.pdf
The Omaxe State Dwarka Delhi-broucher.pdf.pdfThe Omaxe State Dwarka Delhi-broucher.pdf.pdf
The Omaxe State Dwarka Delhi-broucher.pdf.pdfkratirudram
 

Recently uploaded (20)

SSPL The Strand Abodes Kharadi Pune Brochure.pdf
SSPL The Strand Abodes Kharadi Pune Brochure.pdfSSPL The Strand Abodes Kharadi Pune Brochure.pdf
SSPL The Strand Abodes Kharadi Pune Brochure.pdf
 
Call Girls In Mundka Industrial Metro@꧂8447779280 ↬Enjoy ꧂Escort Service in ...
Call Girls In Mundka Industrial Metro@꧂8447779280 ↬Enjoy ꧂Escort Service in  ...Call Girls In Mundka Industrial Metro@꧂8447779280 ↬Enjoy ꧂Escort Service in  ...
Call Girls In Mundka Industrial Metro@꧂8447779280 ↬Enjoy ꧂Escort Service in ...
 
9990771857 Call Girls in Noida Sector 03 Noida (Call Girls) Delhi
9990771857 Call Girls in Noida Sector 03 Noida (Call Girls) Delhi9990771857 Call Girls in Noida Sector 03 Noida (Call Girls) Delhi
9990771857 Call Girls in Noida Sector 03 Noida (Call Girls) Delhi
 
9990771857 Call Girls in Noida Sector 1 Noida (Call Girls) Delhi
9990771857 Call Girls in Noida Sector 1 Noida (Call Girls) Delhi9990771857 Call Girls in Noida Sector 1 Noida (Call Girls) Delhi
9990771857 Call Girls in Noida Sector 1 Noida (Call Girls) Delhi
 
Rustomjee The Panorama At Pali Hill, Bandra West, Mumbai - Brochure.pdf
Rustomjee The Panorama At Pali Hill, Bandra West, Mumbai - Brochure.pdfRustomjee The Panorama At Pali Hill, Bandra West, Mumbai - Brochure.pdf
Rustomjee The Panorama At Pali Hill, Bandra West, Mumbai - Brochure.pdf
 
SVN Live 4.22.24 Weekly Property Broadcast
SVN Live 4.22.24 Weekly Property BroadcastSVN Live 4.22.24 Weekly Property Broadcast
SVN Live 4.22.24 Weekly Property Broadcast
 
Puravankara Mundhwa Pune E-Brochure.pdf
Puravankara Mundhwa Pune  E-Brochure.pdfPuravankara Mundhwa Pune  E-Brochure.pdf
Puravankara Mundhwa Pune E-Brochure.pdf
 
Low Rate Call Girls in Tughlakabad Delhi Call 9990771857
Low Rate Call Girls in Tughlakabad Delhi Call 9990771857Low Rate Call Girls in Tughlakabad Delhi Call 9990771857
Low Rate Call Girls in Tughlakabad Delhi Call 9990771857
 
Call Girls In The Lalit New Delhi ❤️8860477959 Good Looking Escorts In 24/7 D...
Call Girls In The Lalit New Delhi ❤️8860477959 Good Looking Escorts In 24/7 D...Call Girls In The Lalit New Delhi ❤️8860477959 Good Looking Escorts In 24/7 D...
Call Girls In The Lalit New Delhi ❤️8860477959 Good Looking Escorts In 24/7 D...
 
Omaxe Dwarka In Delhi E Brochure Pdf
Omaxe Dwarka In Delhi E Brochure     PdfOmaxe Dwarka In Delhi E Brochure     Pdf
Omaxe Dwarka In Delhi E Brochure Pdf
 
How to Build Multifamily and Laneway Suites in Toronto!! (feat. Expert Archi...
How to Build Multifamily and Laneway Suites  in Toronto!! (feat. Expert Archi...How to Build Multifamily and Laneway Suites  in Toronto!! (feat. Expert Archi...
How to Build Multifamily and Laneway Suites in Toronto!! (feat. Expert Archi...
 
Namrata 7 Plumeria Drive Pimpri Chinchwad Pune Brochure.pdf
Namrata 7 Plumeria Drive Pimpri Chinchwad Pune Brochure.pdfNamrata 7 Plumeria Drive Pimpri Chinchwad Pune Brochure.pdf
Namrata 7 Plumeria Drive Pimpri Chinchwad Pune Brochure.pdf
 
Call Girls in Sarai Kale Khan Delhi 💯Call Us 🔝8264348440🔝
Call Girls in Sarai Kale Khan Delhi 💯Call Us 🔝8264348440🔝Call Girls in Sarai Kale Khan Delhi 💯Call Us 🔝8264348440🔝
Call Girls in Sarai Kale Khan Delhi 💯Call Us 🔝8264348440🔝
 
9990771857 Call Girls in Noida Sector 11 Noida (Call Girls) Delhi
9990771857 Call Girls in Noida Sector 11 Noida (Call Girls) Delhi9990771857 Call Girls in Noida Sector 11 Noida (Call Girls) Delhi
9990771857 Call Girls in Noida Sector 11 Noida (Call Girls) Delhi
 
Call Girls in Khan Market 9654467111 ESCORTS SERVICE
Call Girls in Khan Market 9654467111 ESCORTS SERVICECall Girls in Khan Market 9654467111 ESCORTS SERVICE
Call Girls in Khan Market 9654467111 ESCORTS SERVICE
 
Hot call girls in Moti Bagh🔝 9953056974 🔝 escort Service
Hot call girls in Moti Bagh🔝 9953056974 🔝 escort ServiceHot call girls in Moti Bagh🔝 9953056974 🔝 escort Service
Hot call girls in Moti Bagh🔝 9953056974 🔝 escort Service
 
9990771857 Call Girls in Noida Sector 06 Noida (Call Girls) Delhi
9990771857 Call Girls in Noida Sector 06 Noida (Call Girls) Delhi9990771857 Call Girls in Noida Sector 06 Noida (Call Girls) Delhi
9990771857 Call Girls in Noida Sector 06 Noida (Call Girls) Delhi
 
Shapoorji Pallonji Parkwest Sequoia Tower Bangalore.pdf
Shapoorji Pallonji Parkwest Sequoia Tower Bangalore.pdfShapoorji Pallonji Parkwest Sequoia Tower Bangalore.pdf
Shapoorji Pallonji Parkwest Sequoia Tower Bangalore.pdf
 
Low Rate Call Girls in Akshardham Delhi Call 9990771857
Low Rate Call Girls in Akshardham   Delhi Call 9990771857Low Rate Call Girls in Akshardham   Delhi Call 9990771857
Low Rate Call Girls in Akshardham Delhi Call 9990771857
 
The Omaxe State Dwarka Delhi-broucher.pdf.pdf
The Omaxe State Dwarka Delhi-broucher.pdf.pdfThe Omaxe State Dwarka Delhi-broucher.pdf.pdf
The Omaxe State Dwarka Delhi-broucher.pdf.pdf
 

Annie Williams Real Estate Report, Nov 2022

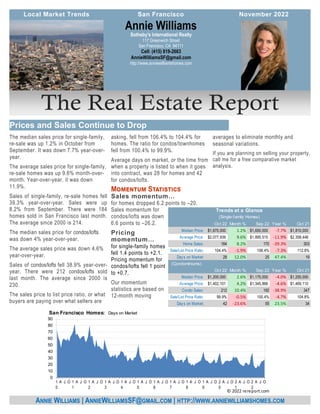
  • 1. averages to eliminate monthly and seasonal variations. If you are planning on selling your property, call me for a free comparative market analysis. The median sales price for single-family, re-sale was up 1.2% in October from September. It was down 7.7% year-over- year. The average sales price for single-family, re-sale homes was up 9.6% month-over- month. Year-over-year, it was down 11.9%. Sales of single-family, re-sale homes fell 39.3% year-over-year. Sales were up 8.2% from September. There were 184 homes sold in San Francisco last month. The average since 2000 is 214. The median sales price for condos/lofts was down 4% year-over-year. The average sales price was down 4.6% year-over-year. Sales of condos/lofts fell 38.9% year-over- year. There were 212 condos/lofts sold last month. The average since 2000 is 230. The sales price to list price ratio, or what buyers are paying over what sellers are asking, fell from 106.4% to 104.4% for homes. The ratio for condos/townhomes fell from 100.4% to 99.9%. Average days on market, or the time from when a property is listed to when it goes into contract, was 28 for homes and 42 for condos/lofts. Sales momentum… for homes dropped 6.2 points to –20. Sales momentum for condos/lofts was down 6.6 points to –26.2. Pricing momentum… for single-family homes fell 1.4 points to +2.1. Pricing momentum for condos/lofts fell 1 point to +0.7. Our momentum statistics are based on 12-month moving Sotheby's International Realty 117 Greenwich Street San Francisco, CA 94111 Cell: (415) 819-2663 AnnieWilliamsSF@gmail.com http://www.anniewilliamshomes.com Annie Williams ANNIE WILLIAMS | ANNIEWILLIAMSSF@GMAIL.COM | HTTP://WWW.ANNIEWILLIAMSHOMES.COM Prices and Sales Continue to Drop Local Market Trends November 2022 San Francisco Oct 22 Month % Sep 22 Year % Oct 21 Median Price: 1,670,000 $ 1.2% 1,650,000 $ -7.7% 1,810,000 $ Average Price: 2,077,939 $ 9.6% 1,895,515 $ -11.9% 2,358,448 $ Home Sales: 184 8.2% 170 -39.3% 303 Sale/List Price Ratio: 104.4% -1.9% 106.4% -7.3% 112.6% Days on Market: 28 12.0% 25 47.4% 19 (Condominiums) Oct 22 Month % Sep 22 Year % Oct 21 Median Price: 1,200,000 $ 2.6% 1,170,000 $ -4.0% 1,250,000 $ Average Price: 1,402,101 $ 4.2% 1,345,866 $ -4.6% 1,469,110 $ Condo Sales: 212 10.4% 192 -38.9% 347 Sale/List Price Ratio: 99.9% -0.5% 100.4% -4.7% 104.8% Days on Market: 42 -23.6% 55 23.5% 34 Trends at a Glance (Single-family Homes) 0 10 20 30 40 50 60 70 80 90 1 0 A J O 1 1 A J O 1 2 A J O 1 3 A J O 1 4 A J O 1 5 A J O 1 6 A J O 1 7 A J O 1 8 A J O 1 9 A J O 2 0 A J O 2 1 A J O 2 2 A J O San Francisco Homes: Days on Market © 2022 rereport.com
  • 2. Oct 28, 2022 -- Various central banks across the globe continue to lift interest rates to combat inflation. The European Central Bank lifted their policy rate by another 75 basis points this week and the Bank of Canada kicked their 50 basis points higher as well. The Bank of England is also expected to join in short- ly as well. The Federal Reserve also raised rates by 75 basis point, lifting the key U.S. monetary policy rate to about a 15-year high. With home prices high and mortgage rates both high and rising, sales of new homes slumped anew in September, declining 11% from August to a 603,000 annual rate of sale. At this pace, sales are also now 17.6% below year-ago levels and the prospect for an uptick anytime soon aren't very good at the moment, as mortgage rates legged up by quite a bit in Octo- ber. The slowing in sales helped re-bloat inventories of new homes for sale; at the present rate of sale, there's an 8.1 month supply, with the 462,000 units available representing the most available since March 2008. With such stockpiles, new home con- struction will need to slow or builders will need to trim prices to move inventory. At least for September, that didn't happen, as the median price of a new home sold was $470,600, up from $435,800 in August. The new house market is a fraction of the size of the existing home portion. With conditions increasingly adverse, potential homebuyers are staying away, and the National Association of Realtors Pending Home Sales Index for September shows this quite clearly. The PHSI dropped by 10.2% in September and is now some 31% below year-ago levels. The index's actual level is now at about a 12-year low, if the hard- stop of the early pandemic is left out of the compari- son. Even then, September's value is only about a little above that level, so very few contracts to buy existing homes were executed last month. Even then, it's very possible that some of those that were signed will not come to fruition, and it looks like more slow- ing is ahead for home sales, and that before we get into the seasonal holiday effects that traditionally dampen sales. New home sales and pending existing home sales were both down last month, and mortgage rates have run up to 20-year highs this month. As such, there are fewer and fewer applications for mortgages being placed. In the week ending October 21, the Mortgage Bankers Association reported another 1.7% decline in requests for mortgage credit, pulled lower by a (Continued on page 4) ANNIE WILLIAMS SOTHEBY'S INTERNATIONAL REALTY ANNIEWILLIAMSSF@GMAIL.COM 2 Local Market Trends | San Francisco | Next Up: More Fed The chart above shows the National monthly average for 30-year fixed rate mortgages as compiled by http://www.freddiemac.com/. November 2022 1.0% 3.0% 5.0% 7.0% 01-10 07-10 01-11 07-11 01-12 07-12 01-13 07-13 01-14 07-14 01-15 07-15 01-16 07-16 01-17 07-17 01-18 07-18 01-19 07-19 01-20 07-20 01-21 07-21 01-22 07-22 30-Year Fixed Mortgage Rates 0 50 100 150 200 250 300 350 $300 $800 $1,300 $1,800 $2,300 $2,800 1 0 A J O 1 1 A J O 1 2 A J O 1 3 A J O 1 4 A J O 1 5 A J O 1 6 A J O 1 7 A J O 1 8 A J O 1 9 A J O 2 0 A J O 2 1 A J O 2 2 A J O San Francisco Homes: Sold Prices & Unit Sales (3-month moving average — $000's) Ave Med Units © 2022 rereport.com Unit Median Average Sales DOM SP/LP Median Average Sales Median Average Sales San Francisco $1,670,000 $2,077,939 184 28 104.4% -7.7% -11.9% -39.3% 1.2% 9.6% 8.2% D1: Northwest $1,700,000 $2,315,867 15 238 109.9% -26.1% -3.5% -51.6% -19.0% 9.5% -25.0% D2: Central West $1,570,000 $1,688,485 33 30 111.1% -8.7% -10.2% -47.6% 1.3% 6.9% -19.5% D3: Southwest $1,362,500 $1,385,500 12 40 100.9% -3.0% -12.1% -42.9% 0.9% -4.6% -7.7% D4: Twin Peaks $1,662,500 $1,664,712 26 24 108.0% -13.0% -27.8% -42.2% -7.6% -23.7% -3.7% D5: Central $2,202,000 $2,668,500 36 26 104.1% -15.7% -7.2% 0.0% -16.5% 2.5% 176.9% D6: Central North $0 $0 0 0 0.0% n/a n/a n/a n/a n/a n/a D7: North $5,379,625 $6,047,781 8 20 95.9% -23.1% -26.9% -42.9% 55.9% 68.7% 0.0% D8: Northeast $2,794,500 $2,794,500 2 86 94.8% -25.5% -36.4% -60.0% -25.0% -25.0% 0.0% D9: Central East $2,050,000 $1,969,333 15 19 107.7% 0.0% -12.4% -55.9% 24.2% 10.1% -11.8% D10: Southeast $1,125,000 $1,161,343 33 30 101.4% -8.5% -3.2% -34.0% 7.1% 10.0% 17.9% October Sales Statistics (Single-family Homes) Prices Yearly Change Monthly Change
  • 3. Table Definitions _______________ Median Price The price at which 50% of prices were higher and 50% were lower. Average Price Add all prices and divide by the number of sales. SP/LP Sales price to list price ratio or the price paid for the property divided by the asking price. DOI Days of Inventory, or how many days it would take to sell all the property for sale at the current rate of sales. Pend Property under contract to sell that hasn’t closed escrow. Inven Number pf properties actively for sale as of the last day of the month. Local Market Trends | San Francisco | 3 November 2022 ANNIE WILLIAMS SOTHEBY'S INTERNATIONAL REALTY ANNIEWILLIAMSSF@GMAIL.COM 80.0% 85.0% 90.0% 95.0% 100.0% 105.0% 110.0% 115.0% 120.0% 125.0% 1 0 A J O 1 1 A J O 1 2 A J O 1 3 A J O 1 4 A J O 1 5 A J O 1 6 A J O 1 7 A J O 1 8 A J O 1 9 A J O 2 0 A J O 2 1 A J O 2 2 A J O San Francisco Homes: Sales Price to List Price Ratio © 2022 rereport.com -30.0 -20.0 -10.0 0.0 10.0 20.0 30.0 40.0 0 6 A J O 0 7 A J O 0 8 A J O 0 9 A J O 1 0 A J O 1 1 A J O 1 2 A J O 1 3 A J O 1 4 A J O 1 5 A J O 1 6 A J O 1 7 A J O 1 8 A J O 1 9 A J O 2 0 A J O 2 1 A J O 2 2 A J O San Francisco Homes: Sales Momentum Sales Pricing © 2022 rereport.com 0 100 200 300 400 500 $300 $500 $700 $900 $1,100 $1,300 $1,500 $1,700 1 0 A J O 1 1 A J O 1 2 A J O 1 3 A J O 1 4 A J O 1 5 A J O 1 6 A J O 1 7 A J O 1 8 A J O 1 9 A J O 2 0 A J O 2 1 A J O 2 2 A J O San Francisco Condos: Sold Prices & Unit Sales (3-month moving average — $000's) Ave Med Units © 2022 rereport.com Unit Median Average Sales DOM SP/LP Median Average Sales Median Average Sales San Francisco $1,200,000 $1,402,101 212 42 99.9% -4.0% -4.6% -38.9% 2.6% 4.2% 10.4% D1: Northwest $1,050,000 $1,321,923 13 32 101.4% -27.6% -20.8% -13.3% -30.7% -9.1% 85.7% D2: Central West $853,000 $886,000 3 17 104.5% -27.9% -31.6% -40.0% -45.2% -43.1% 50.0% D3: Southwest $605,000 $632,258 3 77 101.4% -32.6% -30.7% 0.0% -29.0% -27.7% 0.0% D4: Twin Peaks $802,500 $802,500 2 90 100.0% -6.7% -21.4% -71.4% -7.5% -2.2% -66.7% D5: Central $1,500,000 $1,509,979 48 22 100.6% 7.1% 4.5% -7.7% 7.1% 6.4% 92.0% D6: Central North $1,237,500 $1,252,895 26 38 103.1% -6.6% -8.5% -42.2% 12.3% 11.7% 52.9% D7: North $1,562,500 $2,041,727 22 34 98.1% -9.4% -5.2% -40.5% 12.1% 12.3% 83.3% D8: Northeast $1,130,000 $1,650,806 31 53 98.3% 13.2% 15.1% -57.5% -5.8% 3.6% -24.4% D9: Central East $1,083,125 $1,194,043 56 47 99.4% -26.2% -31.9% -6.7% -1.5% -4.5% -21.1% D10: Southeast $694,500 $735,875 8 130 101.0% -18.3% -14.4% 33.3% -11.0% -0.9% 33.3% October Sales Statistics (Condos/TICs/Co-ops/Lofts) Prices Yearly Change Monthly Change
  • 4. San Francisco This Real Estate Report is published and copyrighted by http://rereport.com. Information contained herein is deemed accurate and correct, but no warranty is implied or given. Annie Williams Sotheby's International Realty 117 Greenwich Street San Francisco, CA 94111 Go online to see the full report with the district by district breakdown: https://rereport.com/sf/aw/ 2.3% drop in purchase-money mortgages requests as refinance applications remained unchanged from the prior week. The current twenty-year highs for mortgage rates and corresponding twenty-odd year lows for mortgage applications go hand-in- hand. (Continued from page 2) 2009 2010 2011 2012 2013 2014 2015 2016 2017 2018 2019 2020 2021 2022 Condos 1,568 2,001 2,160 2,639 2,597 2,706 2,393 2,290 2,367 2,550 2,356 2,059 3,536 2,630 Homes 1,680 1,950 2,010 2,144 2,261 2,009 2,104 2,025 1,875 1,845 1,798 1,704 2,415 1,969 0 1,000 2,000 3,000 4,000 5,000 6,000 7,000 Property Sales (Year-to-Date) © 2021 rereport.com