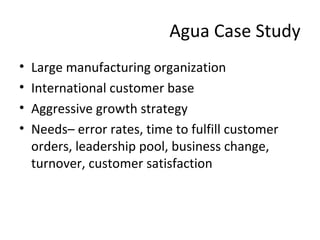
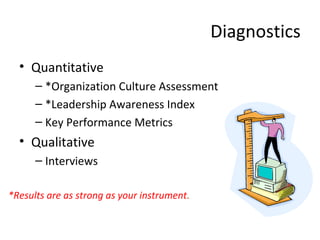
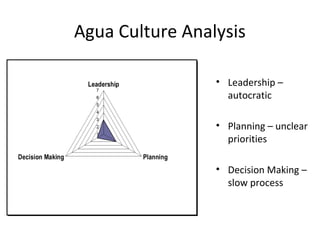
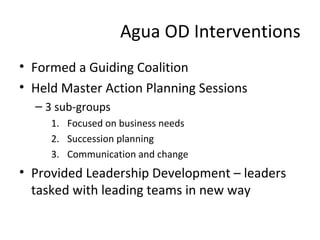
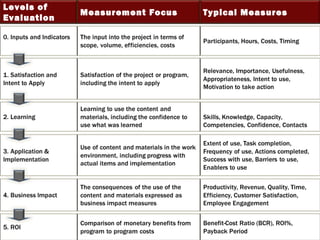
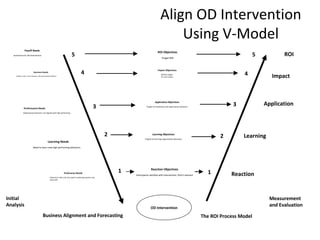
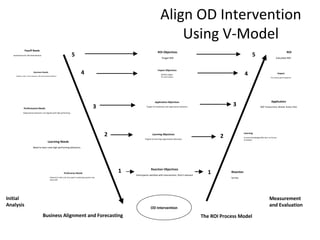
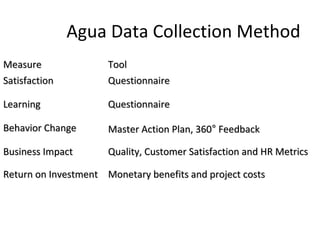
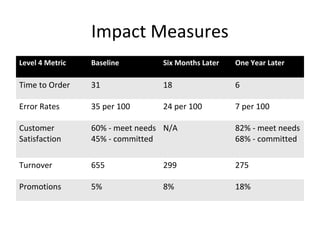
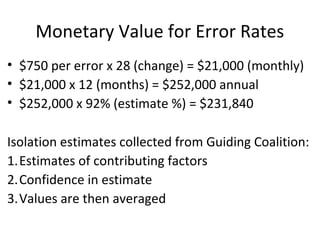
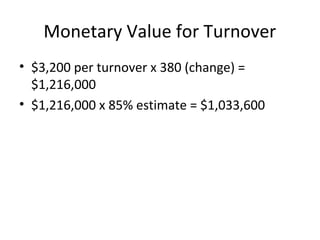
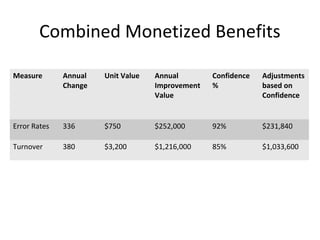
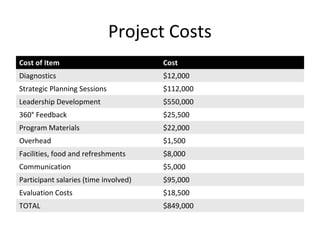
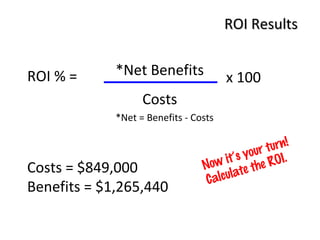
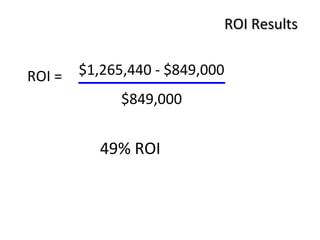
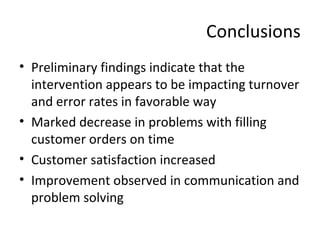
Measuring the 
Success of 
Organization 
Development 
Lizette Zuniga, Ph.D. 
Director, ROI Implementation 
ROI Institute 
www.roiinstitute.net
Goals of this Session 
1. Identify best practices in ROI and Human 
Capital Analytics 
2. Using abbreviated organization culture 
assessment tool, rate the organization 
culture in which you work 
3. Using an organization culture case study, 
align OD intervention with business 
4. Using a case study, apply ROI methodology 
to measure the impact of an OD intervention
Maximizing Results: Best Practices for 
ROI and Human Capital Analytics 
Business Alignment Analytics Maturity 
Predictive Analytics 
What could happen? 
Prescriptive Analytics 
What should happen? What is 
the best course of action? 
Aspirational Experienced Transformed 
1-3 Communicating Results 
Descriptive Analytics 
Describes what happened. 
Descriptive Analytics 
Describes what happened. 
Predictive Analytics 
What could happen? 
Prescriptive Analytics 
What should happen? What is 
the best course of action? 
Use analytics to justify 
actions. 
Building upon aspirational 
level and use data to make 
decisions. 
Uses advanced rigor in data 
analysis to guide future 
strategy
Predict the BEST outcome 
By providing the right intervention in 
the most effective way, building the 
necessary capability, and by 
removing barriers or obstacles from 
their path, business measures are 
more likely to improve and 
ultimately impact the bottom line. 
1-4 Communicating Results
OD defined as a planned intervention of 
change for group, team, or organization 
to improve organization. 
Organization 
Development (OD) 
Examples – change management, team 
building, 360 feedback, organization 
culture assessment and learning.
What is culture?
“Organizational culture is the way 
we do things around here.” 
- Burke & Litwin, 1995
Culture is the collective values, 
assumptions, beliefs and paradigms 
that create the expected and 
accepted behaviors of the 
organization.
For Example… 
 Hierarchical vs. Empowered 
 Risk Avoiders vs. Risk Takers 
 Reactive vs. Proactive 
 Sales Driven vs. Profit Driven 
 Cautious vs. Innovative
How does an organization 
behave? 
•How to make decisions 
•How to organize resources 
•How to supervise people 
•and so on...
Organization 
Culture Assessment 
Complete Capstone 
Organization Culture 
Abbreviated Profile 
Refer to your handout.
Agua Case Study 
• Large manufacturing organization 
• International customer base 
• Aggressive growth strategy 
• Needs– error rates, time to fulfill customer 
orders, leadership pool, business change, 
turnover, customer satisfaction
Diagnostics 
• Quantitative 
– *Organization Culture Assessment 
– *Leadership Awareness Index 
– Key Performance Metrics 
• Qualitative 
– Interviews 
*Results are as strong as your instrument.
Agua Culture Analysis 
• Leadership – 
autocratic 
• Planning – unclear 
priorities 
• Decision Making – 
slow process
Agua Culture Analysis 
• Leadership – autocratic 
• Planning – unclear priorities 
• Decision Making – slow process
Agua OD Interventions 
• Formed a Guiding Coalition 
• Held Master Action Planning Sessions 
– 3 sub-groups 
1. Focused on business needs 
2. Succession planning 
3. Communication and change 
• Provided Leadership Development – leaders 
tasked with leading teams in new way
Levels of 
Evaluation Measurement Focus Typical Measures
Application Objectives 
Targets for leadership and organization behaviors 
Learning Objectives 
Targets for learning organization behaviors 
OD Intervention 
Learning Needs 
Payoff Needs 
investment for OD Intervention 
Need to learn new high performing behaviors 
Preference Needs 
Relevant to their job, time spent in planning sessions was 
value add 
Learning 
Business Alignment and Forecasting The ROI Process Model 
ROI 
Impact 
Measurement 
and Evaluation 
Reaction 
Application 
Reaction Objectives 
Participants satisfied with intervention, find it relevant 
Performance Needs 
Organization behaviors not aligned with high performing 
Impact Objectives 
Identify targets 
for each metric 
Business Needs 
Quality, Costs, Time, Revenue, HR and Customer Metrics 
ROI Objectives 
Target ROI 
5 
4 
3 
2 
5 
4 
3 
2 
1 1 
Initial 
Analysis 
Align OD Intervention 
Using V-Model
Application Objectives 
Targets for leadership and organization behaviors 
Learning Objectives 
Targets for learning organization behaviors 
OD Intervention 
Learning Needs 
Payoff Needs 
investment for OD Intervention 
Need to learn new high performing behaviors 
Preference Needs 
Relevant to their job, time spent in planning sessions was 
value add 
Business Alignment and Forecasting The ROI Process Model 
Calculate ROI 
Application 
ROI 
360° Assessment, Master Action Plan 
Measurement 
and Evaluation 
Reaction 
Survey 
Learning 
Increase Knowledge/skills item on Course 
Evaluation 
Impact 
Pre versus post measures 
Reaction Objectives 
Participants satisfied with intervention, find it relevant 
Performance Needs 
Organization behaviors not aligned with high performing 
Impact Objectives 
Identify targets 
for each metric 
Business Needs 
Quality, Costs, Time, Revenue, HR and Customer Metrics 
ROI Objectives 
Target ROI 
5 
4 
3 
2 
5 
4 
3 
2 
1 1 
Initial 
Analysis 
Align OD Intervention 
Using V-Model
Agua Data Collection Method 
MMeeaassuurree TTooooll 
SSaattiissffaaccttiioonn QQuueessttiioonnnnaaiirree 
LLeeaarrnniinngg QQuueessttiioonnnnaaiirree 
BBeehhaavviioorr CChhaannggee MMaasstteerr AAccttiioonn PPllaann,, 336600°° FFeeeeddbbaacckk 
BBuussiinneessss IImmppaacctt QQuuaalliittyy,, CCuussttoommeerr SSaattiissffaaccttiioonn aanndd HHRR MMeettrriiccss 
RReettuurrnn oonn IInnvveessttmmeenntt MMoonneettaarryy bbeenneeffiittss aanndd pprroojjeecctt ccoossttss
Impact Measures 
Level 4 Metric Baseline Six Months Later One Year Later 
Time to Order 31 18 6 
Error Rates 35 per 100 24 per 100 7 per 100 
Customer 
Satisfaction 
60% - meet needs 
45% - committed 
N/A 82% - meet needs 
68% - committed 
Turnover 655 299 275 
Promotions 5% 8% 18%
Monetary Value for Error Rates 
• $750 per error x 28 (change) = $21,000 (monthly) 
• $21,000 x 12 (months) = $252,000 annual 
• $252,000 x 92% (estimate %) = $231,840 
Isolation estimates collected from Guiding Coalition: 
1.Estimates of contributing factors 
2.Confidence in estimate 
3.Values are then averaged
Monetary Value for Turnover 
• $3,200 per turnover x 380 (change) = 
$1,216,000 
• $1,216,000 x 85% estimate = $1,033,600
Combined Monetized Benefits 
Measure Annual 
Change 
Unit Value Annual 
Improvement 
Value 
Confidence 
% 
Adjustments 
based on 
Confidence 
Error Rates 336 $750 $252,000 92% $231,840 
Turnover 380 $3,200 $1,216,000 85% $1,033,600
Project Costs 
Cost of Item Cost 
Diagnostics $12,000 
Strategic Planning Sessions $112,000 
Leadership Development $550,000 
360° Feedback $25,500 
Program Materials $22,000 
Overhead $1,500 
Facilities, food and refreshments $8,000 
Communication $5,000 
Participant salaries (time involved) $95,000 
Evaluation Costs $18,500 
TOTAL $849,000
ROI % = 
RROOII RReessuullttss 
*Net Benefits 
Costs 
*Net = Benefits - Costs 
Costs = $849,000 
Benefits = $1,265,440 
x 100 
Now it’s your turn! 
Calculate the ROI.
ROI = 
RROOII RReessuullttss 
$1,265,440 - $849,000 
$849,000 
49% ROI
AAssssuummppttiioonnss 
• High turnover in tight labor market impacts 
required hiring numbers 
• People leave their jobs because of supervisor 
• Estimates used in isolating the effects are 
credible way to determine contribution from 
intervention
Conclusions 
• Preliminary findings indicate that the 
intervention appears to be impacting turnover 
and error rates in favorable way 
• Marked decrease in problems with filling 
customer orders on time 
• Customer satisfaction increased 
• Improvement observed in communication and 
problem solving
• Provided with the case study, participants 
were instructed to brainstorm
Group 1 
 Smile Sheet 
— Why are you here? 
— Was this helpful / useful? 
— Are you motivated to take action? 
— Will you use what you learned? 
— Rate the importance of your current work?
Group 2 
 Learning 
— Pre-training vs. Post-training scoring 
 Time on (Learning curve) 
— Assessment during training 
 Confidence 
 Readiness 
 Competencies 
— Understanding key resources 
— Self knowledge 
 Knowing when I need help 
 Knowing enough to self correct
Group 3 
 Leadership Behavior 
— Before and after 
— Decision making process 
 Time 
 # ppi involved 
 Implementation success? 
— Change metrics from cultural assessment 
— Before and after interviews / survey 
 Managers and up 
 Managers and down 
— GAPS! Map (RR)
Internal Measures 
– Customer Satisfaction 
Group 4 
• On time orders / deliveries 
• Reduced returns / re-do’s 
• Surveys 
• Referrals 
– Quality 
– Staff morale 
• Impact of engagement 
• How they are engaged 
External Measures 
– What is most important to 
the customer? 
– What are you willing to do if 
you are satisfied?
Group 5 
 R/I 
— R = 
 Savings 
 Profit 
 Productivity 
 Personnel Turnover 
 Staff and Customer satisfaction 
— Intangibles 
 Goodwill 
 Morale 
 Identity 
 Loyalty 
— I = 
 Direct cost – consultant 
 Participation 
 Supplies 
 Facilities 
 Opportunities

OCA Sept 2014: Measuring Organization Development Interventions

  • 1.
    Measuring the Successof Organization Development Lizette Zuniga, Ph.D. Director, ROI Implementation ROI Institute www.roiinstitute.net
  • 2.
    Goals of thisSession 1. Identify best practices in ROI and Human Capital Analytics 2. Using abbreviated organization culture assessment tool, rate the organization culture in which you work 3. Using an organization culture case study, align OD intervention with business 4. Using a case study, apply ROI methodology to measure the impact of an OD intervention
  • 3.
    Maximizing Results: BestPractices for ROI and Human Capital Analytics Business Alignment Analytics Maturity Predictive Analytics What could happen? Prescriptive Analytics What should happen? What is the best course of action? Aspirational Experienced Transformed 1-3 Communicating Results Descriptive Analytics Describes what happened. Descriptive Analytics Describes what happened. Predictive Analytics What could happen? Prescriptive Analytics What should happen? What is the best course of action? Use analytics to justify actions. Building upon aspirational level and use data to make decisions. Uses advanced rigor in data analysis to guide future strategy
  • 4.
    Predict the BESToutcome By providing the right intervention in the most effective way, building the necessary capability, and by removing barriers or obstacles from their path, business measures are more likely to improve and ultimately impact the bottom line. 1-4 Communicating Results
  • 5.
    OD defined asa planned intervention of change for group, team, or organization to improve organization. Organization Development (OD) Examples – change management, team building, 360 feedback, organization culture assessment and learning.
  • 6.
  • 7.
    “Organizational culture isthe way we do things around here.” - Burke & Litwin, 1995
  • 8.
    Culture is thecollective values, assumptions, beliefs and paradigms that create the expected and accepted behaviors of the organization.
  • 9.
    For Example… Hierarchical vs. Empowered Risk Avoiders vs. Risk Takers Reactive vs. Proactive Sales Driven vs. Profit Driven Cautious vs. Innovative
  • 10.
    How does anorganization behave? •How to make decisions •How to organize resources •How to supervise people •and so on...
  • 11.
    Organization Culture Assessment Complete Capstone Organization Culture Abbreviated Profile Refer to your handout.
  • 12.
    Agua Case Study • Large manufacturing organization • International customer base • Aggressive growth strategy • Needs– error rates, time to fulfill customer orders, leadership pool, business change, turnover, customer satisfaction
  • 13.
    Diagnostics • Quantitative – *Organization Culture Assessment – *Leadership Awareness Index – Key Performance Metrics • Qualitative – Interviews *Results are as strong as your instrument.
  • 14.
    Agua Culture Analysis • Leadership – autocratic • Planning – unclear priorities • Decision Making – slow process
  • 15.
    Agua Culture Analysis • Leadership – autocratic • Planning – unclear priorities • Decision Making – slow process
  • 16.
    Agua OD Interventions • Formed a Guiding Coalition • Held Master Action Planning Sessions – 3 sub-groups 1. Focused on business needs 2. Succession planning 3. Communication and change • Provided Leadership Development – leaders tasked with leading teams in new way
  • 17.
    Levels of EvaluationMeasurement Focus Typical Measures
  • 18.
    Application Objectives Targetsfor leadership and organization behaviors Learning Objectives Targets for learning organization behaviors OD Intervention Learning Needs Payoff Needs investment for OD Intervention Need to learn new high performing behaviors Preference Needs Relevant to their job, time spent in planning sessions was value add Learning Business Alignment and Forecasting The ROI Process Model ROI Impact Measurement and Evaluation Reaction Application Reaction Objectives Participants satisfied with intervention, find it relevant Performance Needs Organization behaviors not aligned with high performing Impact Objectives Identify targets for each metric Business Needs Quality, Costs, Time, Revenue, HR and Customer Metrics ROI Objectives Target ROI 5 4 3 2 5 4 3 2 1 1 Initial Analysis Align OD Intervention Using V-Model
  • 19.
    Application Objectives Targetsfor leadership and organization behaviors Learning Objectives Targets for learning organization behaviors OD Intervention Learning Needs Payoff Needs investment for OD Intervention Need to learn new high performing behaviors Preference Needs Relevant to their job, time spent in planning sessions was value add Business Alignment and Forecasting The ROI Process Model Calculate ROI Application ROI 360° Assessment, Master Action Plan Measurement and Evaluation Reaction Survey Learning Increase Knowledge/skills item on Course Evaluation Impact Pre versus post measures Reaction Objectives Participants satisfied with intervention, find it relevant Performance Needs Organization behaviors not aligned with high performing Impact Objectives Identify targets for each metric Business Needs Quality, Costs, Time, Revenue, HR and Customer Metrics ROI Objectives Target ROI 5 4 3 2 5 4 3 2 1 1 Initial Analysis Align OD Intervention Using V-Model
  • 20.
    Agua Data CollectionMethod MMeeaassuurree TTooooll SSaattiissffaaccttiioonn QQuueessttiioonnnnaaiirree LLeeaarrnniinngg QQuueessttiioonnnnaaiirree BBeehhaavviioorr CChhaannggee MMaasstteerr AAccttiioonn PPllaann,, 336600°° FFeeeeddbbaacckk BBuussiinneessss IImmppaacctt QQuuaalliittyy,, CCuussttoommeerr SSaattiissffaaccttiioonn aanndd HHRR MMeettrriiccss RReettuurrnn oonn IInnvveessttmmeenntt MMoonneettaarryy bbeenneeffiittss aanndd pprroojjeecctt ccoossttss
  • 21.
    Impact Measures Level4 Metric Baseline Six Months Later One Year Later Time to Order 31 18 6 Error Rates 35 per 100 24 per 100 7 per 100 Customer Satisfaction 60% - meet needs 45% - committed N/A 82% - meet needs 68% - committed Turnover 655 299 275 Promotions 5% 8% 18%
  • 22.
    Monetary Value forError Rates • $750 per error x 28 (change) = $21,000 (monthly) • $21,000 x 12 (months) = $252,000 annual • $252,000 x 92% (estimate %) = $231,840 Isolation estimates collected from Guiding Coalition: 1.Estimates of contributing factors 2.Confidence in estimate 3.Values are then averaged
  • 23.
    Monetary Value forTurnover • $3,200 per turnover x 380 (change) = $1,216,000 • $1,216,000 x 85% estimate = $1,033,600
  • 24.
    Combined Monetized Benefits Measure Annual Change Unit Value Annual Improvement Value Confidence % Adjustments based on Confidence Error Rates 336 $750 $252,000 92% $231,840 Turnover 380 $3,200 $1,216,000 85% $1,033,600
  • 25.
    Project Costs Costof Item Cost Diagnostics $12,000 Strategic Planning Sessions $112,000 Leadership Development $550,000 360° Feedback $25,500 Program Materials $22,000 Overhead $1,500 Facilities, food and refreshments $8,000 Communication $5,000 Participant salaries (time involved) $95,000 Evaluation Costs $18,500 TOTAL $849,000
  • 26.
    ROI % = RROOII RReessuullttss *Net Benefits Costs *Net = Benefits - Costs Costs = $849,000 Benefits = $1,265,440 x 100 Now it’s your turn! Calculate the ROI.
  • 27.
    ROI = RROOIIRReessuullttss $1,265,440 - $849,000 $849,000 49% ROI
  • 28.
    AAssssuummppttiioonnss • Highturnover in tight labor market impacts required hiring numbers • People leave their jobs because of supervisor • Estimates used in isolating the effects are credible way to determine contribution from intervention
  • 29.
    Conclusions • Preliminaryfindings indicate that the intervention appears to be impacting turnover and error rates in favorable way • Marked decrease in problems with filling customer orders on time • Customer satisfaction increased • Improvement observed in communication and problem solving
  • 30.
    • Provided withthe case study, participants were instructed to brainstorm
  • 31.
    Group 1 Smile Sheet — Why are you here? — Was this helpful / useful? — Are you motivated to take action? — Will you use what you learned? — Rate the importance of your current work?
  • 32.
    Group 2 Learning — Pre-training vs. Post-training scoring  Time on (Learning curve) — Assessment during training  Confidence  Readiness  Competencies — Understanding key resources — Self knowledge  Knowing when I need help  Knowing enough to self correct
  • 33.
    Group 3 Leadership Behavior — Before and after — Decision making process  Time  # ppi involved  Implementation success? — Change metrics from cultural assessment — Before and after interviews / survey  Managers and up  Managers and down — GAPS! Map (RR)
  • 34.
    Internal Measures –Customer Satisfaction Group 4 • On time orders / deliveries • Reduced returns / re-do’s • Surveys • Referrals – Quality – Staff morale • Impact of engagement • How they are engaged External Measures – What is most important to the customer? – What are you willing to do if you are satisfied?
  • 35.
    Group 5 R/I — R =  Savings  Profit  Productivity  Personnel Turnover  Staff and Customer satisfaction — Intangibles  Goodwill  Morale  Identity  Loyalty — I =  Direct cost – consultant  Participation  Supplies  Facilities  Opportunities