This document summarizes an analysis of energy losses in compressors used at United Nigerian Textile Limited in Kaduna, Nigeria. The author conducted experiments on the compressors and simulated the results using Hysys simulation software. The experimental results found annual energy savings of 11,700 kWh/yr and cost savings of N99450/yr from reducing losses. Simulation results validated the experimental findings and determined additional compressor performance parameters such as a polytropic efficiency of 74.26%. The analysis provides a method for evaluating energy losses and savings in compressor systems.
Episode 59 : Introduction of Process Integration
Pinch Diagram and Heat Integration
Reference: Notes from course on “Modelling, design and control for process integration”, CAPEC, August 2000 (R. Dunn)
SAJJAD KHUDHUR ABBAS
Ceo , Founder & Head of SHacademy
Chemical Engineering , Al-Muthanna University, Iraq
Oil & Gas Safety and Health Professional – OSHACADEMY
Trainer of Trainers (TOT) - Canadian Center of Human
Development
Episode 54 : CAPE Problem Formulations
Computer Aided Process Engineering
Lecture 2: CAPE Problem Formulations
* Four types of CAPE problems
Flowsheeting Specification (Design) Optimization (Design) Synthesis (& Design)
SAJJAD KHUDHUR ABBAS
Ceo , Founder & Head of SHacademy
Chemical Engineering , Al-Muthanna University, Iraq
Oil & Gas Safety and Health Professional – OSHACADEMY
Trainer of Trainers (TOT) - Canadian Center of Human
Development
Optimization of performance and emission characteristics of dual flow diesel ...eSAT Journals
Abstract
Depleting sources of fossil fuels coupled with after effects of exhaust gases on environment i.e. global warming and climate change has necessitated the need for development and use of alternate biodegradable fuels. In this present study optimization of performance and emission characteristics has been carried out using dual flow of CNG and Diesel with varying EGR under varying load by Taguchi method. Optimum values of output response parameters have been calculated with the help of regression equation and influence of various factors on output response has carried out with the help of analysis of variance.
Keywords: Taguchi method, CNG, EGR, biodegradable fuels
The mean key variable to control the burner performance for safe and efficient operations is the amount of excess air or oxygen which flow to react with fuel. In accordance with Typical Draft Profile in a Natural Draft furnace the numerical results of computing fluid dynamics model of the air flow from the environment to the burner by adjusting the area of air box prototype openings will give the necessary information to adjust the performance of burner as optimum. The model of air box prototype is useful tool in applying similarity theory on another burners̕ designs which depends the air box tools to calibrate the quantity of combustion air flow to the burner.
An approach to evaluate the heat exchanger retrofit for installed industrial ...eSAT Journals
Abstract This is part 2 of the conducted study to develop a new systematic method to evaluate the heat exchanger retrofit on existing industrial gas turbines. A new approach has been introduced and validated in the first part comparing with the measured data. This method was used to optimize the obtained cycle performance characteristics and the generated heat exchanger design options based on technical prospective to attain the highest possible improvement on the simple cycle performance. However, it is essential to consider the economic viability of using the recuperative cycle which will be investigated in thispaper. Although that there are several tools which can be used to achieve that objective, this study uses the Net Present Value (NPV) method due to its simplicity and accuracy. The established technique has been applied for the same described gas turbine cycles in the previous part. Based on the stated assumptions, it was found that by applying the recuperation in the first engine,W6BRC, and at full load and 100% utilization factor conditions, the payback period has increased by one year by applying over that of simple cycle. Moreover, at the end of the project life, the recuperative cycle of this engine is expected to achieve an increase of $11M in the NPV over that of simple cycle. This difference between the two cycles becomes greater in the case of the second engine, W7FA, which is ranging between $33.9M and $46.8M.However, the drop in the availability of the overall recuperative gas turbine by about 18% over the simple cycle gas turbine causes the NPV of both cycles to be equal. Moreover, this paper includes a sensitivity study to investigate the effects of utilization factor and recuperator effectiveness and pressure drop on the cumulative discounted cash flow. KeyWords:new systematic method,economic viability, Net Present Value, utilization factor,availability
Recuperative heat exchangers in the exhaust nozzle of an Aero engineMOHAMMED FAZIL
This new technology provides environment friendly and fuel efficient aircraft engine for a Green Era.This is the best ever technology in the field of aircraft propulsion.
Fire model for sizing high consequence areas associated with natural gas pipe...Thapa Prakash (TA-1)
The subject report is developing by Prakash Thapa Memorial University St. Johns, Newfoundland, Canada for the Research unite in Oil Gas and Safety Engineering for Memorial University St. John’s Newfoundland Canada. The report was dated November 20th 2015 and the report’s recommended equation for determining potential impact radius (PIR) of a natural gas pipeline rupture is included in 49 CFR 192.903. This PIR equation is given as:
Validation of Experimental and Numerical Techniques for Flow Analysis over an...IJERA Editor
The impact of improvement in vehicle aerodynamics mainly reflects in lower fuel consumption and lower carbon dioxide emissions into the atmosphere. The governments of many countries support continuous aerodynamics’ improvement programs as a way of mitigating the energy crisis and atmospheric pollution. This work has the main goal to validate experimental and numerical techniques for application in road vehicles. The experimental results were obtained through the analysis of the flow around a standard body with simple geometry called Ahmed Body, using hot wire anemometry from experiments in wind tunnel. It was also proposed a computational validation using a commercial software (Star CCM +) to further analyze the flow and to corroborate the experimental results. Both results were compared and allowed characterizing the flow around the vehicle. The results obtained analyzing the Ahmed Body aimed further application on aerodynamics of heavyduty vehicles, which is an ongoing research being developed at the Experimental Aerodynamics Research Center – CPAERO, in Brazil.
Evaluating AERMOD and Wind Tunnel Derived Equivalent Building DimensionsSergio A. Guerra
While the current EBD method is the best available option to determine correct building dimensions in the model, a different method was suggested by EPA in the 2011 Memo: Model Clearinghouse Review of EBD for AERMOD.9 Attachment B to the 2011 Memo includes an assessment of the Alcoa Davenport Works EBD Study. In this evaluation EPA compared wind tunnel observations with AERMOD derived concentrations. However, this evaluation has important shortcomings. First, to carry out this comparison between wind tunnel and AERMOD concentrations, it is necessary to collect velocity profiles that include longitudinal and vertical turbulent intensity measurements upwind of the stack. These data were not available for the EPA evaluation of the Alcoa Davenport Works EBD Study. Second, the wind tunnel model operating conditions were converted to full scale conditions by using exact similarity. However, exact similarity is not used to specify model operating conditions since only momentum ratios are matched but not buoyancy ones. Whereas EPA did not provide important details on how this study was performed, this paper outlines how to properly carry out this new method where AERMOD is used to determine equivalent building dimensions. The viability of this new method was also evaluated and discussed.
PEMS is a powerful emissions measurement tool that can be used for certification tests and development research. SGS presented three case studies using PEMS to: 1) Benchmark a Final Tier 4 Excavator by classifying modal emissions, 2) Develop in-use routes to compare route selection and altitude effects on light-duty vehicles, and 3) Validate a predictive analytics platform for on-road fuel consumption and emissions.
Parasites Associated with wild-caught houseflies in Awka metropololisIOSR Journals
Investigation of parasites associated with wild-caught houseflies in Awka metropolis, Anambra State, southeastern Nigeria, was undertaken between April and August, 2012. Locally designed fly traps were used to collect flies. The flies were identified into genera and species using their characteristic features. These flies were demobilized by chilling, washed with sterilized distilled water, and the suspension homogenised before processing for parasites on their external body parts. For internal parasites, the external surfaces of the flies were sterilized with 70% alcohol, squashed to release the internal contents and the suspension homogenized with 100ml distilled water. Aliquots of the suspensions from both the internal and external contents of the flies were used for parasite isolations and identification using standard parasitological techniques. Eight fly species were processed for parasites identification. Parasites isolated from the flies were Entamoeba histolytica cysts, Hookworm ova, Ascaris lumbricoides ova, and Trichuris trichiura ova. All the parasites isolated were from the external surfaces of the flies. This reveals the fact that wild-caught flies, especially M. domestica, harbour parasites on their bodies, which can cause diseases. Hence, there is need for improved sanitation in our urban communities, to prevent epidemics associated with poor sanitary conditions.
Implementation of XOR Based Pad Generation Mutual Authentication Protocol for...IOSR Journals
In RF link, without security the messages exchange between the two devices are monitoring by an
eavesdropper. So the exclusive-OR (XOR) based pad generation protocol is used to safely transfer the data to
the other point with necessary security and it maintaining confidentiality. This protocol produce the cover
coding pad to mask the access password before the datas are transmitted. A specially designed pad generation
will be implemented in digital domain to solve the insecurity problem in data communication RF link. This
protocol developed under regulation of ISO 18000 – 6 type C protocol also known as EPC C1G2 RFID
protocol. The linear feed back shift register (LFSR) generate the pseudo random binary sequence (PRBS) and it
is used as data source to the pad generation function. The Xilinx 13.x software is used for synthesize and
modelsim SE6.0 is used for simulating the result. The pad generation algorithm has been implemented in FPGA
Spartan 3 PQ208-4 board to verify the result
Effect of Annealing and Time of Crystallization on Structural and Optical Pro...IOSR Journals
In this report pure poly(vinylidene fluoride) (PVDF) films were prepared by casting method using acetone solvent. The crystallization of both α and β phase from acetone solvent by varying the time of crystallization has been described. This paper also describes the enhancement of β phase at different annealing condition. β phase dominant thin films were obtained when as cast thin films were annealed at 90 ºC for 5 hours. The PVDF films with dominant α-phase were obtained, when time of crystallization is extend. From (X-ray diffraction) XRD and Fourier Transform Infrared Spectrum (FTIR) it is confirmed that the PVDF thin films, cast from acetone solution and annealed at 90 ºC for 5 hours, have maximum percentage of β-phase. Presence of the crystalline α and β phases in each sample was confirmed by X-ray Diffraction (XRD) and Fourier transform infrared spectroscopy (FTIR). We found that of PVDF when crystallized from its acetone solutions led to the formation of β phase. UV-visible optical absorption analysis revealed a change in the optical gap and shift in absorption edge with annealing temperature.
Antibiotic Susceptibility Pattern of Pyogenic Bacterial Isolates in Sputum.IOSR Journals
Drugs Have Been Used For The Treatment Of Infectious Diseases Since 17th Century , However
Chemotherapy As A Science Has Began With Paul Ehrlich In The First Decade Of 20th Century . Paul Ehrlich
(1854-1915) Was One Of The Earliest Pioneers In The Field Of Antimicrobial Chemotherapy .1Ehrlich
Formulated The Principles Of “Selective Toxicity” ,I.E; Selective Inhibition Of The Growth Of Microorganisms
Without Damage To The Host.2 Resistance Has Been Documented Not Only Against Antibiotics Of
Natural And Semi- Synthetic Origin , But Also Against Purely Synthetic Compounds (Flouroquinolone) Or
Those Which Do Not Even Enter The Cells (Vancomycin) .3 However , The Euphoria Over The Potential
Conquest Of Infectious Diseases Was Short-Lived .Almost As Soon As Antibacterial Drugs Were Deployed ,
Bacteria Responded By Manifesting Various Forms Of Resistance.4 Considered As “Wonder Drugs”
Antibiotics Are Often Prescribed Inappropriately And Inadequately And Have Thus Became One Of The
Highly Abused Agents.5
Meditation for stress reduction in Indian Army- An Experimental StudyIOSR Journals
1.1 Stress is defined as “the non-specific response of the body to any demand made upon it.” Hans Sely (1956). Lazarous (1966) maintains that stress occurs when demands on the person which tax or exceed his judgment resources. McGrath JE (1990) explains that there is a potential for stress when an environmental situation is perceived as presenting a demand which threatens to exceed the person‟s capabilities and resources for meeting it under conditions where he has expected a substantial differential in the rewards and cost for meeting the demands verses not meeting it.Stress can be the result of external situations such as an abusive relationship or poor working conditions. Stress can also be the result of internal situations or stressors such as worrying or having pessimistic thoughts about future. Work being the central theme to the life and a social reality provides a status to the individual and his bond to the society by way of quality of work or position he attains. This ultimately leads to raise the standard of living or we can call it desire to grow, so that we can get recognition and social status in the society. In the ambition to grow we begin to work more than our capabilities and thus strain ourselves and thus lead to stress. (Prestonjee DM &Muncherji (1991)). Duration in stress is another variable which acts as a factor causing stronger stress response. This is in consistence with uncertainty theory of occupational stress by Beer TA and Bhagat RS (1985).Each individual needs a moderate amount of stress to be alert and capable of functioning effectively in an organization. Hence stress is inherent in the concept of creativity. [Pestonjee(1991) Pareek(1993)].
A optimized process for the synthesis of a key starting material for etodolac...IOSR Journals
Abstract An optimized process developed for the synthesis of 7-ethyltryptophol, a key starting material for etodolac, a non steroidal anti- inflammatory drug. Starting from commercially available 2-ethylphenylhydrazine. HCl and dihydro furan with con. H2SO4 as a catalyst in N, N- dimethyl acetamide ( DMAc). H2O (1:1) as a solvent in 75% yield . the method is easy, inexpensive , without purification getting pure solid. The process is very clean, high yielding & high quality and operationally simple.
Keywords: Etodolac, 7-ethyl tryptophol, 2-ethyl phenyl hydrazine hydrochloride, N,N-dimethyl acetamide.
“Proposed Model for Network Security Issues Using Elliptical Curve Cryptography”IOSR Journals
Abstract: Elliptic Curve Cryptography (ECC) plays an important role in today’s public key based security
systems. . ECC is a faster and more secure method of encryption as compared to other Public Key
Cryptographic algorithms. This paper focuses on the performance advantages of using ECC in the wireless
network. So in this paper its algorithm has been implemented and analyzed for various bit length inputs. The
Private key is known only to sender and receiver and hence data transmission is secure.
Public Expenditure on Education; A Measure for Promoting Economic DevelopmentIOSR Journals
The rational utilization and allocation of public expenditure would result into an economic development of the country. It has been observed that allocation and utilization of expenditure in Pakistan have been very little towards development. The allocation of current expenditure such as debt servicing and defense has increased by a greater percentage every year as compared to education. Money borrowed by the economy over the years, if had been put to the development of projects, the economy would have seen much higher development and growth. The objective of the research lies in evaluating the public expenditure and its role in economic development by considering education as an indicator to social development in Pakistan.
Effect of Poling Field and Non-linearity in Quantum Breathers in FerroelectricsIOSR Journals
Abstract : Lithium tantalate is technologically one of the most important ferroelectric materials with a low poling field that has several applications in the field of photonics and memory switching devices. In a Hamiltonian system, such as dipolar system, the polarization behavior of such ferroelectrics can be well-modeled by Klein-Gordon (K-G) equation. To probe the quantum states related to discrete breathers, the same K-G lattice is quantized to give rise to quantum breathers (QBs) that are explained by a periodic boundary condition. The gap between the localized and delocalized phonon-band is a function of impurity content that is again related to the effect of pinning of domains due to antisite tantalum defects in the system, i.e. a point of easier switching within the limited amount of data on poling field.
Use of Hydrogen in Fiat Lancia Petrol engine, Combustion Process and Determin...IOSR Journals
To our path towards green economy, Hydrogen is often regarded to have a potential growth in the
coming future. However, the high cost of operation of fuel cell has often been a setback. If we could make use of
hydrogen gas as a fuel directly, the scope of development broadens. Owing to these aspects, this work primarily
focuses on the simulation technique of an Internal Combustion Spark Ignition Engine powered by Hydrogen gas.
The simulations of various stages have been carried out using the discrete approach, thereby investigating the
pressures and temperatures at various instants in the cycle. For the relative performance discussion we have
simulated the different cycles as ideal cycle, air fuel cycle and actual cycle. The resultant cyclic graph indicates
various discrepancies between ideal, air fuel and actual cycle. This analysis serves as a tool for a better
understanding of the variables involved and helps in optimizing engine design and fixing of various parameters,
including the determination of valve timings. Besides this, backfire, is the commonly faced problem with the
hydrogen engines. To reduce this effect, a fuel injectoris used for adding the gaseous fuel to the combustion
chamber.
Engineers often use softwares to perform gas compressor calculations to estimate compressor duty, temperatures, adiabatic & polytropic efficiencies, driver & cooler duty. In the following exercise, gas compressor calculations for a pipeline composition are shown as an example case study.
Turbofan Engine Modelling and Control Design using Linear Quadratic Regulator...theijes
There are many applications in which gas turbine engine is used today, including aircraft propulsion for both commercial and military purposes, and power generation and in all these Control systems technology has played a fundamental role in enhancing performance. Modelling plays a significant role in the development of the entire engine system performance. This paper investigated Linear Quadratic Regulator (LQR) model-based control method to obtain estimates of performance parameters. The main control variable selected is the fuel flow to control the rotational speed of high-pressure spool speed of the turbofan engine. Firstly a suitable mathematical model of the engine is developed in MATLAB Simulink environment with both the intercomponent volume and the constant mass flow methods used. Equations of the mass flow rate and the torque balance are incorporated in the steady state and dynamic state of the thermodynamic engine model. This represents the engine model by a set of first-order differential and algebraic equations and a linearized model is extracted for the analysis and design of a controller by LQR. It is demonstrated that LQR based controllers can perform better than conventional PID controllers. The settling time, rise time and maximum overshoot for LQR based controller are all less than those for PID based controller. The input also changes more accurately for LQR than the PID controller compared.
Metamodel-based Optimization of a PID Controller Parameters for a Coupled-tan...TELKOMNIKA JOURNAL
Liquid flow and level control are essential requirements in various industries, such as paper
manufacturing, petrochemical industries, waste management, and others. Controlling the liquids flow and
levels in such industries is challenging due to the existence of nonlinearity and modeling uncertainties of
the plants. This paper presents a method to control the liquid level in a second tank of a coupled-tank plant
through variable manipulation of a water pump in the first tank. The optimum controller parameters of this
plant are calculated using radial basis function neural network metamodel. A time-varying nonlinear
dynamic model is developed and the corresponding linearized perturbation models are derived from the
nonlinear model. The performance of the developed optimized controller using metamodeling is compared
with the original large space design. In addition, linearized perturbation models are derived from the
nonlinear dynamic model with time-varying parameters.
The Art of the Pitch: WordPress Relationships and SalesLaura Byrne
Clients don’t know what they don’t know. What web solutions are right for them? How does WordPress come into the picture? How do you make sure you understand scope and timeline? What do you do if sometime changes?
All these questions and more will be explored as we talk about matching clients’ needs with what your agency offers without pulling teeth or pulling your hair out. Practical tips, and strategies for successful relationship building that leads to closing the deal.
Smart TV Buyer Insights Survey 2024 by 91mobiles.pdf91mobiles
91mobiles recently conducted a Smart TV Buyer Insights Survey in which we asked over 3,000 respondents about the TV they own, aspects they look at on a new TV, and their TV buying preferences.
DevOps and Testing slides at DASA ConnectKari Kakkonen
My and Rik Marselis slides at 30.5.2024 DASA Connect conference. We discuss about what is testing, then what is agile testing and finally what is Testing in DevOps. Finally we had lovely workshop with the participants trying to find out different ways to think about quality and testing in different parts of the DevOps infinity loop.
Builder.ai Founder Sachin Dev Duggal's Strategic Approach to Create an Innova...Ramesh Iyer
In today's fast-changing business world, Companies that adapt and embrace new ideas often need help to keep up with the competition. However, fostering a culture of innovation takes much work. It takes vision, leadership and willingness to take risks in the right proportion. Sachin Dev Duggal, co-founder of Builder.ai, has perfected the art of this balance, creating a company culture where creativity and growth are nurtured at each stage.
UiPath Test Automation using UiPath Test Suite series, part 3DianaGray10
Welcome to UiPath Test Automation using UiPath Test Suite series part 3. In this session, we will cover desktop automation along with UI automation.
Topics covered:
UI automation Introduction,
UI automation Sample
Desktop automation flow
Pradeep Chinnala, Senior Consultant Automation Developer @WonderBotz and UiPath MVP
Deepak Rai, Automation Practice Lead, Boundaryless Group and UiPath MVP
Connector Corner: Automate dynamic content and events by pushing a buttonDianaGray10
Here is something new! In our next Connector Corner webinar, we will demonstrate how you can use a single workflow to:
Create a campaign using Mailchimp with merge tags/fields
Send an interactive Slack channel message (using buttons)
Have the message received by managers and peers along with a test email for review
But there’s more:
In a second workflow supporting the same use case, you’ll see:
Your campaign sent to target colleagues for approval
If the “Approve” button is clicked, a Jira/Zendesk ticket is created for the marketing design team
But—if the “Reject” button is pushed, colleagues will be alerted via Slack message
Join us to learn more about this new, human-in-the-loop capability, brought to you by Integration Service connectors.
And...
Speakers:
Akshay Agnihotri, Product Manager
Charlie Greenberg, Host
"Impact of front-end architecture on development cost", Viktor TurskyiFwdays
I have heard many times that architecture is not important for the front-end. Also, many times I have seen how developers implement features on the front-end just following the standard rules for a framework and think that this is enough to successfully launch the project, and then the project fails. How to prevent this and what approach to choose? I have launched dozens of complex projects and during the talk we will analyze which approaches have worked for me and which have not.
JMeter webinar - integration with InfluxDB and GrafanaRTTS
Watch this recorded webinar about real-time monitoring of application performance. See how to integrate Apache JMeter, the open-source leader in performance testing, with InfluxDB, the open-source time-series database, and Grafana, the open-source analytics and visualization application.
In this webinar, we will review the benefits of leveraging InfluxDB and Grafana when executing load tests and demonstrate how these tools are used to visualize performance metrics.
Length: 30 minutes
Session Overview
-------------------------------------------
During this webinar, we will cover the following topics while demonstrating the integrations of JMeter, InfluxDB and Grafana:
- What out-of-the-box solutions are available for real-time monitoring JMeter tests?
- What are the benefits of integrating InfluxDB and Grafana into the load testing stack?
- Which features are provided by Grafana?
- Demonstration of InfluxDB and Grafana using a practice web application
To view the webinar recording, go to:
https://www.rttsweb.com/jmeter-integration-webinar
Slack (or Teams) Automation for Bonterra Impact Management (fka Social Soluti...Jeffrey Haguewood
Sidekick Solutions uses Bonterra Impact Management (fka Social Solutions Apricot) and automation solutions to integrate data for business workflows.
We believe integration and automation are essential to user experience and the promise of efficient work through technology. Automation is the critical ingredient to realizing that full vision. We develop integration products and services for Bonterra Case Management software to support the deployment of automations for a variety of use cases.
This video focuses on the notifications, alerts, and approval requests using Slack for Bonterra Impact Management. The solutions covered in this webinar can also be deployed for Microsoft Teams.
Interested in deploying notification automations for Bonterra Impact Management? Contact us at sales@sidekicksolutionsllc.com to discuss next steps.
Key Trends Shaping the Future of Infrastructure.pdfCheryl Hung
Keynote at DIGIT West Expo, Glasgow on 29 May 2024.
Cheryl Hung, ochery.com
Sr Director, Infrastructure Ecosystem, Arm.
The key trends across hardware, cloud and open-source; exploring how these areas are likely to mature and develop over the short and long-term, and then considering how organisations can position themselves to adapt and thrive.
Neuro-symbolic is not enough, we need neuro-*semantic*Frank van Harmelen
Neuro-symbolic (NeSy) AI is on the rise. However, simply machine learning on just any symbolic structure is not sufficient to really harvest the gains of NeSy. These will only be gained when the symbolic structures have an actual semantics. I give an operational definition of semantics as “predictable inference”.
All of this illustrated with link prediction over knowledge graphs, but the argument is general.
LF Energy Webinar: Electrical Grid Modelling and Simulation Through PowSyBl -...DanBrown980551
Do you want to learn how to model and simulate an electrical network from scratch in under an hour?
Then welcome to this PowSyBl workshop, hosted by Rte, the French Transmission System Operator (TSO)!
During the webinar, you will discover the PowSyBl ecosystem as well as handle and study an electrical network through an interactive Python notebook.
PowSyBl is an open source project hosted by LF Energy, which offers a comprehensive set of features for electrical grid modelling and simulation. Among other advanced features, PowSyBl provides:
- A fully editable and extendable library for grid component modelling;
- Visualization tools to display your network;
- Grid simulation tools, such as power flows, security analyses (with or without remedial actions) and sensitivity analyses;
The framework is mostly written in Java, with a Python binding so that Python developers can access PowSyBl functionalities as well.
What you will learn during the webinar:
- For beginners: discover PowSyBl's functionalities through a quick general presentation and the notebook, without needing any expert coding skills;
- For advanced developers: master the skills to efficiently apply PowSyBl functionalities to your real-world scenarios.
Let's dive deeper into the world of ODC! Ricardo Alves (OutSystems) will join us to tell all about the new Data Fabric. After that, Sezen de Bruijn (OutSystems) will get into the details on how to best design a sturdy architecture within ODC.
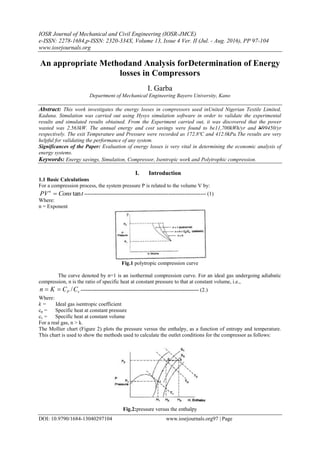
1. IOSR Journal of Mechanical and Civil Engineering (IOSR-JMCE)
e-ISSN: 2278-1684,p-ISSN: 2320-334X, Volume 13, Issue 4 Ver. II (Jul. - Aug. 2016), PP 97-104
www.iosrjournals.org
DOI: 10.9790/1684-13040297104 www.iosrjournals.org97 | Page
An appropriate Methodand Analysis forDetermination of Energy
losses in Compressors
I. Garba
Department of Mechanical Engineering Bayero University, Kano
Abstract: This work investigates the energy losses in compressors used inUnited Nigerian Textile Limited,
Kaduna. Simulation was carried out using Hysys simulation software in order to validate the experimental
results and simulated results obtained. From the Experiment carried out, it was discovered that the power
wasted was 2.563kW. The annual energy and cost savings were found to be11,700kWh/yr and N99450/yr
respectively. The exit Temperature and Pressure were recorded as 172.8ºC and 412.0kPa.The results are very
helpful for validating the performance of any system.
Significances of the Paper: Evaluation of energy losses is very vital in determining the economic analysis of
energy systems.
Keywords: Energy savings, Simulation, Compressor, Isentropic work and Polytrophic compression.
I. Introduction
1.1 Basic Calculations
For a compression process, the system pressure P is related to the volume V by:
tConsPVn
tan -------------------------------------------------------------------- (1)
Where:
n = Exponent
Fig.1 polytropic compression curve
The curve denoted by n=1 is an isothermal compression curve. For an ideal gas undergoing adiabatic
compression, n is the ratio of specific heat at constant pressure to that at constant volume, i.e.,
vP CCKn / ------------------------------------------------------------------ (2.)
Where:
k = Ideal gas isentropic coefficient
cp = Specific heat at constant pressure
cv = Specific heat at constant volume
For a real gas, n > k.
The Mollier chart (Figure 2) plots the pressure versus the enthalpy, as a function of entropy and temperature.
This chart is used to show the methods used to calculate the outlet conditions for the compressor as follows:
Fig.2:pressure versus the enthalpy
2. An appropriate Methodand Analysis forDetermination of Energy losses in Compressors
DOI: 10.9790/1684-13040297104 www.iosrjournals.org98 | Page
Figure 3 Typical Mollier chart for compression
A flash is performed on the inlet feed at pressure P1, and temperature T1, using a suitable K-value and
enthalpy method. The entropy S1, and enthalpy H1 are obtained and the point (P1, T1, S1, H1) are obtained.
The constant entropy line through S1 is followed until the user-specified outlet pressure is reached. This point
represents the temperature (T2) and enthalpy conditions (H2) for an adiabatic efficiency of 100%. The adiabatic
enthalpy change ∆Had is given by:
12 HHHad --------------------------------------------------------------------- (3)
If the adiabatic efficiency, ad, is given as a value less than 100 %, the actual enthalpy change is calculated
from:
ad
ad
ac
H
H
------------------------------------------------------------- (4)
The actual outlet stream enthalpy is then calculated using:
acHHH 13 H3-------------------------------------------------------- (5)
Point 3 on the Mollier chart, representing the outlet conditions is then obtained. The phase split of the outlet
stream is obtained by performing an equilibrium flash at the outlet conditions.
The isentropic work (Ws) performed by the compressor is computed from:
JHJHHW acs )( 13 ---------------------------------------------- (6)
Where:
J = mechanical equivalent of energy
The isentropic power required is:
33000
778
F
HGHP adad -------------------------------------------------------- (7)
ad
ad
acac
GHPF
HGHP
33000
778 ----------------------------------------------- (8)
778 HHEADad ---------------------------------------------------------------- (9)
Where:
GHP= work, hP
∆H = enthalpy change,
F =mass flow rate,
HEADad =Adiabatic Head,
The factor 33000 is used to convert the units into horsepower.
The isentropic and polytropic coefficients, polytropic efficiency, and poly tropic work can be calculated using
one of the two methods; the method from the GPSA Engineering Data Book, and the method from the ASME
Power Test Code 10.
ASME Method
This method is more rigorous than the default GPSA method, and yields better results over a wider range of
compression ratios and feed compositions.
For a real gas, as previously noted, the isentropic volume exponent (also known as the isentropic coefficient), ns,
is not the same as the compressibility ratio, k. The ASME method distinguishes between k and ns for a real gas.
3. An appropriate Methodand Analysis forDetermination of Energy losses in Compressors
DOI: 10.9790/1684-13040297104 www.iosrjournals.org99 | Page
Adiabatic Efficiency Given
In this method, the isentropic coefficient nsis calculated as:
)/ln(/)/ln( 2112 VVPPns ------------------------------------------------------------- (10)
Where:
V1 = Volume at the inlet conditions
V2 = Volume at the outlet pressure and inlet entropy conditions
P1= Pressure at the inlet conditions
P2= Pressure at the outlet conditions
The compressor work for a real gas is calculated from equation (2.8), and the factor from the following
relationship:
]1)/[()]1/([144 /)1(
1211 ss nn
ssac PPVPfnnW ----------------------------- (11)
The ASME factor f is usually close to 1. For a perfect gas, f is exactly equal to 1, and the isentropic coefficient
nsis equal to the compressibility factor k.
The polytropic coefficient, n, is defined by:
)/ln(/)/ln( 2112 VVPPn --------------------------------------------------------------- (12)
The polytropic work, i.e., the reversible work required to compress the gas in a polytropic compression process
from die inlet conditions to the discharge conditions is computed using:
}1
1
){(
)1
(144 1211
n
n
PPVPf
n
n
Wp -------------------------------------- (13)
Where:
Wp = polytropic work
For ideal or perfect gases, the factor f is equal to 1. The polytropic efficiency is then calculated by:
p
s
p
W
W
p------------------------------------------------------------------------- (14)
Where Ws = isentropic work
This polytropic efficiency will not agree with the value calculated using the GPSA method which is computed
using p = {(n-l)/n) / {(k-l)/k}.
GPSA Method
This GPSA method is the default method, and is more commonly used in the chemical process industry [9].
In this method, the adiabatic head is calculated from equations above. Once this is calculated, the isentropic
coefficient k is computed by trial and error using:
}1))}{1/{(/){( /)19
1
2
121 kk
ac
P
P
kRTZZHEAD [39]-------------------------(15)
Where:
Z1, Z2 = compressibility factors at the inlet and outlet conditions
R = gas constant
T1 = temperature at inlet conditions.
This trial and error method of computing k produces inaccurate results when the compression ratio,
becomes low. If the calculated compression ratio is less than a value set by the user, the value of k has to be
calculated.If k does not satisfy 1.0 < k < 1.66667, the isentropic coefficient, is calculated by trial and error based
on the following:
kk
PPTZZT /)1(
121212 )/[()/(
---------------------------------------------- (16)
The polytrophic compressor equation is given by:
}1)/}]{(/)1/{(]2/)[( /)1(
12121 nn
p PPnnRTZZHEAD
Where Headp is polytrophic head
The adiabatic head is related to the polytropic head by:
p
p
ad
ad
HEADHEAD
------------------------------------------------------------------- (17)
The polytrophic efficiency n is calculated by:
4. An appropriate Methodand Analysis forDetermination of Energy losses in Compressors
DOI: 10.9790/1684-13040297104 www.iosrjournals.org100 | Page
)]1/(/[)]1/([ kknnp p------------------------------------------------------ (18)
The polytropic coefficient, n, the polytropic efficiency p, and the polytropic head are determined by trial and
error method. The polytropic gas horsepower is then given by:
33000
F
HEADGHP pp ]-----------------------------------------------------(19)
II. Material And Methods
The entropy data needed for these calculations are obtained from a number of entropy calculation
methods. These include die Soave-Redlich-Kwong cubic equation of state, and the Curl-Pitzer correlation
method. Thermodynamic systems may be used to generate entropy data. User-added subroutines may also be
used to generate entropy data.Once the entropy data are generated, the condition of the outlet conditions from
the compressor and the compressor power requirements are computed, using either a user-input adiabatic or
polytrophic efficiency.
III. Results And Discussion
Table 1: Air Facility Reading for 75KI01
Time Air Inlet
Temp.(0
c)
Oil Cooler
L/D Temp
(0
c)
Oil Cooler
L/D
Outlet (0
c)
After Cool
Air Outlet
Temp. (0
c)
Turbine
Inlet Steam
Temp. (0
c)
Turbine Inlet
Steam Pressure
(N/M2
)
Turbine Exhaust
Pressure (N/M2
)
8:00 Hr 32 52 30 34 400 41 17.1
9:00 Hr 30 52 32 34 400 41 17.2
10:00 Hr 32 53 31 34 400 42 17.3
11:00 Hr 30 53 31 34 400 42 16.9
12:00 Hr 33 52 32 34 400 42 17.0
13:00 Hr 32 51 32 34 400 41 17.2
14:00 Hr 33 51 32 34 400 41 17.3
15:00 Hr 33 51 30 34 400 41 17.2
16:00 Hr 33 52 32 34 400 42 17.2
17:00 Hr 33 52 31 34 400 42 17.3
18:00 Hr 33 52 32 34 400 42 17.3
Average 32.4 51.9 31.4 34 400 41.5 17.2
Compressor Heat Loss
Assumption: air is an ideal gas. Steady operating condition exists. There is pressure losses:
1
1
1
1
21
,
n
n
comp
incomp
P
P
n
nRT
W
----------------------------- (20)
KgKJW incomp
/9.2961
101
801
14.18.0
293287.04.1 4.1
4.0
,
A = D2
/4 = (3 x 10⁻³
m2
)/4 = 7.069 x 10⁻⁶
m2
Air leaking through the hole is determined to be
line
line
line
k
edischair
T
K
KRA
RT
P
K
Cm
1
2
1
2 1
1
arg
= 0.008632kg/s
297
14.1
2
287.04.110069.7
297287.0
801
14.1
2
65.0 6
14.1
1
airm
5. An appropriate Methodand Analysis forDetermination of Energy losses in Compressors
DOI: 10.9790/1684-13040297104 www.iosrjournals.org101 | Page
Then the power wasted by the leaking compressed air becomes
incompair
WmwastedPower ,
-------------------------------------- (21)
= 0.008632 x 296.9
= 2.563kW
The compressor operates for 4200 hours a year, and the motor efficiency is 0.92.
Then the annual energy and cost savings are:
Energy savings = power saved x operating hours
motor
= 2.563kW x 4200
0.92
= 11,700kWh/yr
Cost savings = (energy savings) x (unit cost of energy)
= 11700 x N8.50k/wh
= N99450/yr
Compressor Simulation Results:
Table 2: compressor simulation
S/No Simulated Parameters Simulated Values
1. Duty (kW) 5.0684e+02
2. Polytropic Exponential 1.626
3. Adiabatic Efficiency 71.72
4. Adiabatic Head (m) 7586
5. Isentropic Exponential 1.402
6. Polytropic Efficiency 74.26
7. Polytropic Head (m) 7852
8. Polytropic Head Factor 1.000
Table 3: Compressor Rating Curves
S/NO. Flow (ACT m3
/h) Head (m) Efficiency (%)
1. 7812 7680 69.20
2. 8388 7575 72.00
3. 8964 7841 72.48
4. 9504 7347 72.58
5. 1.008e+004 7153 73.08
6. 1.062e+004 6717 72.46
7. 1.120e+004 5858 69.39
8. 1.148e+004 4957 62.91
Table 4: Compressor Flow Limits
S/NO. Flow Limits
1. Surge Curve: Inactive
2. Speed Flow
3. Stone Wall Curve: Inactive
4. Field Flow Rate (ACT_m3
/h) 8330
5. Stone Wall Flow ---
6. Compressor Volume (m3
) 10.00
7. Rotational inertia (kg/m2
) 6.000
8. Radius of gyration (m) 0.2000
9. Mass (kg) 150.0
10. Friction loss factor (rad/min) 3.000
Table 5: Compressor inlet Conditions
Overall
Vapour/Phase Fraction 1.0000
Temperature: (0
C) 70.00
Pressure: (kPa) 208.0
Molar Flow (kgmol/h) 607.7
Mass Flow (kg/h) 1.759e+004
Std Ideal LiqVol Flow (m3
/h) 20.00
Molar Enthalpy (kJ/kgmol) 1283
Mass Enthalpy (kJ/kg) 44.32
Molar Entropy (kJ/kgmol-0
C) 116.2
Mass Entropy (kJ/kg-0
C) 4.015
6. An appropriate Methodand Analysis forDetermination of Energy losses in Compressors
DOI: 10.9790/1684-13040297104 www.iosrjournals.org102 | Page
Heat Flow (kJ/h) 7.797e+005
Molar Density (kgmol/m3
) 7.295e-002
Mass Density (kg/m3
) 2.112
Std Ideal Liq Mass Density (kg/m3
) 879.6
Molar Heat Capacity (kJ/kgmol-0
C) 29.00
Mass Heat Capacity (kJ/kg-0
C) 1.002
Thermal Conductivity (W/m-K) 2.775e-002
Viscosity (cP) 2.093e-002
Molecular Weight 28.95
Z Factor 0.9994
Cp/Cv 1.406
Act. Vol. Flow (m3/h) 8330
Table 6: Compressor Outlet Conditions
Overall
Vapour/Phase Fraction 1.0000
Temperature: (0
C) 172.8
Pressure: (kPa) 412.0
Molar Flow (kgmol/h) 607.7
Mass Flow (kg/h) 1.759e+004
Std Ideal LiqVol Flow (m3
/h) 20.00
Molar Enthalpy (kJ/kgmol) 4286
Mass Enthalpy (kJ/kg) 148.0
Molar Entropy (kJ/kgmol-0
C) 118.2
Mass Entropy (kJ/kg-0
C) 4.083
Heat Flow (kJ/h) 2.604e+006
Molar Density (kgmole/m3
) 0.1111
Mass Density (kg/m3
) 3.215
Std Ideal Liq Mass Density (kg/m3
) 879.6
Molar Heat Capacity (kJ/kgmol-0
C) 29.60
Mass Heat Capacity (kJ/kg-0
C) 1.023
Thermal Conductivity (W/m-K) 3.421e-002
Viscosity (cP) 2.524e-002
Molecular Weight 28.95
Z Factor 1.000
Cp/Cv 1.395
Act. Vol. Flow (m3
/h) 5471
Table 7:Compressor Sizing Input Details
Unit operation type: Compressor
Equipment type: Gas Compressor – Centrifugal Horizontal
Compressor sizing input Details
Operating capacity 17591.48kg/h
Operating adiabatic head 7585.53m
Operating polytropic head 7852.30m
Adiabatic efficiency 71.7188
Polytropic efficiency 74.2551
Operating gas power 506.84 kW
Capacity overdesign factor 1,1000
Head overdesign factor 1,1000
Table 8: Compressor Sizing Data Output
Unit operation type: Compressor
Equipment type: Gas Compressor – Centrifugal Horizontal
Compressor sizing input Details
Design capacity 19350.63kg/h
Design adiabatic head 8344.1m
Design polytropic head 8637.5m
Gas power 613.16kW
Mechanical losses 10.93kW
Design power 624.09kW
Driver power 900hp
7. An appropriate Methodand Analysis forDetermination of Energy losses in Compressors
DOI: 10.9790/1684-13040297104 www.iosrjournals.org103 | Page
Figure .4: Compressor
Figure 5: Head Curves of the Compressor
8. An appropriate Methodand Analysis forDetermination of Energy losses in Compressors
DOI: 10.9790/1684-13040297104 www.iosrjournals.org104 | Page
Fig. 6: Variation of Efficiency with Flow
IV. Discussion Of Results
Simulated Results
From figure 6 (efficiency curves of the compressor) the efficiency increases when the flow (m3
/h) is
high and reduces when the level of the flow (m3
/h) decreases.
From table 2 the adiabatic efficiency was found to be 71.7% while the polytrophic efficiency was 74.3%.
Also from table 4 (compressor flow limits) the friction loss factor was found to be 3.00 rad/min.
From the head curves of the compressor (figure 5), the head decreases when the flow (m3
/h) increases.
The efficiency increases when the flow (m3
/h) increases as shown in figure 6.
V. Conclusion
This work set out to achieve the main goal of exploring ways for an effective energy saving which is
expected to reduce energy cost, generate higher profit and increase capacity utilization. Energy loss which
affects the output of the system was minimized. The empirical process heat loss, the actual values heat loss and
the simulation model heat losss were found to be 2.56Kw, ,9.81kW and 10.93kW. The adiabatic efficiency and
polytropic efficiency were found to be 71.7188% and 74.2551%. Moreover, the mechanical losses was found to
be 10.93kW.
References
[1]. Emshoff, J. R (2001)."Design and use of computer simulation Models". New York: Macmillan,
[2]. Chilton, C. H.(2002)"Cost Engineering in the Process Industries". New York: McGraw – Hill,
[3]. Engeda, Abraham (1999). "From the Crystal Palace to the pump room".Mechanical Engineering.ASME.
[4]. Elliott Company. "Past, Present, Future, 1910-2010"(PDF). Elliott. Retrieved 1 May 2011.
[5]. API ( 2002). Std 673-2002 Centrifugal Fans for Petroleum, Chemical and Gas Industry Services. New York: API.
[6]. Whitfield, A. & Baines, N. C. (1990).Design of Radial Turbomachinery.Longman Scientific and Technical.ISBN 0-470-21667-0.
[7]. Aungier, Ronald H. (2000). Centrifugal Compressors, A Strategy for Aerodynamic Design and Analysis. ASME Press. ISBN 0-
7918-0093-8.
[8]. Saravanamuttoo, H.I.H., Rogers, G.F.C. and Cohen, H. (2001).Gas Turbine Theory.Prentice-Hall.ISBN 0-13-015847-X.
[9]. Baines, Nicholas C. (2005). Fundamentals of Turbocharging. Concepts ETI .
[10]. . SAE/standards/power and propulsion/engines.SAE International.Retrieved 23 April 2011.
[11]. API ( 2002). Std 617-2002 Axial and Centrifugal Compressors and Expander-compressors for Petroleum, Chemical and Gas
Industry Services. New York: API.
[12]. ASHRAE, American Society of Heating, Refrigeration and Air-Conditioning Engineers."Standards &
Guidelines"ASHRAE.Retrieved 23 April 2011.
[13]. API ( 2007). Std 672-2007 Packaged, Integrally Geared Centrifugal Air Compressors for Petroleum, Chemical, and Gas Industry
Services. New York: API.